Toluene Market Size and Share
Market Overview
| Study Period | 2020 - 2031 |
|---|---|
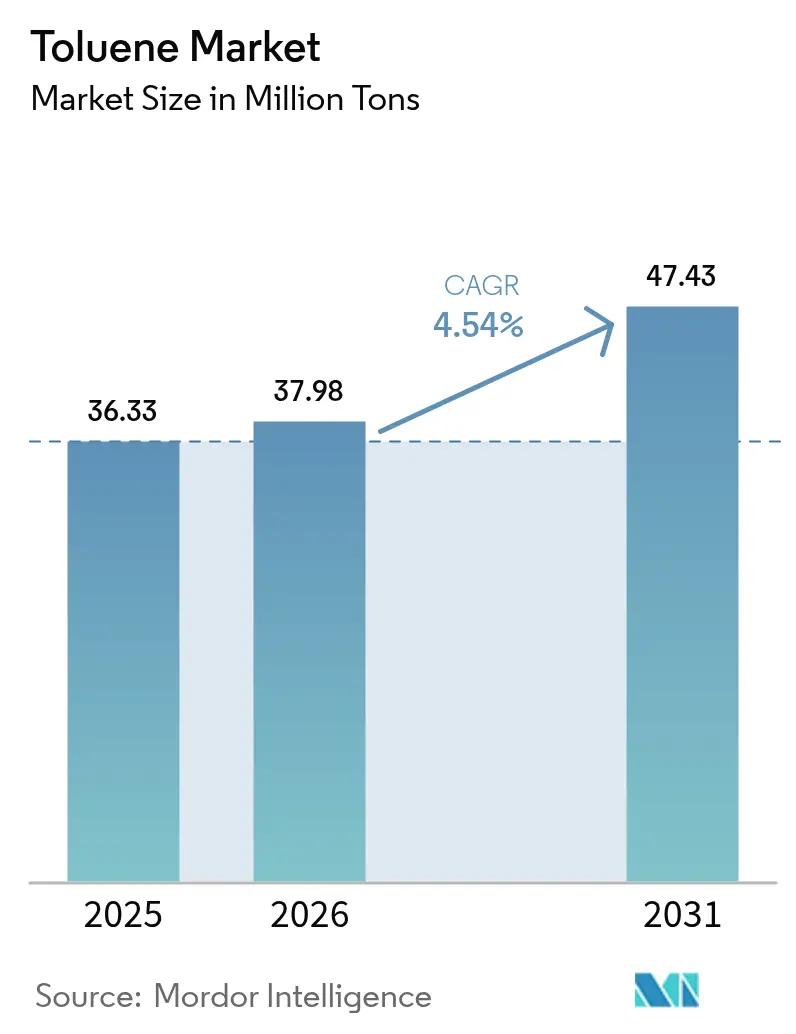
| Market Volume (2026) | 37.98 Million Tons |
| Market Volume (2031) | 47.43 Million Tons |
| Growth Rate (2026 - 2031) | 4.54% CAGR |
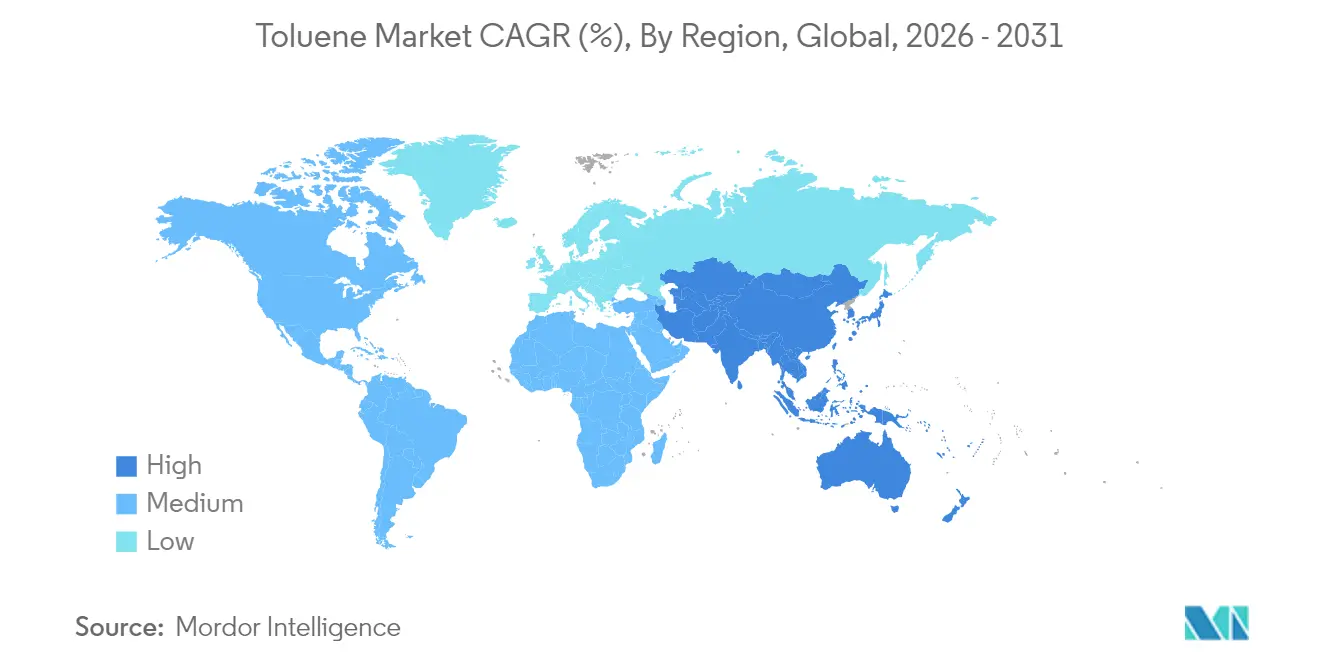
| Fastest Growing Market | Asia-Pacific |
| Largest Market | Asia-Pacific |
| Market Concentration | Medium |
Major Players *Disclaimer: Major Players sorted in no particular order Image © Mordor Intelligence. Reuse requires attribution under CC BY 4.0. | |
Toluene Market Analysis by Mordor Intelligence
The Toluene Market size is expected to grow from 36.33 Million Tons in 2025 to 37.98 Million Tons in 2026 and is forecast to reach 47.43 Million Tons by 2031 at 4.54% CAGR over 2026-2031. Demand growth reflects the chemical’s versatility as an aromatic hydrocarbon used in downstream products such as benzene, xylene, and toluene diisocyanate (TDI), which feed diverse sectors from construction to electronics. Regulatory initiatives to reduce emissions accelerate process upgrades that improve energy efficiency and cut volatile organic compound (VOC) releases, supporting long-term competitiveness. Together, these trends underscore a shift toward integrated, sustainability-oriented supply chains that favor producers able to balance cost leadership with technology investments in cleaner processes.
Key Report Takeaways
- By derivative, benzene and xylene led with 37.70% revenue share in 2025, while TDI is projected to grow the fastest at a 5.37% CAGR to 2031.
- By application, the chemical industry accounted for 63.30% of the toluene market size in 2025 and is advancing at a 4.72% CAGR through 2031.
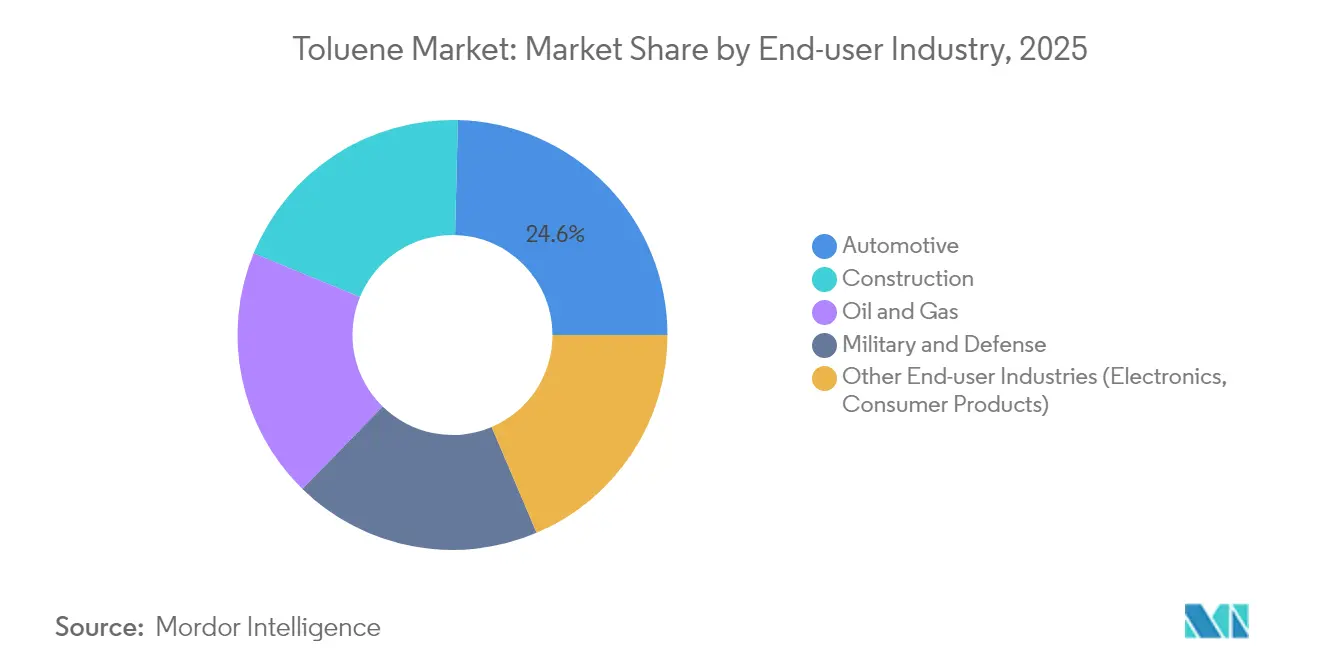
- By end-user industry, automotive led with 24.60% of toluene demand in 2025, whereas construction is poised for the highest 4.82% CAGR through 2031.
- By geography, Asia Pacific captured 54.70% of the toluene market share in 2025; Asia Pacific is also forecast to expand at a 5.48% CAGR to 2031.
Note: Market size and forecast figures in this report are generated using Mordor Intelligence’s proprietary estimation framework, updated with the latest available data and insights as of 2026.
Global Toluene Market Trends and Insights
Driver Impact Analysis*
| Drivers | (~) % Impact on CAGR Forecast | Geographic Relevance | Impact Timeline |
|---|---|---|---|
| ASEAN polyurethane foam build-out | +1.20% | ASEAN, with spillover to China & India | Medium term (2-4 years) |
| Octane-boost mandates in India & China | +0.90% | India, China, regional Asia Pacific impact | Short term (≤ 2 years) |
| Electronics-grade solvent demand | +0.70% | Taiwan, South Korea, Japan | Medium term (2-4 years) |
| US adhesive reformulation away from MeCl | +0.60% | North America, primarily United States | Short term (≤ 2 years) |
| GCC aromatics capacity additions | +1.00% | Saudi Arabia, UAE, Qatar | Long term (≥ 4 years) |
| Source: Mordor Intelligence | |||
Robust Polyurethane Foam Build-out in ASEAN Elevates TDI Consumption
Surging output of flexible foam for furniture, bedding, and vehicle seats is driving incremental TDI demand in Malaysia, Vietnam, and Thailand. Toluene market regional investments, such as Petronas’ RAPID complex, increase local access to toluene-based intermediates, limiting import reliance. Producers are elevating crude-to-chemicals yields to expand aromatics output, placing toluene at the heart of regional polyurethane supply.
Octane-Boost Mandates in India and China Boost Reformate Toluene Intake
India’s Bharat Stage VI and China 6 fuel norms demand higher anti-knock components, prompting refiners to raise reformate volumes enriched with toluene. Numaligarh Refinery’s upgrade to 9 MTPA consolidates local supply, while Chinese integrated complexes channel more aromatics into gasoline blending pools. These moves absorb incremental toluene streams that might otherwise face oversupply, creating a cushion for refinery margins and lifting solvent-grade prices across the toluene market in Asia Pacific.
Electronics-Grade Solvents Demand in Taiwan and South Korea
Semiconductor fabrication requires ultra-pure solvents with parts-per-trillion impurity limits. Taiwan and South Korea dominate this niche, leveraging analytical advances such as ICP-QQQ systems to certify purity. The Toluene market producers are able to segregate and polish refinery grades into electronic-grade lots capture premium margins. The reliable supply of high-purity toluene strengthens the region’s competitive edge in advanced logic and memory chips.
Substitution of Methylene Chloride by Toluene in US Adhesives
The US Environmental Protection Agency’s ban on most industrial methylene chloride uses pivots adhesive formulators toward toluene[1]. Furniture, flooring, and vehicle assembly operations have validated performance parity while avoiding the higher compliance costs tied to more toxic solvents. This regulatory swap enlarges domestic offtake and encourages distributors to maintain larger working inventories, supporting price stability in the toluene market.
Restraint Impact Analysis*
| Restraints | (~) % Impact on CAGR Forecast | Geographic Relevance | Impact Timeline |
|---|---|---|---|
| Tightening EU REACH VOC restrictions | −0.8% | European Union, global supply chain implications | Medium term (2-4 years) |
| Volatility in naphtha and crude spreads | −0.5% | Global; most acute in Asia | Short term (≤ 2 years) |
| Growing bio-based solvent adoption | −0.4% | North America, emerging in Europe | Long term (≥ 4 years) |
| Source: Mordor Intelligence | |||
Tightening EU REACH VOC Restrictions on Aromatics
The European Union has intensified VOC thresholds, prompting paint, coating, and adhesive producers to reformulate away from aromatic solvents[2]. Compliance costs rise through investment in abatement equipment and substitution with higher-priced low-VOC carriers. Toluene market fragmentation emerges as multinational formulators rationalize product lines to accommodate EU and the United Kingdom limits, dampening regional toluene demand in consumer-facing applications.
Volatility in Naphtha and Crude Spreads Compressing Margins
Refiners lacking integrated aromatics units face shrinking crack spreads as crude-to-naphtha differentials swing sharply. Producers adopt flexible cut-point strategies and opportunistic spot purchases, but sustained volatility compels some to evaluate on-purpose production routes such as toluene dealkylation or methanol-to-aromatics. Capital discipline in the toluene industry thus tempers expansion plans despite rising derivative demand.
*Our forecasts treat driver/restraint impacts as directional, not additive. The impact forecasts reflect baseline growth, mix effects, and variable interactions.
Segment Analysis
By Derivative: TDI Demand Reshapes Growth Dynamics
Benzene and xylene retained a 37.70% share of derivative consumption in 2025, underscoring their entrenched role in polyester, nylon, and specialty chemical chains. That leadership secures steady throughput for reformers and aromatics extractors even as margins fluctuate. Meanwhile, the toluene market size tied to TDI is projected to expand at a 5.37% CAGR from 2026-2031, reflecting robust furniture and bedding demand across emerging economies.
Benzaldehyde, benzoic acid, TNT, and niche derivatives carve specialized outlets, but collectively they account for a modest share of the toluene market volumes. Integrated producers balance this portfolio, leveraging economies of scale to supply both commodity and specialty customers.


By Application: Chemical Industry Dominates Value Chain
The chemical industry commanded 63.30% of aggregate demand in 2025, evidencing toluene’s role as an intermediate rather than an end-product. The sector is forecast to log a 4.72% CAGR, keeping its lead despite mounting VOC scrutiny. Toluene market size for coatings and adhesives benefits from solvent strength, yet faces reformulation pressure in Europe, where low-aromatic alternatives gain favor.
Adhesives in the United States capture share after EPA restrictions on methylene chloride, lifting short-term off-take. Explosives maintain a small but stable niche, anchored by military procurement cycles. Pharmaceutical, dye, and degreaser uses endure due to the molecule’s unique reactivity profile that struggles to fully replicate.
By End-User Industry: Construction Outpaces Traditional Sectors
Automotive led 2025 consumption with a 24.60% share, employing toluene in seat foam, coatings, and fuel additives. However, the EPA’s 2027-2032 multi-pollutant vehicle standards aim for 85 g/mile CO₂ by model year 2032, hastening electric-vehicle adoption that could restrain solvent demand in conventional powertrain production.
Construction, by contrast, is projected to advance at a 4.82% CAGR, buoyed by global infrastructure spending that leverages toluene-based sealants, waterproofing membranes, and high-performance coatings.
The oil and gas sector remains a baseline consumer, using toluene to enhance drilling fluid viscosity and dissolve paraffinic deposits. Electronics emerges as a premium niche, requiring high-purity grades that command considerable price differentials. Together, these varied outlets distribute risk and keep the toluene market resilient to cyclical shocks in any industry.
Geography Analysis
Asia Pacific controlled 54.70% of global volumes in 2025, and the region’s 5.48% CAGR cements its status as the primary growth engine for the toluene market. Urbanization, construction booms, and rising vehicle penetration sustain derivative demand throughout ASEAN and South Asia.
North America is a mature yet innovative arena where regulatory decisions ripple globally. The United States is spearheading the phaseout of high-toxicity solvents, inadvertently favoring toluene in specific reformulations. Europe grapples with the strictest VOC rules, trimming solvent demand but stimulating research and development toward low-emission process chemistry.
The Middle East adds new barrels through world-scale mixed-xylene facilities in Saudi Arabia and the United Arab Emirates, positioning the region as a swing supplier for Asia. South America accounts for a smaller slice, yet Brazil’s industrial recovery lifts regional appetite, especially for construction windows tied to major events and infrastructure drives growth in toluene industry.

Competitive Landscape
The toluene market features a wide mix of integrated oil majors, diversified chemical firms, and regional independents. Integrated groups such as Exxon Mobil Corporation and BASF capitalize on feedstock security and downstream synergies that allow flexible optimization between benzene, xylene, and toluene pools. Asian enterprises leverage proximity to demand centers and cost competitiveness to secure market share.
Toluene Industry Leaders
Exxon Mobil Corporation
China Petrochemical Corporation
Formosa Chemicals & Fibre Corp
LyondellBasell Industries Holdings B.V.
BASF
- *Disclaimer: Major Players sorted in no particular order

Recent Industry Developments
- January 2025: Mangalore Refinery and Petrochemicals Limited launched a 40 TMT toluene plant in Odisha, expanding India’s domestic capacity.
- January 2025: BASF increased Lupranate TDI prices by USD 300 per ton in ASEAN and South Asia to offset logistics, energy, and compliance cost inflation.


Research Methodology Framework and Report Scope
Market Definitions and Key Coverage
Our study defines the global toluene market as all industrial-grade methylbenzene produced from catalytic reformate, pygas, or coal-derived streams and then traded or internally consumed as feedstock for solvents, gasoline, and first-line derivatives such as benzene, xylene, and toluene diisocyanate. This entire supply pool, captured by Mordor Intelligence analysts, is first tracked in metric tons; the 2025 baseline stands at 36.33 million tons.
Scope Exclusions: We purposely leave out laboratory reagents, second-stage petrochemicals (for example, phenol or styrene), and transport fuels containing less than one percent toluene by volume.
Segmentation Overview
- By Derivative
- Benzene and Xylene
- Gasoline Additives
- Toluene Diisocyanates (TDI)
- Other Derivatives (Benzoic Acid, Trinitrotoluene (TNT), Benzaldehyde)
- By Application
- Paints and Coatings
- Adhesives and Inks
- Chemical Industry
- Explosives
- Other Applications (Pharmaceuticals, Solvents and Degreasers, Dyes and Pigments)
- By End-user Industry
- Automotive
- Construction
- Oil and Gas
- Military and Defense
- Other End-user Industries (Electronics, Consumer Products)
- By Geography
- Asia-Pacific
- China
- India
- Japan
- South Korea
- Rest of Asia-Pacific
- North America
- United States
- Canada
- Mexico
- Europe
- Germany
- United Kingdom
- France
- Italy
- Rest of Europe
- South America
- Brazil
- Argentina
- Rest of South America
- Middle East and Africa
- Saudi Arabia
- South Africa
- Rest of Middle East and Africa
- Asia-Pacific
Detailed Research Methodology and Data Validation
Primary Research
To cross-check desk findings, we interviewed refinery planners, aromatic solvent distributors, polyurethane formulators, and paint and coating buyers across Asia-Pacific, North America, and Europe. Their insights on contract prices, blending ratios, and derivative run rates filled data gaps and validated cost curves that we later modeled.
Desk Research
We began with publicly available datasets from bodies such as the US Energy Information Administration, UN Comtrade, the International Energy Agency, and the American Chemistry Council, which clarified production, trade, and end-use patterns. Regional safety filings, European Chemicals Agency dossiers, and patent trends accessed through Questel highlighted emerging technologies and regulatory caps that temper demand.
Company 10-Ks, refinery throughputs, and trade press articles gathered via D&B Hoovers and Dow Jones Factiva aligned nameplate capacity with actual supply. This list is illustrative only; many additional open datasets and industry publications supported data collection, validation, and clarification.
Market-Sizing and Forecasting
We start with a top-down production plus trade reconstruction of apparent supply, subtract captive conversion, and price regional volumes using weighted average selling prices. Results are corroborated through selective bottom-up channel checks and sampled ASP x volume calculations with supplier roll-ups for the five largest producers. Key model variables include reformer utilization, gasoline aromatic caps, polyurethane construction demand, coatings output indices, and the benzene toluene price spread, each projected through multivariate regression. Where bottom-up gaps appeared, simple ratio bridges were applied before final convergence.
Data Validation and Update Cycle
Our analyst reviews layer anomaly checks, variance thresholds, and peer sign-offs. Models refresh each year, while any major supply shock or regulation triggers an interim update. A last-mile review is completed just before report release so clients receive the freshest view.
Why Mordor's Toluene Baseline Remains Dependable
We acknowledge that published figures often diverge, and we preview the usual reasons: unit choices, scope width, and refresh cadence. Because our baseline begins with audited tonnage before value conversion, we offer an auditable midpoint clients can trust.
Key gap drivers include whether gasoline blending volumes are counted, how derivative revenue is valued, exchange rate assumptions, and the age of primary input surveys; other publishers vary on each point.
Benchmark comparison
| Market Size | Anonymized source | Primary gap driver |
|---|---|---|
| 36.33 million tons (2025) | Mordor Intelligence | |
| USD 67.84 billion (2024) | Global Consultancy A | Counts every derivative revenue and applies single global ASP |
| USD 26.03 billion (2024) | Industry Data Provider B | Excludes gasoline blending and uses a narrower country set |
The comparison shows that our disciplined scope selection, dual-path modeling, and yearly refresh create a transparent, repeatable baseline that decision makers can rely on.


Key Questions Answered in the Report
What is the projected growth rate for the toluene market between 2026 and 2031?
The market is expected to grow at 4.54% CAGR, taking volumes from 37.98 million tons in 2026 to 47.43 million tons by 2031.
Which region holds the largest toluene market share today?
Asia Pacific leads with 54.70% of global demand in 2025 and is also the fastest-growing region.
Why is TDI a critical growth driver within the toluene value chain?
TDI supports flexible polyurethane foam used in furniture, bedding, and automotive seats, giving it a forecast 5.37% CAGR through 2031.
How do tightening EU VOC rules impact toluene demand?
Stricter VOC caps under REACH push coatings and adhesive makers to lower-aromatic formulations, reducing regional toluene consumption.
Are bio-based routes realistic alternatives to petroleum-derived toluene?
Pilot studies show lignin-derived BTX can be cost-competitive once bio-oil yields exceed 15%, suggesting viable commercialization over the next decade.
Page last updated on:


