
Market Overview
| Study Period | 2020 - 2031 |
|---|---|
| Forecast Data Period | 2026 - 2031 |
| Base Year Market Size (2025) | 5.20 gigawatt |
| Market Volume (2026) | 5.55 gigawatt |
| Market Volume (2031) | 7.71 gigawatt |
| Growth Rate (2026 - 2031) | 6.78% CAGR |
| Market Concentration | Low |
Major Players *Disclaimer: Major Players sorted in no particular order Image © Mordor Intelligence. Reuse requires attribution under CC BY 4.0. | |
Thailand Solar Energy Market Analysis by Mordor Intelligence
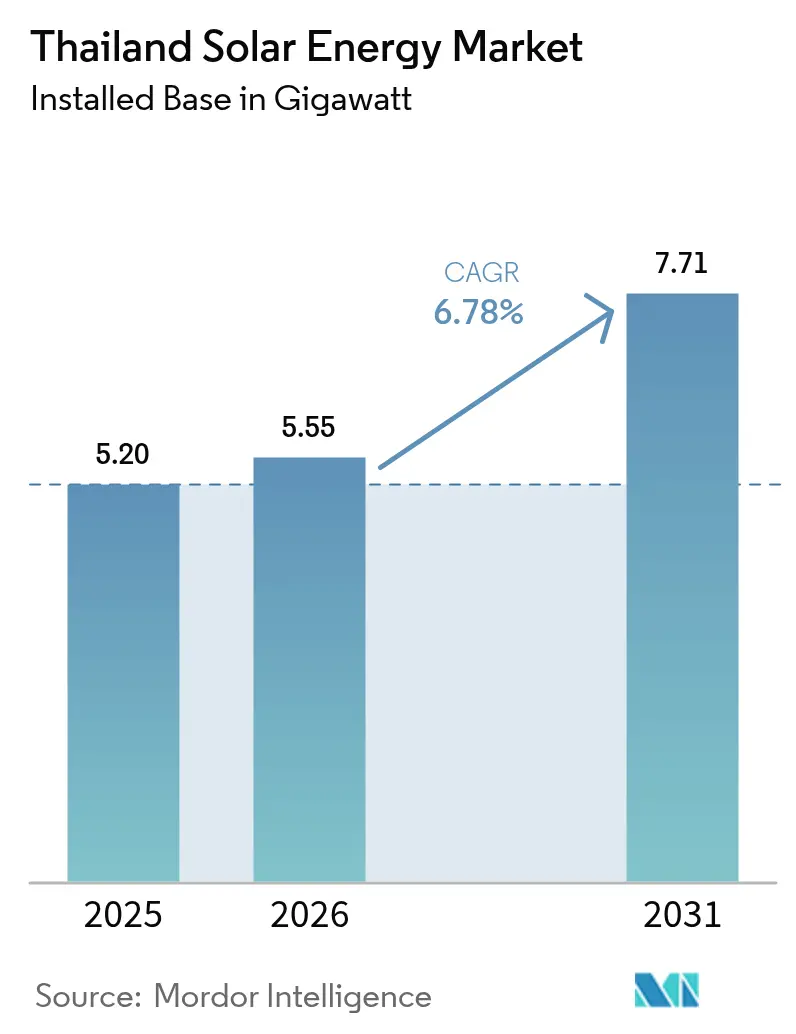
The Thailand Solar Energy Market size is expected to grow from 5.20 gigawatt in 2025 to 5.55 gigawatt in 2026 and is forecast to reach 7.71 gigawatt by 2031 at 6.78% CAGR over 2026-2031.
Continued tariff pressure, renewable energy policy targets, and declining photovoltaic costs position the Thai solar energy market for steady growth, despite grid infrastructure bottlenecks. A 2,000 MW direct power purchase pilot, approved in 2024, is opening an alternative procurement pathway for data centers and large manufacturers, which shortens sales cycles for independent power producers. Module prices that fell to USD 0.10–0.12 per watt in 2024 trimmed commercial payback periods to five to seven years, enhancing bankability across all customer classes. Floating-solar hybrid projects planned for nine hydroelectric reservoirs will add 2.7 GW of incremental capacity, circumventing land-acquisition hurdles that limit the use of ground-mounted sites. Solar leasing models and simplified licensing for systems below 1 MW are driving a residential installation boom in Bangkok and peri-urban provinces, signaling broader democratization of solar access.
Key Report Takeaways
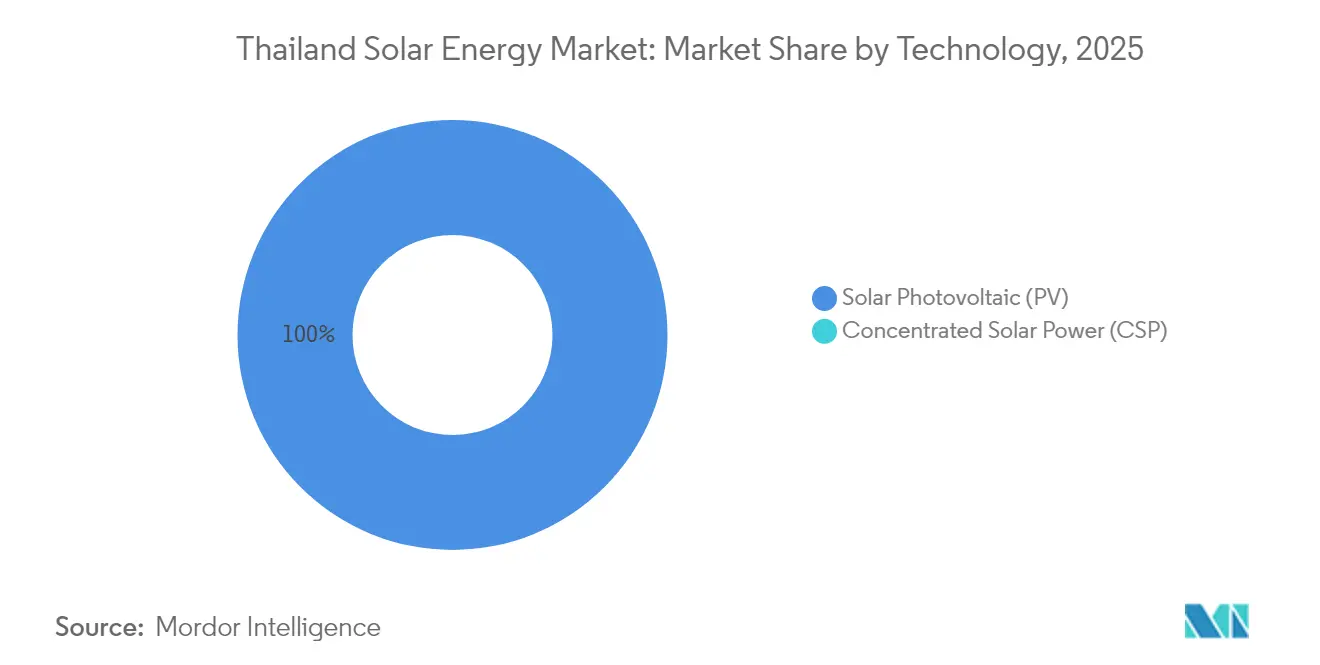
- By 2025, photovoltaic systems had captured 100.00% of the market share, while concentrated solar power remained commercially inactive.
- By grid type, on-grid systems held 90.12% of the Thailand solar energy market share in 2025, whereas the off-grid segment is forecast to post a 9.22% CAGR through 2031.
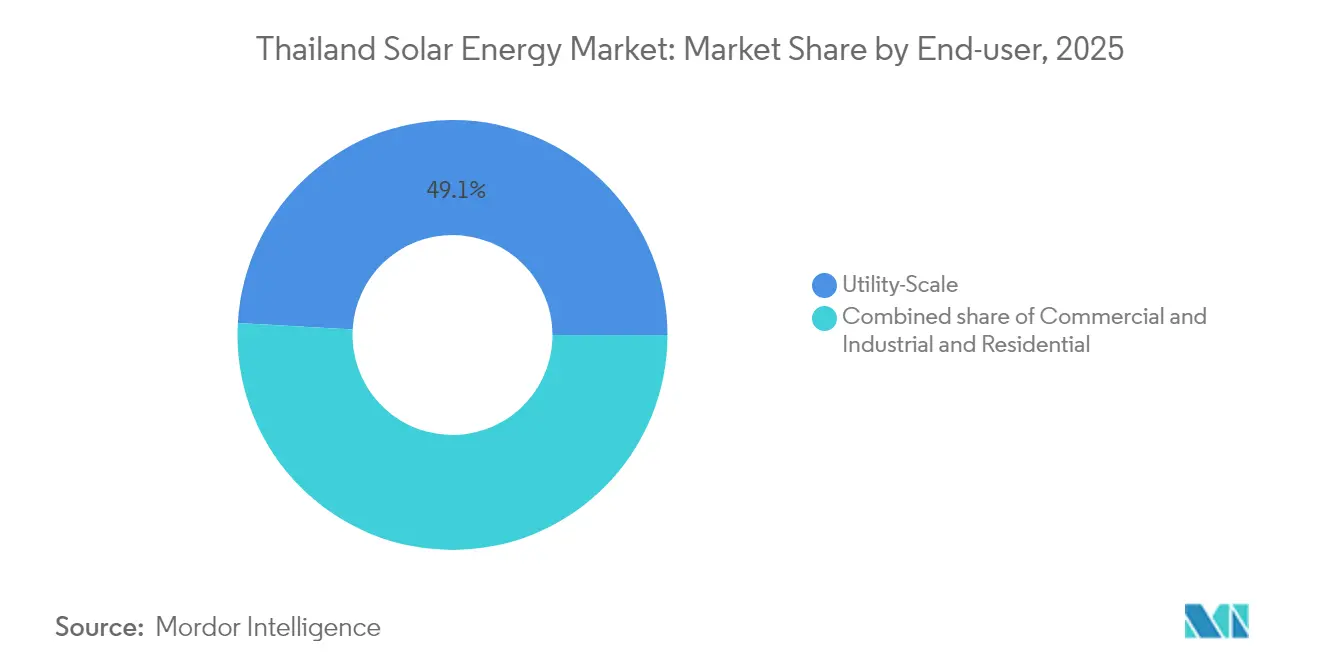
- By end-user, utility-scale assets accounted for 49.12% of the Thailand solar energy market size in 2025, yet residential rooftops are advancing at a 10.25% CAGR, the fastest pace among all categories.
Note: Market size and forecast figures in this report are generated using Mordor Intelligence’s proprietary estimation framework, updated with the latest available data and insights as of 2026.
Thailand Solar Energy Market Trends and Insights
Drivers Impact Analysis*
| Driver | (~) % Impact on CAGR Forecast | Geographic Relevance | Impact Timeline |
|---|---|---|---|
| Rising retail-grid tariffs and price swings | 1.80% | Industrial zones in Rayong, Chonburi, Samut Prakan | Medium term (2–4 years) |
| Rapid cost drop in bifacial and TOPCon PV | 1.50% | Nationwide, most visible in utility-scale bids | Short term (≤ 2 years) |
| Direct PPA pilot for commercial buyers | 1.30% | Bangkok Metropolitan Region and Eastern Economic Corridor | Medium term (2–4 years) |
| Government push for 2.7 GW floating hybrids | 0.90% | Central and Northern dam sites | Long term (≥ 4 years) |
| Agro-photovoltaic land-use programs | 0.60% | Northeastern farming provinces | Long term (≥ 4 years) |
| Growing demand for green RECs | 0.70% | Export-oriented factories in the Eastern Economic Corridor | Medium term (2–4 years) |
| Source: Mordor Intelligence | |||
Rising Retail-Grid Tariffs and Electricity-Price Volatility
Retail tariffs remained at THB 4.15–4.18 per kWh in 2024; however, the Electricity Generating Authority of Thailand reported cumulative losses of nearly THB 98 billion, suggesting an 8–12% tariff hike by late 2025 is likely. Manufacturers in the Eastern Economic Corridor now view rooftop solar as a hedge against gas price swings, as a typical 1 MW installation pays for itself within seven years. Data from the Energy Policy and Planning Office show that gas-fired units still supply about 60% of the grid's electricity, linking tariffs to spot LNG imports. Commercial buyers facing European Union carbon-border fees have accelerated solar procurement to protect export margins. The resulting demand is giving the Thai solar energy market fresh momentum across both on-site and third-party financed systems.
Rapid Cost Decline of Bifacial and TOPCon PV Modules
Average bifacial module prices declined to USD 0.10–0.12 per watt in 2024, while TOPCon cells achieved 24–25% efficiencies at only marginally higher costs. Developers now negotiate multi-year supply contracts, locking in component prices to 2027 and stabilizing levelized energy costs. Lower capital intensity has enabled smaller rooftops to achieve five-year paybacks even under net-billing. Oversupply in Chinese factories diverted products to Southeast Asia, further pushing down local prices. Although United States antidumping tariffs on Thai-assembled panels reshuffled export channels in 2024, domestic oversupply created broader price relief for local projects.
Direct PPA Pilot Opening Commercial and Industrial Demand
The Energy Regulatory Commission authorized a 2,000 MW direct-purchase pilot that allows data centers and factories to contract electricity from independent producers at prices 10–15% lower than grid retail rates. Draft third-party-access codes, due to be finalized by mid-2025, will codify wheeling charges and metering rules. Bangkok’s data-center cluster, which already consumes 150–200 MW, is expected to claim early allocations. Automotive suppliers in Rayong and electronics manufacturers in Samut Prakan have expressed interest, citing the ability to secure renewable energy for Scope 2 emission accounting. Direct PPAs therefore create a strong offtake pipeline that should accelerate the Thailand solar energy market.
Government Push for 2.7 GW Floating-Solar Hybrids
Sixteen floating-solar projects, totaling 2.7 GW, will be installed across nine hydro reservoirs, leveraging 12,000 hectares of water surface area managed. The 24 MW Ubolratana array commenced commercial operations in March 2024 and achieved a 5–8% higher energy yield, thanks to water cooling that keeps panel temperatures lower. The 205 MW Bhumibol Dam tender, which opened in March 2025, has attracted consortium bids pairing Thai developers with international EPC firms. Floating designs avoid land-acquisition disputes, while coupling with hydropower improves ramping flexibility in the national grid. A feed-in tariff of THB 2.8331 per kWh for solar-plus-battery hybrids underpins project economics.
Restraints Impact Analysis*
| Restraint | (~) % Impact on CAGR Forecast | Geographic Relevance | Impact Timeline |
|---|---|---|---|
| Long-cycle grid-connection approvals & curtailment risks | -0.8% | National, with acute bottlenecks in Bangkok Metropolitan Region and Eastern Economic Corridor | Medium term (2-4 years) |
| Saturated feeders in Bangkok & Eastern Economic Corridor | -0.6% | Bangkok, Samut Prakan, Chonburi, and Rayong provinces | Short term (≤ 2 years) |
| Rising import tariffs on Thai modules in US/EU markets | -0.5% | National impact on export-oriented manufacturers; indirect effect on domestic pricing and supply chain | Medium term (2-4 years) |
| Limited domestic Li-ion cell production for BESS | -0.4% | National, with concentrated impact on hybrid solar-plus-storage projects in utility-scale and C&I segments | Long term (≥ 4 years) |
| Source: Mordor Intelligence | |||
Long-Cycle Grid-Connection Approvals and Curtailment Risks
Developers report approval times of six to eighteen months because utilities must conduct voltage-stability studies and substation-capacity reviews before granting interconnection. Projects larger than 10 MW also require environmental impact assessments and National Energy Policy Council sign-offs, which extend pre-construction periods and increase holding costs. In 2024, curtailment events totaled up to fifty hours in feeders where solar penetration exceeded 18% of daytime demand. Absent real-time pricing or mandatory storage, over-generation causes forced shutdowns that undermine project revenue. These obstacles shave nearly one percentage point off forecast growth.
Saturated Feeders in Bangkok and Eastern Economic Corridor
Distribution circuits serving Bangkok’s business district and nearby industrial estates already run at 85–95% capacity during sunny midday periods. The Metropolitan Electricity Authority has planned THB 45 billion of substation upgrades, yet construction lags behind solar deployment. Developers often self-finance feeder reinforcements at USD 150,000–300,000 per MW, raising project capital requirements. Small and medium enterprises, therefore, face longer waits and higher costs than large corporates. Without accelerated grid investment, feeder saturation will continue to constrain rooftop installations in the densest load centers.
*Our forecasts treat driver/restraint impacts as directional, not additive. The impact forecasts reflect baseline growth, mix effects, and variable interactions.
Segment Analysis
By Technology Photovoltaic Dominance Continues
Photovoltaic systems accounted for 100.00% of the installed capacity in 2025 and are expected to expand at a 6.72% growth rate through 2031. The Thailand solar energy market size for photovoltaic technology reached 5.20 GW in 2025 and is expected to reach 7.71 GW by 2031, maintaining a significant share, as concentrated solar power remains economically impractical under Thailand’s humid climate. Bifacial modules that capture reflected irradiance are quickly becoming standard in floating-solar tenders, with the Ubolratana project registering 5-8% higher output than monofacial arrays. TOPCon cells, which offer 24-25% conversion efficiency, are overtaking PERC modules in utility-scale bids where land constraints justify premium pricing.
Continuous cost declines widen the economic gap between photovoltaic and concentrated solar power, which needs direct-normal-irradiance levels rarely achieved in the monsoon season. The Ministry of Energy’s 2024 feed-in-tariff schedule excludes concentrated solar power, effectively cementing photovoltaics’ monopoly. Looking forward, International Energy Agency data project module prices dropping another 15-20% by 2027, ensuring photovoltaic technologies remain the only commercially viable solar option in Thailand.



By Grid Type Off-Grid Uptake Accelerates
On-grid installations accounted for 90.12% of capacity in 2025, primarily driven by utility-scale farms and commercial rooftops located near Bangkok. The Thailand solar energy market share for off-grid systems is currently small, yet the off-grid segment is forecast to outpace the overall market at a 9.22% CAGR through 2031. Northern and Northeastern provinces lead the way in off-grid adoption, where rural electrification costs exceed USD 50,000 per kilometer. Agro-photovoltaic pilots, which pair solar panels with crop cultivation, add farm revenue while powering irrigation, improving debt service coverage, and shortening paybacks.
Net-billing, introduced in 2024, still compensates prosumers at wholesale rates that support paybacks of three to five years in high-tariff zones. The Metropolitan Electricity Authority reduced the approval time for sub-1 MW rooftops to thirty days, resulting in a 40% increase in applications last year. Off-grid systems also serve industrial estates facing curtailment risk or inadequate feeder capacity, underpinning the strongest near-term growth.
By End-User Residential Growth Leads
Utility-scale assets retained 49.12% of installed capacity in 2025, yet residential rooftops are forecast to post a 10.25% CAGR to 2031, the fastest expansion among all segments. The Thailand solar energy market size for residential installations stood at 76.9 MW in September 2025 and is growing rapidly, driven by zero-upfront-cost leasing contracts. Middle-income homeowners in Bangkok, Chiang Mai, and Phuket now qualify for third-party financed systems that promise bill savings from the very first day.
Commercial and industrial users occupy the middle ground. Data centers in Bangkok and Chonburi already consume 150-200 MW and are early adopters of solar-plus-battery PPA contracts. Automotive suppliers in Rayong and electronics plants in Samut Prakan line up for direct-PPA allocations that can cut power costs by up to 15%. Despite slower growth, utility-scale projects continue to anchor the sector through large floating-solar tenders and ground-mounted farms, which multilateral lenders finance.
Geography Analysis
Central Thailand, including the Bangkok Metropolitan Region, hosted approximately 34.62% of the installed capacity in 2025, thanks to its dense commercial and industrial loads. The Eastern Economic Corridor contributed another 27.85% and remains the primary destination for new rooftop and ground-mounted projects because export-oriented factories demand low-carbon power. Northern provinces, such as Chiang Mai and Lampang, have emerged as agro-photovoltaic hubs, where elevated arrays coexist with rice and vegetable crops, thereby reducing land-use conflicts.
Floating-solar hybrids slated for nine dam reservoirs across Central and Northern regions will redistribute capacity over the forecast horizon. The 205 MW Bhumibol Dam project in Tak and the 158 MW Srinakarin Dam array in Kanchanaburi will shift development inland, easing grid pressure on Bangkok. Saturated feeders in the capital currently operate at up to 95% during midday generation peaks and limit new rooftop interconnections until substation upgrades finish by 2028.
Northeastern provinces garner attention through agro-photovoltaic pilots that pair crop shading benefits with electricity sales. Kasetsart University trials in Nakhon Ratchasima have shown that elevated panels cut water demand and produce more than 1 MWh per rai annually. The Department of Alternative Energy Development and Efficiency is targeting up to 800 MW of such capacity by 2028, attracted by land costs that are three to four times lower than in Central Thailand. Southern resort provinces like Phuket also adopt rooftop solar on hotels, though monsoon clouds limit capacity factors to 14-16% compared with 18-20% in Central and Northeastern zones.
Regulatory Landscape
Thailand solar development is governed by the Energy Regulatory Commission (ERC) through licensing, grid-connection, and power-purchasing frameworks, alongside policy direction from the National Energy Policy Council (NEPC) and the Ministry of Energy. The regulatory toolkit has moved beyond utility procurement to include consumer-side programs, such as residential solar rooftop net-billing and related buyback arrangements, while the ERC also authorized a 2,000 MW direct power purchase pilot (approved in 2024) that enables eligible large consumers to contract renewable electricity from independent producers under defined wheeling and metering rules.
In 2026, policy actions focused on lowering soft costs and improving household economics. The ERC launched the 2026 residential solar buyback program on July 1, 2026, with a surplus buyback rate of THB 2.20/kWh under net-billing, and NEPC decisions referenced an expanded national quota for residential participation. In addition, reported tax and permitting simplifications, including the removal of the Ror.Ngor.4 (Factory 4) permit requirement for rooftop solar and a personal income tax deduction of up to THB 200,000 for qualifying rooftop installation costs (subject to scheme rules and timing), are intended to support distributed deployment while keeping net-billing as the core settlement mechanism rather than full net metering.
Competitive Landscape
Domestic developers SPCG, BCPG, Thai Solar Energy, B.Grimm Power, and Energy Absolute jointly control approximately 60% of the utility-scale capacity, resulting in a moderate level of concentration in the Thai solar energy market. These incumbents differentiate through vertical integration and regional diversification: Energy Absolute is building a 5 GWh battery plant, while BCPG invests in Japanese and Philippine assets to hedge domestic exposure. Utility-scale bids are increasingly favoring bifacial panels to boost energy yield on limited land, benefiting Chinese suppliers JinkoSolar, Trina Solar, and LONGi, which dominate component imports.
Huawei and Sungrow retain a combined 55–60% share of inverter sales by offering integrated energy management software that helps projects meet grid support requirements. The imposition of United States antidumping duties on Thai-assembled modules forced exporters to divert output toward domestic and ASEAN markets, intensifying price competition for local projects.[4]Electrical and Electronics Institute of Thailand, “Certified PV Modules List,” eei.or.th Compliance testing under IEC 61215 and IEC 61730 is conducted by the Electrical and Electronics Institute of Thailand, creating a baseline for quality assurance across the supply chain.
White-space opportunities lie in commercial and industrial rooftops, where the 2,000 MW direct-PPA pilot remains undersubscribed because many developers hesitate over regulatory timing. Residential leasing firms and agro-photovoltaic specialists are also emerging. Their novel business models lower financing barriers and expand addressable demand, challenging traditional utility-scale players to adapt.
Thailand Solar Energy Industry Leaders
Energy Absolute Public Company Limited
SPCG Public Company Limited
Thai Solar Energy PLC
BCPG Public Company Limited (BCPG)
B.Grimm Power PLC
- *Disclaimer: Major Players sorted in no particular order


Market Opportunities and Future Outlook
Near-term whitespace is concentrated in distributed solar and corporate procurement pathways where policy and financing are reducing friction. Residential adoption has clearer monetization under net-billing and the THB 2.20/kWh surplus buyback program launched in July 2026, supported by reported tax-deduction measures for qualifying rooftop systems and simplified permitting, including the removal of the Ror.Ngor.4 requirement. Together, these measures can support third-party leasing and installer scale-up in dense provinces. Commercial and industrial rooftops remain a large addressable segment as well, since the ERCs 2,000 MW direct PPA pilot creates an alternative offtake route for data centers and export-oriented manufacturers in the Eastern Economic Corridor, aligning with renewable energy claims and RECs demand.
Utility-scale opportunity continues to shift toward land-constrained formats and grid-supporting configurations. Floating-solar hybrid pipelines across hydro reservoirs can add developable capacity without competing for land, and the solar-plus-storage economics are reinforced by the THB 2.8331/kWh solar-plus-battery hybrid feed-in tariff cited in the market context. On the investment side, corporate project finance activity points to continued buildout for solar and hybrids, including Gulf Energy Developments February 2026 financing for a 939 MW renewable portfolio that includes solar and solar-plus-BESS projects, which also signals an execution runway for EPCs, inverter and storage suppliers, and O&M providers in Thailand.
Recent Industry Developments
- March 2026: BCPG Public Company Limited completed a 100% equity acquisition of Scan Advance Power Company Limited, adding 17.5 MW of solar rooftop capacity under a private PPA scheme. The deal strengthens BCPGs C&I rooftop position and expands contracted distributed generation capacity aligned with corporate offtake demand.
- December 2025: Energy Absolute Public Company Limited completed a partial business transfer of two solar power plant projects (Nakhon Sawan and Lampang, 90 MW each) to its wholly owned subsidiary, Ettulosba Energy 1 Company Limited. The restructuring supports asset ring-fencing and financing flexibility for operating solar portfolios.
- April 2024: Thai Solar Energy PLC invested in three solar power plants in Thailand with a combined contracted capacity of 8.0 MW under a feed-in tariff of THB 4.12 per unit. The transactions added operating capacity under long-term tariff support and underline continued appetite for small to mid-sized contracted solar assets.


Research Methodology Framework and Report Scope
Market Definition and Coverage
This market is defined as solar power capacity installed in Thailand, counted in gigawatts, covering grid-connected and off-grid solar used by utility, commercial, industrial, and residential users.
Scope exclusions: We do not count non-solar renewables, and CSP is only counted where it is commercially deployed in Thailand.
Segmentation Overview
- By Technology
- Solar Photovoltaic (PV)
- Concentrated Solar Power (CSP)
- By Grid Type
- On-Grid
- Off-Grid
- By End-User
- Utility-Scale
- Commercial and Industrial (C&I)
- Residential
- By Component (Qualitative Analysis)
- Solar Modules/Panels
- Inverters (String, Central, Micro)
- Mounting and Tracking Systems
- Balance-of-System and Electricals
- Energy Storage and Hybrid Integration
Data Sources, Market Sizing, and Validation
Desk Research
Desk research was used to build the first structure of the Thailand solar demand pool and to sanity check how fast capacity can realistically be added each year. We relied on public sources such as Thailand energy policy and planning releases, regulator and utility publications, IEA and IRENA renewable statistics, and World Bank macro indicators to align the timeline and the base-year context.
In parallel, project and company disclosures were reviewed through annual reports, investor decks, and official press releases, which helped us map pipelines, commissioning timing, and typical build sizes. Where available, we also referenced paid databases for company financials and intelligence, plus patent databases and a shipment-level import and export database to cross-check equipment flow signals. The desk sources listed here are illustrative, and other public and subscription sources were used across collection, validation, and follow-up clarification.
Primary Interviews and Surveys
Primary work focused on interviews and structured surveys with project developers, EPC and technical specialists, utility and C&I buyers, and other market participants who track pipeline maturity and commissioning risks. Since this is a Thailand-only study, questions were designed to confirm local permitting timelines, grid interconnection lead times, rooftop adoption pace, and how floating solar additions are being scheduled, and then those inputs were used to adjust secondary assumptions.
Distribution of primary research fieldwork respondents
| Company type | Respondent position | Region |
|---|---|---|
| Top tier: 33% | CXOs: 18% | |
| Mid tier: 45% | Functional/Unit leaders: 38% | |
| Smaller Players: 22% | Managers: 44% |
Market-Sizing & Forecasting
The core model starts from a top-down reconstruction of Thailand installed solar capacity using published capacity additions, project commissioning calendars, and grid connection status, and then it is reconciled to the total by end-user and grid type. To keep totals grounded, we used selective bottom-up checks, such as sampled project-size rollups, typical MW per site by application, and comparisons of equipment import signals versus expected build volumes.
Key inputs that shaped the sizing and forecast included annual new capacity additions, the on-grid versus off-grid mix, the share of utility-scale versus rooftop installations, project pipeline conversion rates, and observed commissioning delays linked to permitting and interconnection. For forecasting, scenario analysis was applied so the base case could be stress-tested against faster rooftop adoption or slower utility procurement, with expert feedback guiding which assumptions to keep conservative. When project disclosures were incomplete, missing capacity was handled through ranges anchored to comparable project classes, and then narrowed using primary confirmations.
Data Validation & Update Cycle
Outputs were checked in several ways before sign-off, including cross-checking totals against independent capacity indicators, reviewing year-to-year jumps for abnormal patterns, and re-running the model with alternate assumptions to see if the conclusion stayed stable. If large variances appeared by grid type or end-user, respondents were re-contacted and the desk evidence was revisited until the driver was explained.
The report is refreshed annually, and interim updates are triggered when material policy changes, major project awards, or commissioning shifts are observed. Before delivery, a final analyst pass is completed so the view reflects the latest public updates and confirmed market signals.
Mordor Intelligence's Thailand Solar Energy Market Estimate Compared With Other Published Estimates
Published market sizes for Thailand solar can look far apart because some studies size the market in installed capacity, while others report revenue value, and they may also treat storage, services, or policy-linked revenue differently. Timing also matters since capacity additions can shift across years due to permitting and grid interconnection schedules.
The table shows a clear unit mismatch across sources, and in Mordor Intelligence's model the market total is expressed as installed solar capacity in GW and is counted only for solar PV and CSP deployments within Thailand across on-grid and off-grid use. Other estimates may apply faster price escalation, include broader solar ecosystem revenue, or use a different base year cut-off, which moves the headline number even if the deployment story is broadly similar.
Benchmark comparison
| Source | Market Size | Gaps in Research Methodology |
|---|---|---|
| Mordor Intelligence | USD 5.20 B (2025) | |
| Industry Data Provider A | USD 3.32 B (2024) | This figure is value-based and anchored to a 2024 revenue pool, which can include equipment and service spend that does not map one-to-one to installed capacity in the same year. |
| Industry Data Provider B | USD 9.46 B (2032) | This is a longer-horizon value forecast with a higher growth curve, and it can reflect aggressive adoption and pricing assumptions that lift revenue even when capacity growth is steadier. |
Looking across the three numbers, the spread is mainly explained by whether the output is capacity in a defined deployment scope versus revenue that can widen into components and related spending. By tying inputs to commissioning timing, grid connection realities, and end-user mix, the capacity-based track stays easier to audit and to update when new projects move on the calendar.


Key Questions Answered in the Report
What capacity target does the Power Development Plan set for renewables in Thailand by 2037?
The plan calls for renewables to supply 51% of the national electricity mix by 2037, up from 20% in 2023.
How fast is the off-grid solar segment expected to grow through 2031?
Off-grid projects are projected to expand at a 9.22% CAGR, outpacing the overall market.
Why are floating-solar hybrids attractive for Thailand?
They utilize reservoir surfaces, avoid land-acquisition conflicts, and benefit from hydro coupling that reduces curtailment.
What is the main operational hurdle for new utility-scale projects near Bangkok?
Grid-connection approvals can take up to eighteen months because many feeders are already saturated.
How do direct PPAs benefit industrial buyers?
They allow factories and data centers to contract renewable power at prices 10-15% below retail tariffs while meeting emission-disclosure rules.
Which technology currently holds the entire market share in Thailand’s solar sector?
Photovoltaic technology accounts for 100.00% of installed capacity, with concentrated solar power absent due to unfavorable climate conditions.
Page last updated on:




