
Telecom Energy Optimization Software Market Size and Share
Market Overview
| Study Period | 2021 - 2032 |
|---|---|
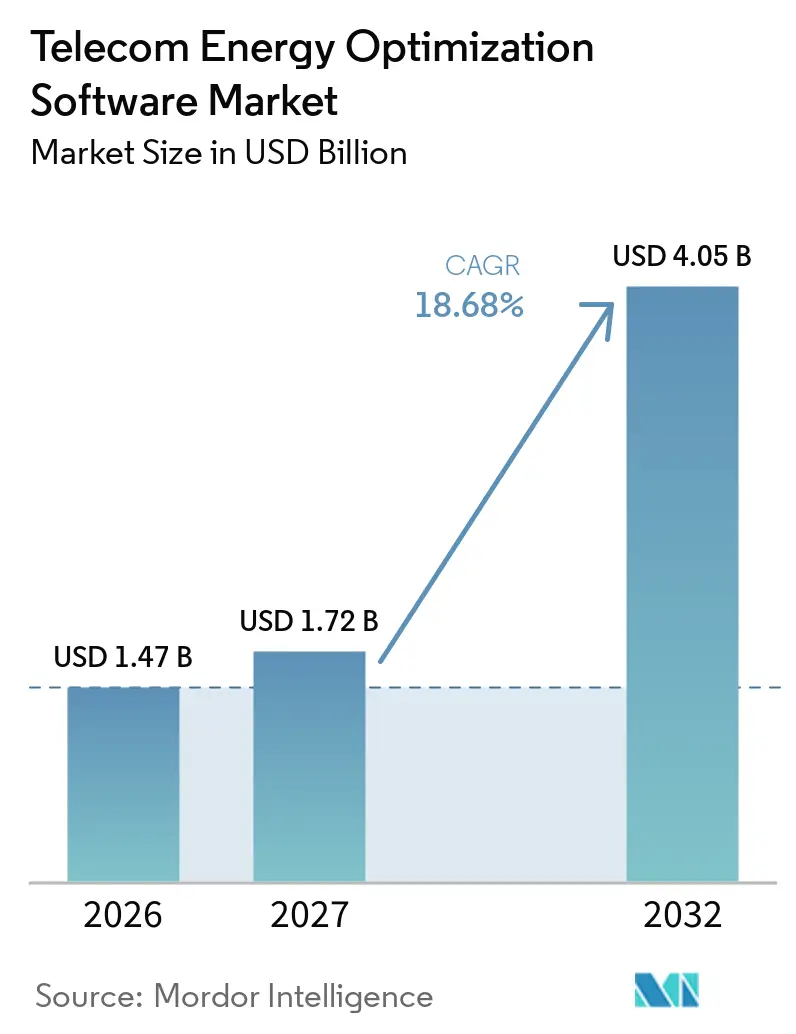
| Market Size (2027) | USD 1.72 Billion |
| Market Size (2032) | USD 4.05 Billion |
| Growth Rate (2027 - 2032) | 18.68 % |
| Fastest Growing Market | Asia-Pacific |
| Largest Market | Asia-Pacific |
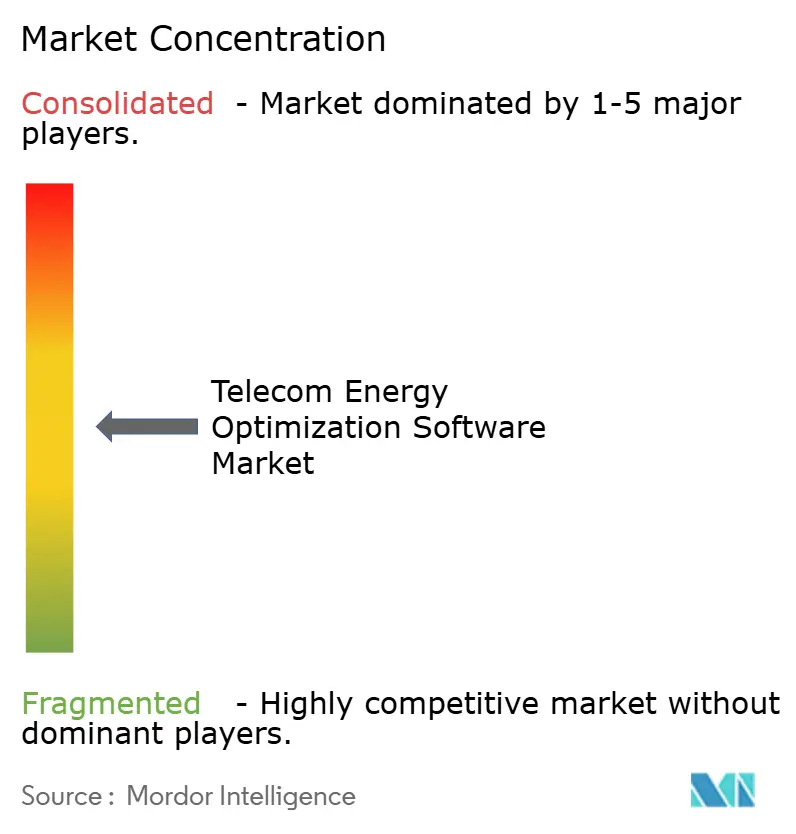
| Market Concentration | Medium |
Major Players *Disclaimer: Major Players sorted in no particular order Image © Mordor Intelligence. Reuse requires attribution under CC BY 4.0. | |
Telecom Energy Optimization Software Market Analysis by Mordor Intelligence
The Telecom Energy Optimization Software Market size is expected to increase from USD 1.47 billion in 2026 to USD 1.72 billion in 2027 and reach USD 4.05 billion by 2032, growing at a CAGR of 18.68% over the forecast period (2027-2032). The telecom energy optimization software market is advancing because denser 5G networks have made electricity a higher and more manageable operating cost for mobile operators. Network energy accounts for 15-30% of mobile operators' network operating expenditure, placing energy management alongside coverage, capacity, and service quality in financial planning. Mandatory carbon disclosures, real-time AI controls, and cloud delivery are reinforcing the case for software that can reduce consumption without requiring major site upgrades. The telecom energy optimization software market also benefits when operators move from isolated tools to platforms that manage radio access, core, and edge environments in a unified way. Infrastructure vendors retain an advantage through their relationships with installed RAN and operations support systems, while specialist providers have room to compete when operators use equipment from multiple vendors.
Key Report Takeaways
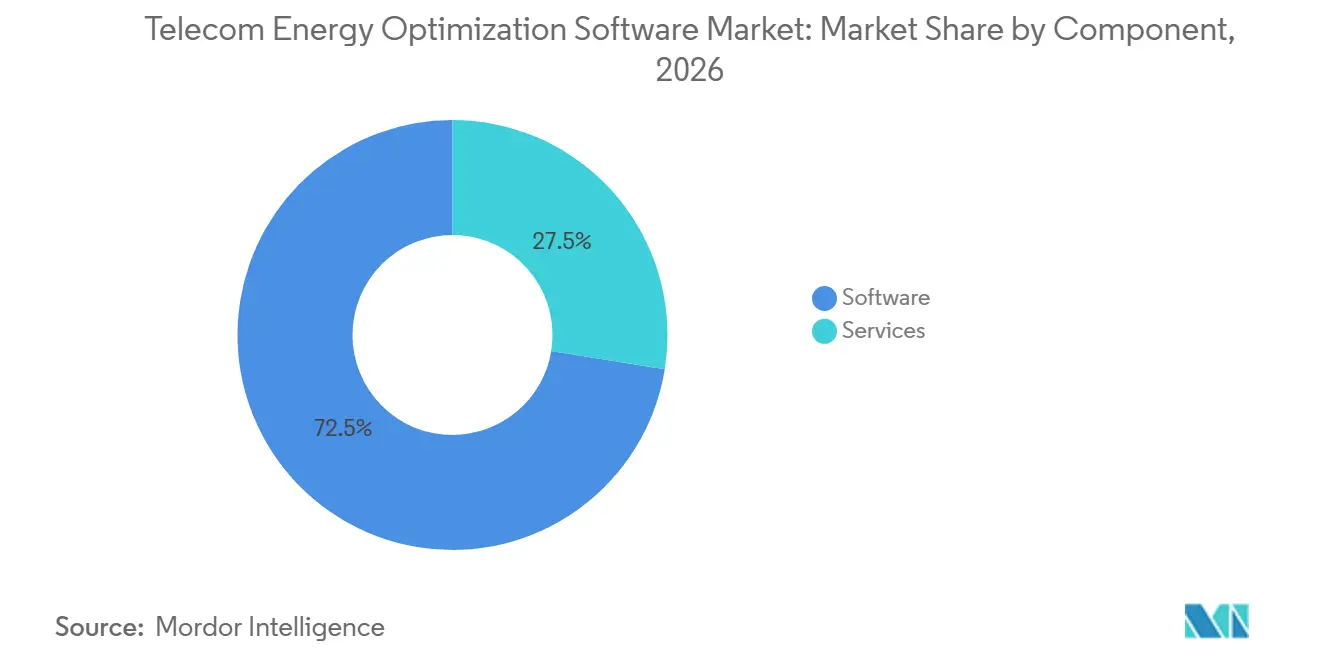
- By component, software held 72.46% of the telecom energy optimization software market in 2026, while services are projected to expand at a 20.14% CAGR through 2032.
- By network layer, radio access network deployments accounted for 48.35% of the telecom energy optimization software market in 2026, while telecom data centers and edge computing sites are projected to expand at a 20.32% CAGR through 2032.
- By deployment mode, cloud deployments held 44.62% of the telecom energy optimization software market in 2026, while hybrid deployments are projected to expand at a 20.06% CAGR through 2032.
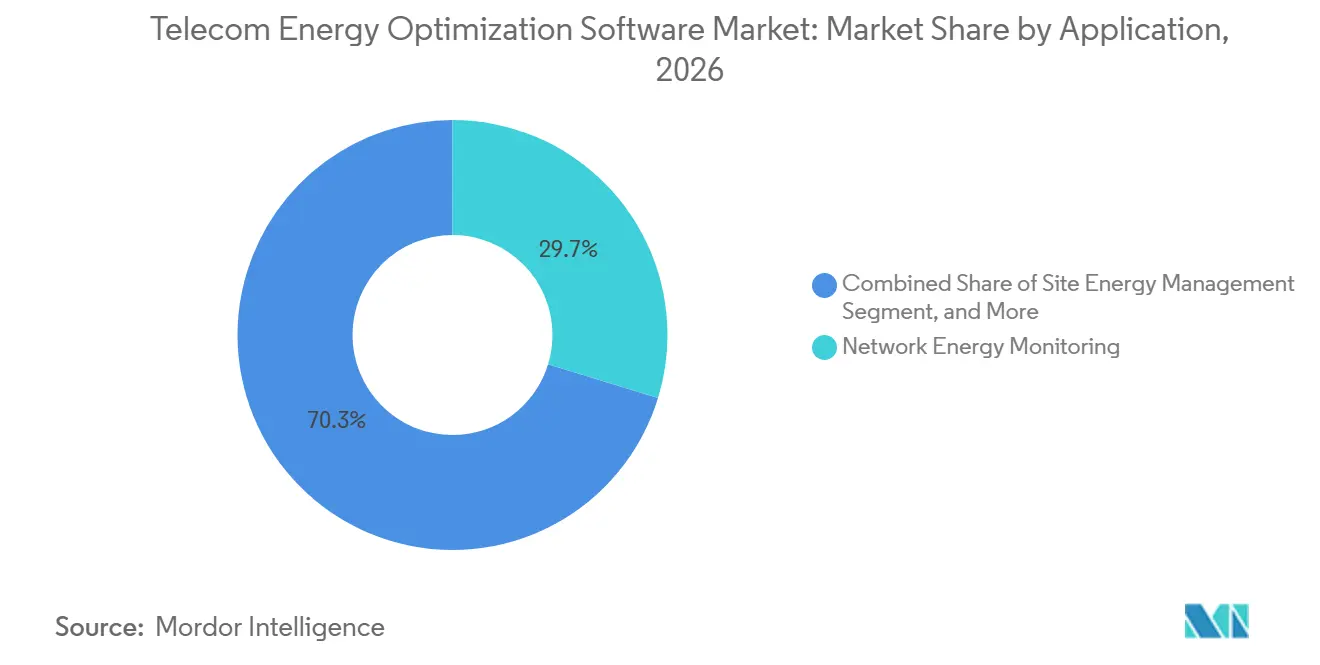
- By application, network energy monitoring accounted for 29.74% of the telecom energy optimization software market in 2026, while RAN sleep-mode orchestration is projected to expand at a 20.48% CAGR through 2032.
- By end-user, mobile network operators held 57.82% of the telecom energy optimization software market in 2026, while tower companies are projected to expand at a 20.21% CAGR through 2032.
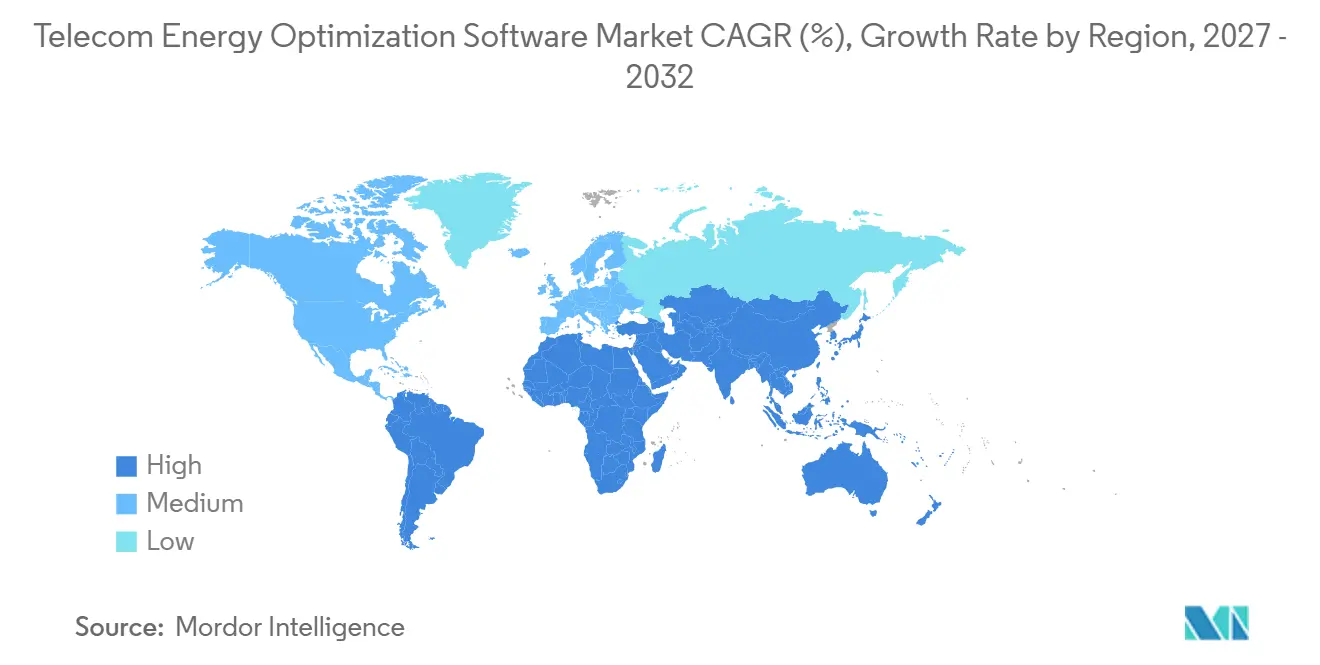
- By geography, Asia-Pacific held 35.46% of the telecom energy optimization software market revenue in 2026 and is projected to expand at a 20.12% CAGR through 2032.
Note: Market numbers in this report are based on Mordor Intelligence's proprietary estimation framework, which combines nine months of actuals with Q4 projections for base year 2026.
Global Telecom Energy Optimization Software Market Trends and Insights
Drivers Impact Analysis*
| Driver | (~) % Impact on CAGR Forecast | Geographic Relevance | Impact Timeline |
|---|---|---|---|
| Rising 5G RAN Energy Intensity | +5.1% | Global, concentrated in Asia-Pacific, Europe, and North America 5G-dense markets | Short term (≤ 2 years) |
| AI-Driven Closed-Loop Power Optimization | +4.5% | Global, with early scale in Europe and Asia-Pacific, growing in Middle East and Africa | Medium term (2-4 years) |
| Cloud SaaS Adoption in Multi-Vendor Network Operations | +2.9% | North America and Europe initially, expanding into Asia-Pacific and South America | Medium term (2-4 years) |
| Net-Zero Commitments and Energy-Disclosure Requirements | +2.1% | Europe and North America lead, Asia-Pacific and Middle East follow under national climate mandates | Long term (≥ 4 years) |
| Energy-Price Volatility and Telecom OPEX Pressure | +1.6% | Global, acutely felt in Europe and Africa, including diesel-dependent markets in Sub-Saharan Africa | Short term (≤ 2 years) |
| Grid-Aware Telecom Sites as Distributed Energy Assets | +0.8% | Europe, beginning in Nordic and Baltic markets, then Middle East and Asia-Pacific with grid reforms | Long term (≥ 4 years) |
| Source: Mordor Intelligence | |||
Rising 5G RAN Energy Intensity
A commercial-scale 5G rollout changes the energy demands of a mobile network because 5G radio equipment has a higher power draw than 4G equipment, and a macro radio unit at peak load consumes 1,090 watts.[1] Non-standalone deployments require operators to run the 4G and 5G layers simultaneously, while research shows that the median radio load remains below 40% even during peak periods. This means many base stations use near-maximum power for only part of their productive capacity. China illustrates the scale of this issue: its 5G rollout increased the base station count by more than 30-fold and extended coverage to more than 90% of the population. Chinese mobile operators nevertheless recorded their first year-over-year decline in operational emissions in 2024, while traffic nearly quadrupled from 2019 levels, supported by AI-assisted shutdown and sleep-mode programs. The telecom energy optimization software market, therefore, addresses a continuing network design issue rather than a short-lived transition cost.
AI-Driven Closed-Loop Power Optimization
Static radio schedules turn equipment off during predefined low-traffic periods, but AI systems can adjust decisions as traffic, weather, and grid conditions change. This approach can reduce the need for engineers to intervene in routine energy-control decisions, and Nokia reported that its AI-based methods achieve 2-5 times the savings of fixed scheduling and that MantaRay Energy can provide up to 15% additional savings without affecting network performance indicators. Vodafone UK and Ericsson reduced daily 5G radio unit power consumption by up to 33% in a March 2025 London trial. The trial combined 5G Deep Sleep, which can deliver up to 70% savings during low-traffic hours, with 4G Cell Sleep Mode Orchestration and a power-efficiency heatmap.[2] Continuous feedback also improves the underlying models over time, which distinguishes closed-loop systems from one-time hardware replacements. Federated deep reinforcement learning can coordinate decisions across autonomous networks while retaining data privacy at the individual-node level, making it relevant to multi-operator and roaming settings.
Cloud SaaS Adoption in Multi-Vendor Network Operations
Networks commonly use equipment from several suppliers, so an optimization platform needs to interpret data from different RAN systems, equipment managers, and power assets. A SaaS model shifts the task of maintaining those connectors from the operator to the provider. This can enable deployments within weeks rather than months and avoid large upfront capital expenditure. Nokia deployed its Energy Efficiency solution across Indosat Ooredoo Hutchison's nationwide RAN in Indonesia in July 2025 as a SaaS offering designed to reduce local maintenance needs.[3] ITU-T Recommendation L.1396 provides standardized interfaces for monitoring power consumption and environmental parameters, and cloud platforms can apply these interfaces consistently across diverse equipment estates while shared model training improves systems across a broader customer base.
Net-Zero Commitments and Energy-Disclosure Requirements
Sustainability targets are increasingly tied to Science Based Targets initiative validation and mandatory reporting obligations. By June 2026, 81 mobile operators had near-term science-based targets, representing 49% of global mobile connections and 69% of sector revenue. Fifty operators had also committed to net-zero targets, and 46 of those targets were validated by the Science Based Targets initiative. TELUS reached 100% renewable and low-emitting electricity by the end of 2025 and set targets for a 46% absolute reduction in operational emissions by 2030 and for a value chain net-zero by 2040.[4] Deutsche Telekom achieved net-zero across Scopes 1 and 2 in its operations by the end of 2025, after reducing emissions by more than 94% from its 2017 baseline. EU requirements and related frameworks in South Korea and Australia make detailed energy reporting a compliance matter. This positions the telecom energy optimization software market as a compliance-enabling tool for procurement teams.
Restraints Impact Analysis*
| Restraint | (~) % Impact on CAGR Forecast | Geographic Relevance | Impact Timeline |
|---|---|---|---|
| Legacy Telemetry and Metering Gaps | -1.9% | Global, most acute in Africa and South America, with significant gaps in brownfield Asia-Pacific networks | Short term (≤ 2 years) |
| OSS, RAN, Power-System, and Data-Model Integration Complexity | -1.4% | Global, most acute in multi-vendor markets in Europe and North America | Medium term (2-4 years) |
| Closed-Loop Automation Governance and Explainability Risk | -0.8% | Europe and North America, where regulatory bodies have heightened AI governance scrutiny | Long term (≥ 4 years) |
| Brownfield Retrofit Payback and Site-Access Constraints | -0.5% | Africa, South America, and rural markets globally with dispersed site portfolios | Medium term (2-4 years) |
| Source: Mordor Intelligence | |||
Legacy Telemetry and Metering Gaps
Software-based optimization depends on granular, reliable site telemetry, but much of the global network estate does not yet meet this requirement. In 2025, the NGMN Alliance found that current standards do not adequately cover energy metering in RAN transport networks. It also found that limited standardization restricts operators' ability to collect and combine energy data. Tower companies face additional difficulty when older remote monitoring systems from multiple suppliers deliver data in inconsistent formats and at varying intervals. Remote sites in Sub-Saharan Africa, rural South America, and parts of Southeast Asia can also experience low IP connectivity, delayed data, and dropouts that weaken AI model confidence and can make automated control unsafe. Open-source data-streaming tools can normalize some legacy data, but upgrades occur site by site, delaying the realization of savings.
OSS, RAN, Power-System, and Data-Model Integration Complexity
An energy optimization platform needs to work across operations support systems, multi-vendor RAN management, DC and AC power systems, and cloud-native network functions. Each layer can use different data models, APIs, and upgrade schedules. O-RAN Alliance Release 5, completed in November 2025, adopted 3GPP Release 18 energy-saving features and defined RIC-based AI and machine learning interfaces for energy rApps. Even so, interoperability between purpose-built and open RAN environments remains a practical constraint. Operators can have detailed generator and battery data without a common method for linking it to RAN traffic and radio-unit power draw at the sub-minute intervals needed for AI training. Tupl integrated more than 20 data sources across more than 60,000 Huawei and ZTE base stations, showing the potential of multi-vendor management and the engineering effort required, while longer projects can defer software-license revenue.
*Our forecasts treat driver/restraint impacts as directional, not additive. The impact forecasts reflect baseline growth, mix effects, and variable interactions.
Segment Analysis
By Component: Software Dominates, Services Gain Strategic Weight
Software held 72.46% of the telecom energy optimization software market revenue in 2026. This position reflects the platform model of AI-led energy management, where capabilities such as sleep-mode controls, grid interaction, and digital twin links can be delivered as updates. The software layer also combines monitoring, analytics, and orchestration into a single operating environment. That integrated approach favors vendors with broad platform coverage rather than providers that address a single isolated workflow. Regulatory requirements for auditable site-level reporting add to the need for platforms with traceable data lineage. Software, therefore, remains central as operators move from trial projects to repeatable, network-wide operating models. The telecom energy optimization software industry depends on this layer to turn raw telemetry into actions that can be measured, reviewed, and adjusted. Vendors also use the software layer to connect energy decisions with network performance requirements. This reduces the risk that power savings are pursued without considering service quality.
Services are projected to grow at a 20.14% CAGR from 2027 to 2032, outpacing the overall telecom energy optimization software market. Operators use these services for system integration, configuration, threshold calibration, managed operations, and change management. This demand reflects the practical work required to move an energy application from a pilot into live network operations. Services can deepen vendor relationships because delivery teams develop knowledge of network data, equipment settings, and local operating constraints. They can also support recurring revenue by extending contracts beyond initial software deployment. Implementation requires configuration, KPI-threshold calibration, and real-time monitoring orchestration. This work shows why services remain important even when the customer is buying a software-led solution. The balance between software and services is likely to remain important as operators standardize energy management across large estates. This supports the telecom energy optimization software market as deployments move from pilots to live operations.
By Network Layer: RAN Leads as Edge Sites Gather Pace
The radio access network accounted for 48.35% of the telecom energy optimization software market revenue in 2026. RAN is the principal energy-intensive layer in a mobile network and provides the most immediate setting for sleep-mode and power-control actions. RAN is where sleep-mode and power-control actions can have the most immediate operational effect. A French 5G study estimated that one urban base station consumes an average of 2,456 watt-hours. These conditions make function-level metering and responsive control more useful than broad site-level averages. Transport, core, cloud-native functions, and fixed access networks each exhibit distinct energy patterns and require different optimization approaches. Software controls can also have material value outside radio sites, where different network functions require their own approach to managing demand.
Telecom data centers and edge computing sites are projected to expand at a 20.32% CAGR from 2027 to 2032. Edge workloads create a separate energy-management need because AI inference and data processing can introduce load patterns that standard capacity-planning tools were not designed to handle. Operators increasingly need software that manages radio, core, and edge locations as interconnected parts of a single system. Broadcom announced VMware Telco Cloud Platform 9 in March 2026 with a target of reducing server power consumption by 25-30% through greater VM density. ITU-T L.1307 provides a measurement basis for energy efficiency in edge micro data centers. The standard supports more comparable reporting as edge deployments expand. The telecom energy optimization software market can benefit when operators need consistent controls across increasingly distributed computing locations. The fast pace of this segment also reflects the shift toward on-device and edge inference under sovereign AI rules. This expands the addressable market for telecom energy optimization software. Energy management at the edge is consequently becoming a distinct workflow rather than an extension of conventional RAN optimization.
By Deployment Mode: Cloud Leads, Hybrid Addresses Brownfield Complexity
Cloud deployments held 44.62% of the telecom energy optimization software market revenue in 2026. Operators use cloud delivery to avoid the capital expenditure and internal IT burden of maintaining on-premises applications. Cloud environments can also make updates, scaling, and multi-vendor integration easier to manage. A provider serving multiple operators can train AI models on aggregated, anonymized traffic and energy data. That shared learning can improve models more quickly than a single operator's standalone deployment. Cloud platforms are particularly well-suited to the standardized monitoring interfaces specified in ITU-T Recommendation L.1396. They can apply comparable power, cooling, and environmental data structures across equipment estates. The telecom energy optimization software market is therefore supported by operators that prefer flexible subscription models to individual site software releases. Cloud delivery also gives suppliers a clearer way to maintain connections as network equipment and APIs change.
On-premises deployments remain relevant where data sovereignty rules, national security concerns, or very low-latency requirements limit the use of centralized cloud control. Hybrid deployments are projected to expand at a 20.06% CAGR from 2027 to 2032. Operators with large brownfield estates use this model to host analytics and planning in the cloud while keeping sensitive or time-critical control loops closer to the network. A hybrid structure allows operators to retain real-time control while using cloud resources for analytics and model training. Hybrid use can reduce the operational disruption that would arise from replacing older on-premises systems all at once. It also offers a practical route for operators that need to verify control decisions before expanding automation.
By Application: Monitoring Anchors the Market, Sleep-Mode Orchestration Accelerates
Network energy monitoring accounted for 29.74% of the telecom energy optimization software market revenue in 2026. Monitoring is the entry point for many deployments, as operators need reliable data before they can automate optimization. ITU-T Recommendation L.1396, issued in October 2025, defines a common monitoring and control interface for power, cooling, and building-environment systems in telecommunications networks. The recommendation supports the consistent collection of data that is needed for compliance-grade reporting. Site energy management, carrier and cell shutdown, and traffic and capacity optimization build on this basic visibility. Network traffic and capacity optimization are particularly useful in telecom data centers, where AI workloads can create load spikes unlike those from conventional user traffic. Monitoring also helps operators identify unreliable meters, incomplete data feeds, and local constraints before they allow automated actions to proceed. This role keeps it important even as more advanced applications become available.
RAN sleep-mode orchestration is projected to expand at a 20.48% CAGR from 2027 to 2032. The application can adjust cell or carrier states in response to actual demand rather than relying on fixed time schedules. AI-led control logic can deliver better outcomes than fixed rules on the same hardware. O-RAN Alliance Release 5 supports rApp-based energy controls across compliant multi-vendor RAN environments. This can broaden the use of sleep-mode applications beyond networks that rely on a single equipment provider. The telecom energy optimization software industry is moving toward more automated controls, but operators still need governance processes that explain why each action was taken. That requirement makes monitoring, audit trails, and human oversight relevant to deploying sleep-mode tools.

By End-User: MNOs Lead, Tower Companies Redefine the Value Proposition
Mobile network operators accounted for 57.82% of the telecom energy optimization software market revenue in 2026. They operate much of the RAN infrastructure and are directly exposed to rising electricity costs. Fixed network operators, integrated communications service providers, and wholesale operators have different optimization needs across passive optical networks, data centers, wireless sites, and shared infrastructure. MNOs often begin with RAN energy controls because those sites combine high power use with operational data that supports automation. Their adoption also shapes the platforms available to smaller and more specialized operators. The focus on live network quality means vendors must balance savings against coverage and performance objectives. This makes embedded network knowledge and access to equipment telemetry valuable competitive advantages. The telecom energy optimization software market benefits when MNOs scale proven controls across national radio estates. Their deployments can also generate data that supports the wider development of vendor models and services.
Tower companies are projected to expand at a 20.21% CAGR from 2027 to 2032. Their opportunity is linked to a shift from energy pass-through billing to direct energy procurement, which exposes their margins to electricity costs. Multi-tenant portfolios also create a need to allocate energy use accurately and manage shared site assets. In June 2025, DNA Tower Finland became the first tower company to offer base-station battery capacity in an electricity reserve market using Elisa Industriq's AI-based Distributed Energy Storage solution. This model uses distributed batteries to manage consumption and support grid-balancing services. Helios Towers invested USD 11 million in energy-efficiency initiatives in 2025, including grid integration, solar power, and remote monitoring systems. These investments show that tower companies are treating energy management as an ongoing operating platform instead of a one-time capital project. Their expansion broadens demand beyond traditional network operators and creates an additional route to value from site energy assets.
Geography Analysis
Asia-Pacific accounted for 35.46% of the telecom energy optimization software market share in 2026 and is projected to expand at a 20.12% CAGR through 2032. The region combines very large-scale 5G deployments with broad opportunities to update energy management across both newer and older networks. China is the largest single setting for these applications because 5G deployment increased the number of base stations more than 30-fold, reached more than 90% of the population, and China Mobile and Huawei implemented AI-led green 5G measures across all 31 regional subsidiaries. India is a fast-moving opportunity as Jio and Bharti Airtel roll out 5G to sites built around 4G traffic patterns. South Korea, Japan, Australia, New Zealand, and Indonesia support advanced adoption that links edge-computing energy management with RAN optimization, including Indosat Ooredoo Hutchison's use of Nokia's multi-vendor SaaS platform.
Europe has adopted the software through regulatory requirements, renewable-energy mandates, and early operator commitments. Energy optimization is treated as both a cost-management tool and a means of producing detailed compliance records, with Deutsche Telekom, Telefónica, Telia, and Vodafone helping to establish this procurement environment. Tupl's AI energy solution went live across 8-10 European countries with Deutsche Telekom in April 2025, demonstrating that dynamic sleep-mode adjustment can operate across multi-vendor networks. North America is more strongly shaped by operating-cost pressure and the need to manage energy use as traffic expands. TELUS combines energy-management software with renewable-energy procurement to enable more responsive, carbon-aware operations after meeting its 100% renewable and low-emitting electricity target.
The Middle East is adopting optimization platforms through national digital transformation programs and sustainability targets, especially in Saudi Arabia and the UAE. Grid-aware site management and solar integration are relevant where policy priorities align with commercial energy concerns. African markets have a strong need for optimization but face complex conditions, including limited grid availability and diesel dependence. Helios reported an average grid availability of 18 hours per day across its African markets. Its USD 11 million 2025 investment included advanced batteries and remote monitoring, and reduced Scope 1 and Scope 2 emissions per tenant by 10% against the baseline year. South America is an emerging opportunity, supported by Brazil's large operator base and Argentina's 5G auction activity, although older infrastructure can slow the move from monitoring to automated control.
Competitive Landscape
The telecom energy optimization software market is moderately concentrated at the platform level, and Ericsson, Nokia, Huawei, and ZTE benefit from installed RAN and operations support systems that provide direct access to base-station telemetry. These suppliers embed energy applications within wider autonomous-network and operations platforms, which can make replacement difficult in single-vendor estates. Multi-vendor production environments still create a role for vendor-neutral specialists who can combine data from several systems. Tupl's work across more than 20 data sources and 60,000-plus Huawei and ZTE base stations illustrates the integration challenge that supports this specialist role. This split between embedded platform suppliers and independent integrators makes interoperability a central purchasing criterion.
In March 2026, Ericsson and Nokia announced a multi-vendor autonomous-networks collaboration, with Nokia joining Ericsson's rApp Ecosystem and Ericsson joining Nokia's SMO Marketplace. The arrangement enables automation applications across purpose-built, cloud RAN, and Open RAN networks and opens a route for energy-optimization rApps to serve mixed equipment estates. O-RAN Alliance Release 5 provides the standards foundation for third-party energy applications across compliant RAN environments by adopting 3GPP Release 18 energy-saving features and specifying interfaces for AI and machine-learning rApps. The developing rApp ecosystem can therefore extend competition beyond the established equipment supply chain.
Data scale and grid integration are becoming important sources of differentiation. Vendors that collect telemetry across large portfolios can improve AI models faster, and SaaS delivery lets suppliers apply those improvements across customers. Elisa Industriq's Distributed Energy Storage solution supports DNA Tower Finland's participation in the Nordic electricity reserve market, demonstrating that grid-aware controls can create revenue opportunities while reducing power use. Patent activity in AI sleep-mode orchestration and energy-price-aware scheduling also indicates competition around autonomous control, while ETSI ES 203 228 V1.5.1 sets assessment methods that suppliers can use to meet governance requirements. These requirements reinforce demand across the telecom energy optimization software market.
Telecom Energy Optimization Software Industry Leaders
-
Huawei Technologies Co., Ltd.
-
Nokia Corporation
-
Telefonaktiebolaget LM Ericsson
-
Cisco Systems, Inc.
-
Schneider Electric SE
- *Disclaimer: Major Players sorted in no particular order
Recent Industry Developments
- July 2026: Accruent and PowerX announced a strategic partnership connecting PowerX's AI-driven energy intelligence platform with Accruent's Siterra site-management software for tower companies with distributed site portfolios. The integration enables AI-identified anomalies and energy inefficiencies to be incorporated into operational workflows, reducing manual intervention in energy management processes.
- May 2026: Rakuten Mobile and KDDI were jointly selected by Japan's New Energy and Industrial Technology Development Organization for a research and development project aimed at achieving a 40% reduction in data-center and virtualized RAN power consumption by 2030. The collaboration focuses on simultaneous optimization of virtualized base stations and computing infrastructure under Japan's post-5G infrastructure development program.
- March 2026: Ericsson and Nokia announced a strategic collaboration to accelerate autonomous network development and multi-vendor interoperability across purpose-built RAN, cloud RAN, and Open RAN architectures. The agreement enables Ericsson to participate in Nokia's SMO Marketplace and Nokia to join Ericsson's rApp Ecosystem, supporting greater compatibility between network automation applications through standardized R1 interfaces. The collaboration establishes a framework for telecommunications operators to deploy intelligent optimization applications across multi-vendor environments, potentially supporting automated energy management, network performance optimization, and more efficient infrastructure operations.
- March 2026: Huawei launched its New-Generation AI-Powered Green Site and GW-level AI Data Center solutions at MWC Barcelona 2026. The AI-Powered Green Site integrates weather forecasting, energy storage scheduling, and virtual power plant capabilities, with Northern European deployments showing annual revenue increases of more than EUR 2,000 (USD 2,213) per site through grid-balancing participation.
Global Telecom Energy Optimization Software Market Report Scope
The Telecom Energy Optimization Software Market Report is Segmented by Component (Software and Services), Network Layer (Radio Access Network, Transport Network, Core Network and Cloud-Native Network Functions, Telecom Data Centers and Edge Computing Sites, and Fixed Access Networks), Deployment Mode (Cloud, On-Premises, and Hybrid), Application (Network Energy Monitoring, Site Energy Management, RAN Sleep-Mode Orchestration, Carrier and Cell Shutdown Optimization, Network Traffic and Capacity Optimization, and Other Applications), End-User (Mobile Network Operators, Fixed Network Operators, Integrated Communications Service Providers, Tower Companies, Wholesale Network Operators, and Other End-Users), and Geography (North America, South America, Europe, Asia-Pacific, Middle East, and Africa). The Market Forecasts are Provided in Terms of Value (USD).
| Software |
| Services |
| Radio Access Network |
| Transport Network |
| Core Network and Cloud-Native Network Functions |
| Telecom Data Centers and Edge Computing Sites |
| Fixed Access Networks |
| Cloud |
| On-Premises |
| Hybrid |
| Network Energy Monitoring |
| Site Energy Management |
| RAN Sleep-Mode Orchestration |
| Carrier and Cell Shutdown Optimization |
| Network Traffic and Capacity Optimization |
| Other Applications |
| Mobile Network Operators |
| Fixed Network Operators |
| Integrated Communications Service Providers |
| Tower Companies |
| Wholesale Network Operators |
| Other End-Users |
| North America | United States |
| Canada | |
| Mexico | |
| South America | Brazil |
| Argentina | |
| Rest of South America | |
| Europe | Germany |
| United Kingdom | |
| France | |
| Spain | |
| Italy | |
| Russia | |
| Rest of Europe | |
| Asia-Pacific | China |
| Japan | |
| India | |
| South Korea | |
| Australia and New Zealand | |
| Rest of Asia-Pacific | |
| Middle East | Saudi Arabia |
| United Arab Emirates | |
| Rest of Middle East | |
| Africa | South Africa |
| Nigeria | |
| Rest of Africa |
| By Component | Software | |
| Services | ||
| By Network Layer | Radio Access Network | |
| Transport Network | ||
| Core Network and Cloud-Native Network Functions | ||
| Telecom Data Centers and Edge Computing Sites | ||
| Fixed Access Networks | ||
| By Deployment Mode | Cloud | |
| On-Premises | ||
| Hybrid | ||
| By Application | Network Energy Monitoring | |
| Site Energy Management | ||
| RAN Sleep-Mode Orchestration | ||
| Carrier and Cell Shutdown Optimization | ||
| Network Traffic and Capacity Optimization | ||
| Other Applications | ||
| By End-User | Mobile Network Operators | |
| Fixed Network Operators | ||
| Integrated Communications Service Providers | ||
| Tower Companies | ||
| Wholesale Network Operators | ||
| Other End-Users | ||
| By Geography | North America | United States |
| Canada | ||
| Mexico | ||
| South America | Brazil | |
| Argentina | ||
| Rest of South America | ||
| Europe | Germany | |
| United Kingdom | ||
| France | ||
| Spain | ||
| Italy | ||
| Russia | ||
| Rest of Europe | ||
| Asia-Pacific | China | |
| Japan | ||
| India | ||
| South Korea | ||
| Australia and New Zealand | ||
| Rest of Asia-Pacific | ||
| Middle East | Saudi Arabia | |
| United Arab Emirates | ||
| Rest of Middle East | ||
| Africa | South Africa | |
| Nigeria | ||
| Rest of Africa | ||
Key Questions Answered in the Report
What is the telecom energy optimization software market size?
The telecom energy optimization software market size is USD 1.47 billion in 2026 and is projected to reach USD 4.05 billion by 2032 at an 18.68% CAGR.
Why are telecom operators adopting energy optimization software?
Operators use these platforms to manage the rising power requirements of dense 5G networks, strengthen cost control, and support detailed energy reporting.
Which component leads telecom energy optimization software spending?
Software held 72.46% of revenue in 2026 because it provides monitoring, analytics, and orchestration capabilities in an integrated platform.
Which deployment model is gaining traction among network operators?
Cloud held 44.62% of revenue in 2026, while hybrid deployment is projected to expand at a 20.06% CAGR through 2032.
What application is expanding the fastest in telecom energy optimization?
RAN sleep-mode orchestration is projected to expand at a 20.48% CAGR through 2032 because AI can adjust cell power states to real-time traffic conditions.
Why are tower companies using energy optimization platforms?
Tower companies are taking on more direct electricity-cost exposure and can use distributed batteries for both site optimization and grid-balancing services.