
Telecom Energy-as-a-Service Market Size and Share
Market Overview
| Study Period | 2021 - 2032 |
|---|---|
| Market Size (2027) | USD 6.43 Billion |
| Market Size (2032) | USD 11.83 Billion |
| Growth Rate (2027 - 2032) | 12.97 % |
| Fastest Growing Market | Asia-Pacific |
| Largest Market | Asia-Pacific |
| Market Concentration | Medium |
Major Players *Disclaimer: Major Players sorted in no particular order Image © Mordor Intelligence. Reuse requires attribution under CC BY 4.0. | |
Telecom Energy-as-a-Service Market Analysis by Mordor Intelligence
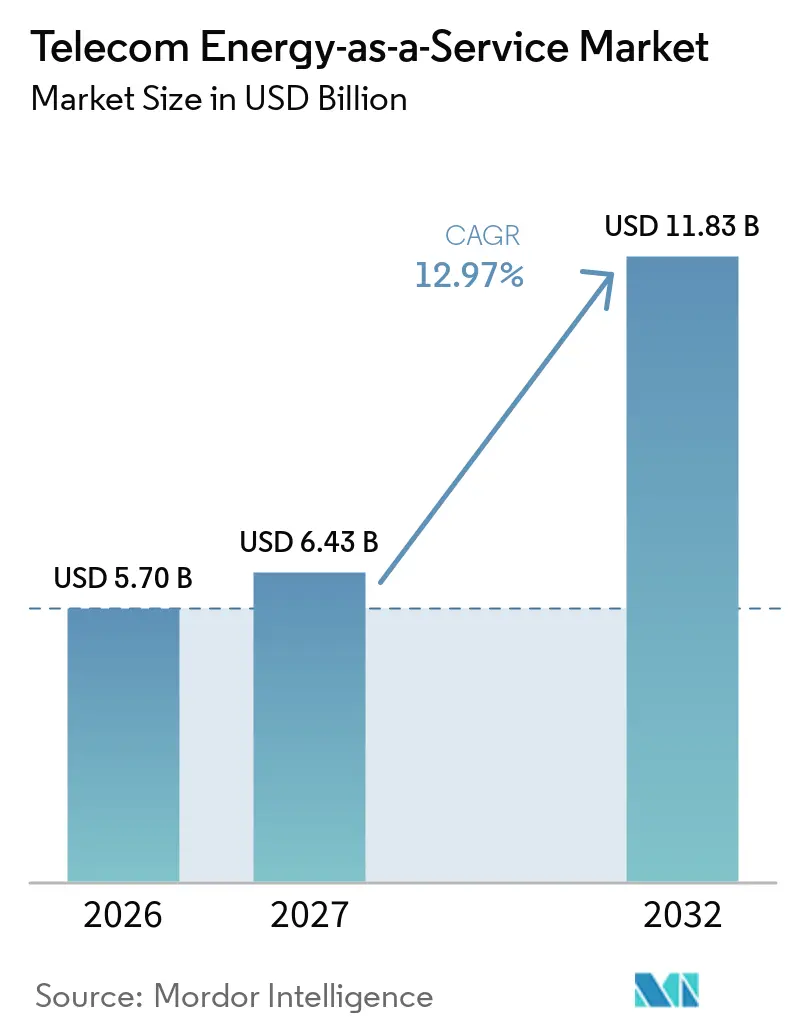
The Telecom Energy-as-a-Service Market size is expected to increase from USD 5.70 billion in 2026 to USD 6.44 billion in 2027 and reach USD 11.83 billion by 2032, expanding at a CAGR of 12.97% over 2027-2032. The Telecom Energy-as-a-Service Market is being shaped by the energy load from 5G network expansion and by operators seeking more predictable site energy costs. Base stations account for a large share of network energy demand, which makes reliable power supply and management a central operating concern. Third-party contracts can shift fuel, equipment refresh, and energy-management responsibilities away from mobile operators. Renewable procurement, battery storage, and software-led optimization are becoming increasingly interconnected within the Telecom Energy-as-a-Service Market. Contract terms, energy-price exposure, and the quality of site-level measurement remain important factors in determining whether projects can be financed and scaled.
Key Report Takeaways
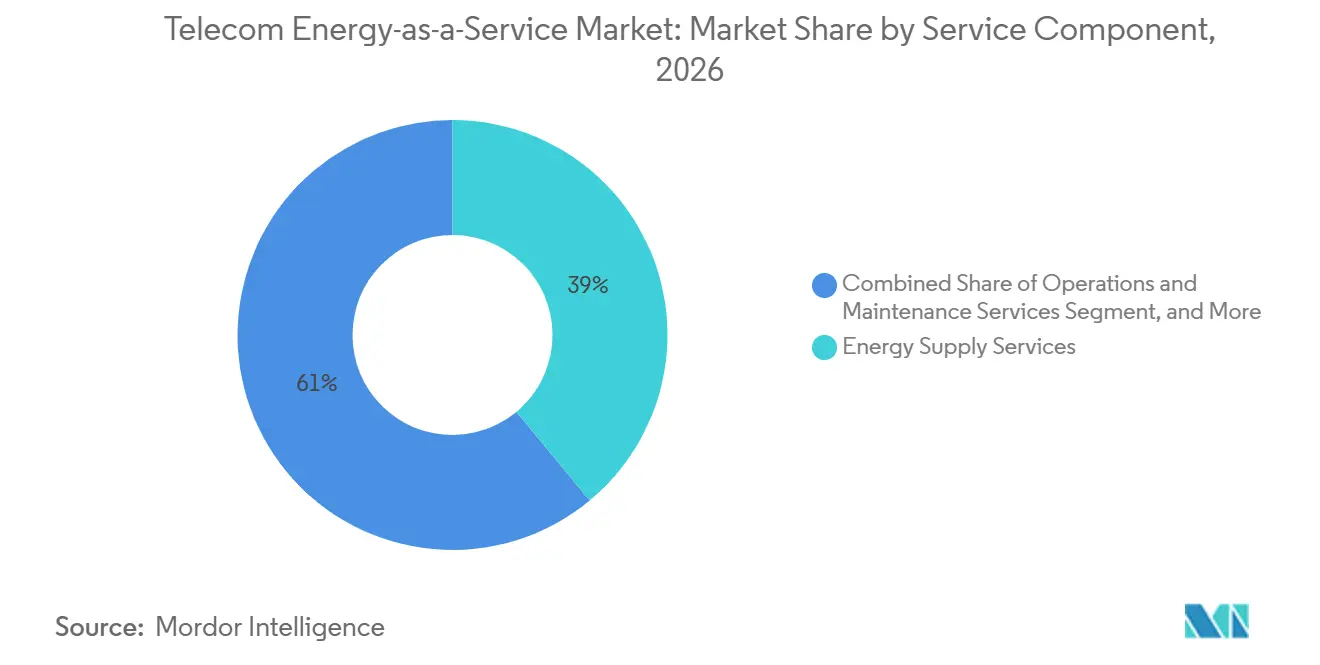
- By service component, Energy Supply Services held 38.97% of the Telecom Energy-as-a-Service Market share in 2026, while Energy Optimization and Efficiency Services are projected to expand at a 13.45% CAGR through 2032.
- By power source, Grid Power accounted for 30.14% of the market in 2026, while Solar Photovoltaic is projected to expand at a 13.78% CAGR through 2032.
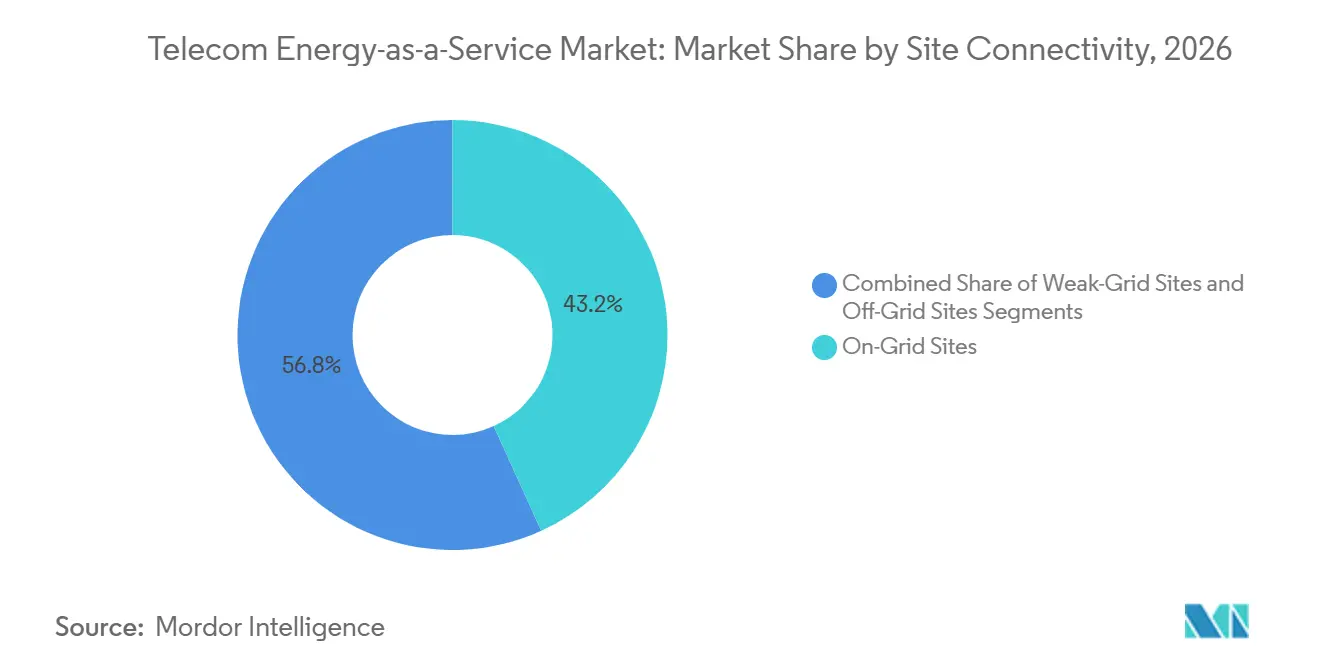
- By site connectivity, On-Grid Sites held 43.22% of the market in 2026, while Weak-Grid Sites are projected to expand at a 14.11% CAGR through 2032.
- By geography, Asia-Pacific accounted for 27.65% of the market in 2026 and is projected to expand at a 14.23% CAGR through 2032.
Note: Market numbers in this report are based on Mordor Intelligence's proprietary estimation framework, which combines nine months of actuals with Q4 projections for base year 2026.
Market Trends and Insights
Drivers Impact Analysis of Telecom Energy-as-a-Service Market*
| DRIVER | (~) % IMPACT ON CAGR FORECAST | GEOGRAPHIC RELEVANCE | IMPACT TIMELINE | |
|---|---|---|---|---|
| 5G Network Densification and Rising Site Power Demand | +3.50% | Global, with highest intensity in Asia-Pacific and Sub-Saharan Africa | Medium term (2-4 years) | |
| Telecom Operator Shift From Capex Ownership to Predictable Opex | +3.00% | Global, with early gains in India, Nigeria, Indonesia, and Southeast Asia | Medium term (2-4 years) | |
| Diesel Displacement and Renewable-Energy Mandates | +2.50% | Africa, South Asia, Southeast Asia, with spill-over to Middle East | Medium term (2-4 years) | |
| Towerco and ESCO Convergence | +1.80% | Sub-Saharan Africa, South Asia, Southeast Asia | Medium term (2-4 years) | |
| Financing of Rural Coverage and Universal-Service Commitments | +1.20% | Africa, South Asia, rest of Asia-Pacific | Short term (≤ 2 years) | |
| Climate-Resilience Investment After Extreme-Weather Events | +0.80% | South America, Caribbean, South and Southeast Asia | Short term (≤ 2 years) | |
| Source: Mordor Intelligence | ||||
5G Network Densification and Rising Site Power Demand
5G densification is increasing the amount of power needed at radio sites. A 2026 empirical study measured peak consumption of a fully loaded 5G macro radio unit at 1,090 W.[1] The challenge increases as sites are added in urban areas with grid connections, where power quality can be inconsistent. The Telecom Energy-as-a-Service Market therefore benefits from contracts that combine supply management, batteries, and backup generation. ITU-T L.1396, issued in October 2025, defines monitoring and control interfaces for power, cooling, and building-environment systems in telecom networks.[2] Better measurement supports the reporting and performance verification needed for contracted energy services.
Telecom Operator Shift From Capex Ownership to Predictable Opex
Operators are increasingly evaluating energy services as an operating expense rather than retaining every power asset on their balance sheets. Bharti Airtel stated in its FY26 results that it was working with Indus Towers to reduce diesel use through high-powered batteries and alternative energy sources.[3] This approach can transfer responsibility for procurement, replacement, and technology refresh to the provider that manages energy performance. The Telecom Energy-as-a-Service Market enables providers to offer long-term contracts rather than sell equipment as a one-time transaction. Huawei Digital Power reported that AI-based energy management in pilot deployments had delivered operating expense reductions of up to 50%.[4] The commercial value of such systems depends on whether site data, storage assets, and contractual incentives are aligned.
Diesel Displacement and Renewable-Energy Mandates
Diesel displacement is shifting from an efficiency objective to a procurement and policy requirement across several telecom markets. The GSMA documented policy changes that can help mobile operators access renewable electricity through corporate procurement and aggregation. Its Asia-Pacific review identified regulatory developments that can widen renewable-energy access for network operators.[5] The Telecom Energy-as-a-Service Market can use power purchase agreements to provide tower portfolios with access to renewable energy without requiring each operator to build and manage generation assets. Indus Towers signed a 130 MW power purchase agreement with JSW Green Energy Eight Limited in May 2025, illustrating portfolio-scale renewable procurement. Corporate climate commitments can further connect site-energy procurement with documented emissions reductions.
Towerco and ESCO Convergence
Tower companies and specialist energy service companies are increasingly competing and collaborating around the same site-energy portfolios. Tower companies can bundle power availability with tenancy and site-leasing arrangements, while specialist ESCOs can focus on guaranteed savings and project-level risk. In March 2026, IFC committed USD 45 million to IPT PowerTech Group to modernize 2,235 telecom sites in Ethiopia, Liberia, and Sierra Leone. The financing was intended to support cleaner, more reliable power and lower power costs at participating sites. The Telecom Energy-as-a-Service Market consequently has room for large infrastructure owners and specialized providers with access to blended finance. Competition is likely to be strongest where supply services can be priced as a commodity.
Restraints Impact Analysis of Telecom Energy-as-a-Service Market*
| RESTRAINT | (~) % IMPACT ON CAGR FORECAST | GEOGRAPHIC RELEVANCE | IMPACT TIMELINE |
|---|---|---|---|
| Contract Bankability and Counterparty Risk in Emerging Markets | -1.80% | Sub-Saharan Africa, South Asia, and frontier markets with high foreign-exchange volatility | Long term (≥ 4 years) |
| Brownfield Telemetry and Metering Gaps | -0.90% | Global, with a concentration in Africa and developing Asia-Pacific markets | Medium term (2-4 years) |
| Power-Asset Refresh Capital Requirements | -0.60% | Global, most acute in markets with aging diesel generator fleets | Medium term (2-4 years) |
| Multi-Vendor Integration and Cybersecurity Constraints | -0.40% | Global, particularly in networks with multi-decade equipment heterogeneity | Long term (≥ 4 years) |
| Source: Mordor Intelligence | |||
Contract Bankability and Counterparty Risk in Emerging Markets
The viability of an energy service agreement depends on reliable payment flows from the operator to the service provider and subsequently to lenders and suppliers. Foreign exchange fluctuations, fuel-cost volatility, payment delays, and contract enforcement risks can disrupt this payment chain. The UNEP Copenhagen Center on Energy Efficiency identifies access to finance as a recurring challenge for ESCO development. Frontier markets may offer significant diesel-displacement opportunities but often require more complex credit-support mechanisms. Development finance institutions can mitigate some of these risks, as demonstrated by IFC's financing for IPT PowerTech. However, the Telecom Energy-as-a-Service Market will remain constrained in markets where contract templates and repricing mechanisms do not adequately protect against substantial currency and fuel-cost fluctuations. Providers must balance long contract terms with sufficient flexibility to maintain service quality and meet debt repayment obligations.
Brownfield Telemetry and Metering Gaps
Older tower portfolios often lack the metering and telemetry infrastructure required for performance-based energy contracts. Without time-stamped, site-level data, providers cannot accurately verify baseline energy consumption or measure savings. ITU-T L.1396 provides a framework for standardized monitoring and control of telecom power systems. Applying these standards across legacy, multi-vendor equipment may require additional capital investment and operational coordination. This limitation is particularly significant for the Telecom Energy-as-a-Service Market, as performance guarantees are central to many energy supply and optimization agreements. Consequently, brownfield sites may be less attractive than greenfield or recently upgraded locations until operators modernize their data systems. Although metering upgrades can improve portfolio visibility, their initial cost may delay project approvals or reduce the number of eligible sites.
*Our forecasts treat driver/restraint impacts as directional, not additive. The impact forecasts reflect baseline growth, mix effects, and variable interactions.
Telecom Energy-as-a-Service Market Segment Analysis
By Service Component:
Energy Supply Anchors Revenue and Optimization Changes the Value CurveEnergy Supply Services are projected to account for 38.97% of the market in 2026, making them the largest service component. The segment includes per-kilowatt-hour billing, flat-fee site-energy agreements, and grid-supply arrangements supported by uptime commitments. These models are established in markets where tower portfolios already depend on third parties for fuel, site operations, or power procurement. They provide operators with a defined service price while providers manage energy delivery. Operations and Maintenance Services also remain critical, as uptime commitments depend on generator maintenance, battery cycling, inverter servicing, and fuel logistics. Financing, Asset Ownership, and Lifecycle Replacement form another part of the service stack, enabling providers to acquire, depreciate, and replace power assets. This model can reduce the capital burden for operators seeking access to newer power equipment, particularly when they require site upgrades without directly owning the assets.
Energy Optimization and Efficiency Services are projected to expand at a CAGR of 13.45% through 2032, the highest growth rate among service components. This segment of the Telecom Energy-as-a-Service Market focuses on load scheduling, energy monitoring, battery dispatch, virtual power plant participation, and demand-response arrangements. Huawei Digital Power reported that AI-enabled battery scheduling in European deployments generated EUR 800 in annual virtual power plant revenue per site and delivered an average three-year return on investment. The segment enables providers to compete on software capabilities and operational outcomes rather than asset ownership alone. It also helps operators reduce diesel runtime and improve battery utilization. However, providers require reliable telemetry to validate the savings committed under their contracts. Consequently, software capabilities and measurement quality are becoming increasingly interconnected in the Telecom Energy-as-a-Service Market. This segment is well suited to new entrants that can integrate algorithms with site operations and energy assets.

By Power Source:
Grid Power Leads and Solar Photovoltaic Changes Diesel UseGrid Power is projected to account for 30.14% of the Telecom Energy-as-a-Service Market size in 2026, making it the largest power-source segment. It is most relevant for urban and peri-urban sites with grid access. At these locations, providers can focus on power procurement, cost management, demand response, and renewable energy documentation. However, grid power does not eliminate the need for backup systems in areas with inconsistent power quality or availability. Diesel Generation remains important at off-grid and weak-grid sites, particularly across African tower portfolios. Battery Energy Storage Systems and hybrid renewable-diesel systems provide a transition from diesel-dependent operations to more renewable-led configurations. By July 2025, solar hybridization across 409 sites in Ghana had generated 1.47 GWh of clean electricity, according to Helios Towers.
Solar Photovoltaic is projected to expand at a CAGR of 13.78% through 2032, representing the fastest growth among power sources. The Telecom Energy-as-a-Service Market is increasingly using long-term power purchase agreements and battery offtake arrangements to scale solar procurement across tower portfolios. Indus Towers’ 130 MW agreement with JSW Green Energy Eight Limited demonstrates how tower companies can commit to renewable energy supply at the portfolio level. The company also entered into a memorandum of understanding with Cygni Energy in October 2026 for battery energy storage manufacturing capacity of up to 1.5 GWh for India’s telecom infrastructure. Solar systems can reduce fuel exposure when combined with storage and site controls. Their contribution depends on local solar resources, site-level power demand, storage design, and grid reliability. Solar procurement also provides providers with a practical means of addressing operators’ emissions-reduction commitments. Although the transition will not eliminate diesel use immediately, it will reduce diesel’s role within hybrid power architectures.
By Site Connectivity:
On-Grid Sites Lead and Weak-Grid Sites Set the Expansion NeedOn-Grid Sites are projected to hold 43.22% of the Telecom Energy-as-a-Service Market in 2026, making them the largest connectivity segment. These sites offer a clear opportunity for outsourced energy management because the grid supplies the core load. Service providers can optimize power procurement, manage backup systems, support renewable energy sourcing, and report energy performance. On-grid contracts can also incorporate on-site solar and storage when these systems improve economics or resilience. Vantage Towers completed solar installations at more than 400 ground-based sites in the Czech Republic in March 2026. According to the company, the project reduced annual energy consumption by 1 GWh. Although Off-Grid Sites represent a smaller segment, they remain important for demonstrating the economics of solar, storage, and diesel-hybrid systems.
Weak-Grid Sites are projected to expand at a 14.11% CAGR through 2032, the highest rate among connectivity segments. These sites have grid access, but grid reliability may not consistently support continuous telecom operations. Under managed contracts, the Telecom Energy-as-a-Service Market can combine grid intake, solar generation, backup generation, and battery storage. Huawei reported that its iGrid solution increased power availability from 60% to 99.9% at weak-grid sites in Africa by coordinating multiple power sources. American Tower’s 2025 Form 10-K stated that the company provides shared generator and battery-storage solutions to tenants in Africa through power-as-a-service arrangements. These examples indicate that weak-grid service models operate at scale and highlight the importance of provider capabilities in power orchestration, maintenance, and asset financing. Demand from weak-grid sites is likely to remain linked to network expansion in areas with inconsistent electricity quality.
Geography Analysis
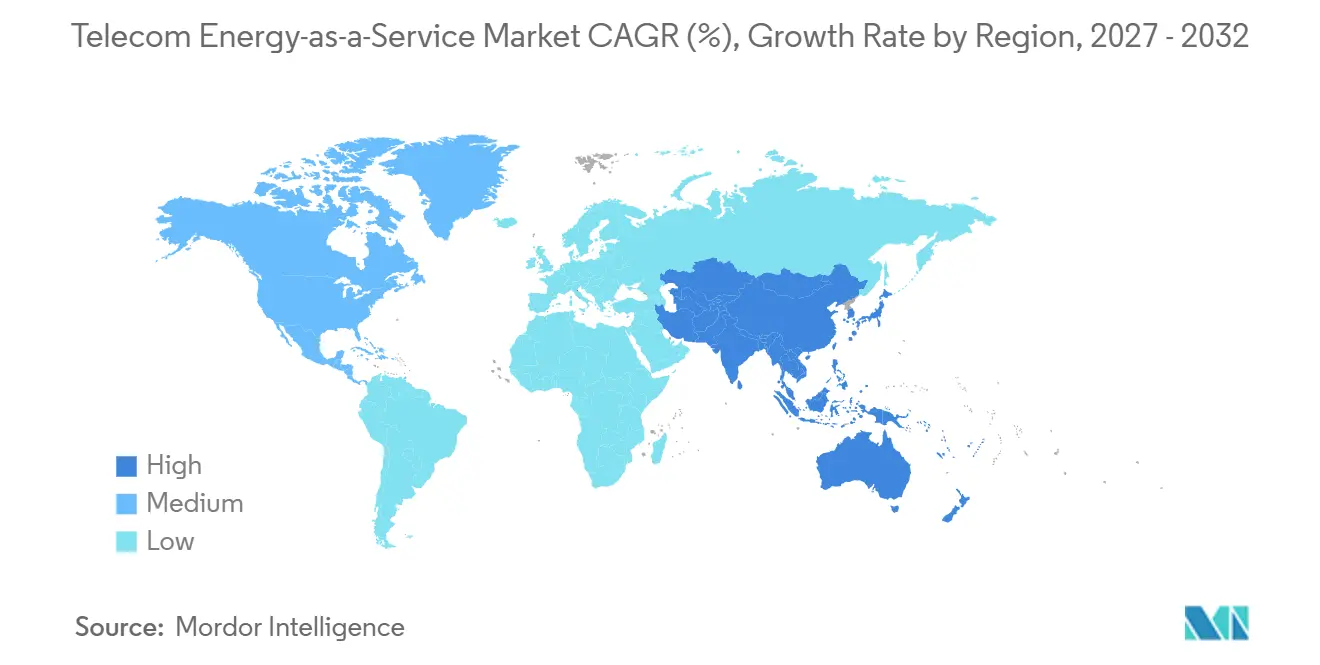
APAC Telecom Energy-as-a-Service Market
Asia-Pacific is projected to account for 27.65% of the Telecom Energy-as-a-Service Market in 2026 and grow at a CAGR of 14.23% through 2032. India offers a large deployment base through Indus Towers’ portfolio of more than 229,000 towers. Airtel is expected to provide solar access across 42,000 network sites by the end of FY26. China adds a technology dimension through site-energy platforms that integrate solar power, peak shaving, and storage optimization. The GSMA has identified policy developments across Asia-Pacific that could improve mobile operators’ access to renewable power. In the Philippines, the Energy Regulatory Commission is expected to reduce the retail aggregation threshold from 500 kW to 100 kW in 2026. This policy change could make aggregated renewable energy contracts more accessible to distributed telecom sites.
MEA Telecom Energy-as-a-Service Market
Africa and the Middle East present a strong need for managed energy services, as many tower sites rely on diesel generation or operate in weak-grid environments. The Telecom Energy-as-a-Service Market plays a distinct role in these regions because providers must manage both site reliability and energy costs. According to its 2025 Sustainability Report, American Tower reported 147 MW of renewable capacity and 1.1 GWh of battery storage across 25,500 global sites. Its power-as-a-service operations in Africa include shared generator and battery storage solutions for tenants. IFC financing for IPT PowerTech covers Ethiopia, Liberia, and Sierra Leone and targets power-cost reductions of up to 52% in Ethiopia. Such financing can help establish contract models in markets where commercial lenders remain cautious.
Europe and the Americas Telecom Energy-as-a-Service Market
North America and Europe place greater emphasis on optimization, renewable energy procurement, battery resilience, and participation in virtual power plants than on diesel displacement. Cellnex reported that renewable electricity accounted for 100% of its European portfolio’s electricity consumption in 2025. The company’s sustainability roadmap incorporates renewable electricity, energy efficiency, and emissions reductions into its operating model. These conditions support contracts focused on verifiable energy outcomes and resilience. In South America, Caban Energy secured USD 50 million in equity financing in April 2025 and became Digicel Group’s renewable energy partner in Jamaica. The program targets up to 25 Digicel markets across the Caribbean and Andean region. Regional opportunities will depend on the pace at which operators transition energy assets from direct ownership to managed-service models.
Competitive Landscape
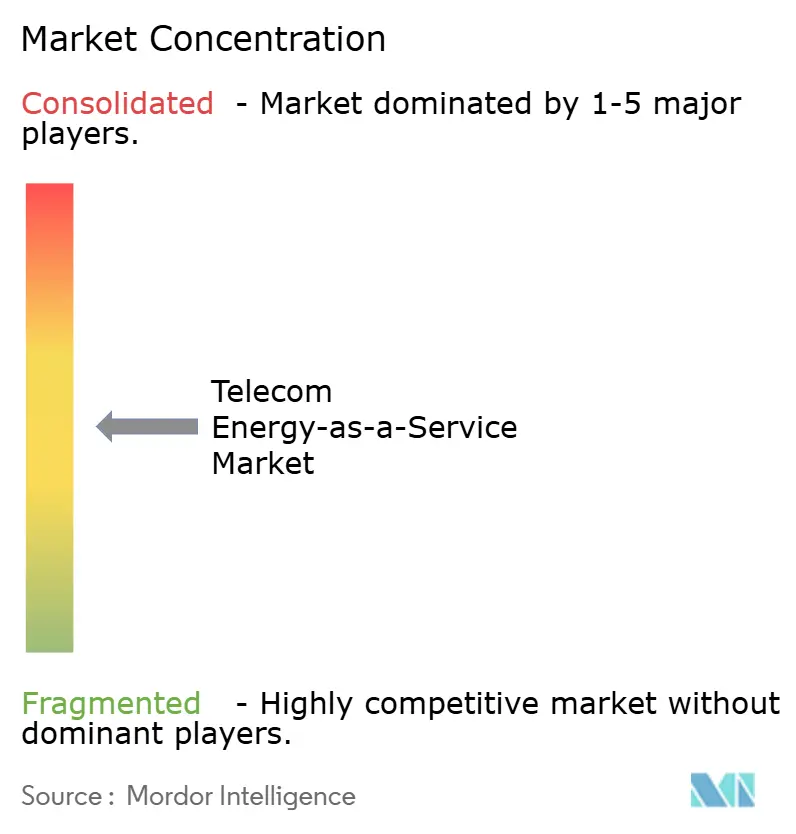
The Telecom Energy-as-a-Service Market is fragmented, although large tower companies and specialist providers are increasing their presence. American Tower Corporation, Indus Towers, Helios Towers, Cellnex Telecom, and edotco Group can integrate energy services into broader site-leasing arrangements. Their portfolio scale can strengthen their ability to negotiate renewable energy supply agreements and finance equipment upgrades. IPT PowerTech, ESCOTEL, Energy Vision, GreenWish Partners, Caban Systems, and Communication and Renewable Energy Infrastructure compete through service contracts, savings guarantees, and their capacity to assume capital risk. However, the market lacks a standardized contract model that can operate across countries without significant legal and financing modifications. American Tower confirmed in its 2025 Form 10-K that power-as-a-service arrangements are in operation in Africa. This development supports the commercial viability of managed power structures for multi-tenant tower sites.
Technology is reshaping competition, as asset ownership alone no longer establishes a provider’s competitive advantage. Indus Towers’ 130 MW renewable power agreement demonstrates a direct procurement strategy to reduce dependence on conventional site energy. American Tower reported 147 MW of on-site renewable capacity and 1.1 GWh of energy storage, demonstrating how tower companies can combine infrastructure scale with energy assets. Cellnex’s 2030 plan builds on its 2021-2025 program and includes a commitment to source 100% of its electricity from renewable sources across its operations. These initiatives make energy procurement, storage, and performance reporting integral components of the provider's offering. Specialist ESCOs can compete by developing financing structures that enable projects in higher-perceived-risk markets. AI-based energy management provides another avenue for differentiation by linking battery systems and site operations to measurable cost outcomes.
The competitive environment also depends on providers’ ability to document energy performance for customers and financiers. Huawei’s energy-management tools position software suppliers closer to the managed-service segment of the value chain. Tower companies can leverage their existing sites and tenant relationships to introduce bundled power services. ESCOs can offer more targeted energy contracts when they have access to blended finance and local operating capabilities. The Telecom Energy-as-a-Service Market remains open because contract structures, local power systems, and equipment conditions vary widely across countries. Companies that can manage renewable sourcing, storage, telemetry, and uptime through a single service model have a stronger basis for differentiation. Providers also require pricing structures that can withstand fluctuations in fuel costs and foreign exchange rates.
Telecom Energy-as-a-Service Industry Leaders
-
American Tower Corporation
-
Indus Towers Limited
-
Helios Towers plc
-
Cellnex Telecom, S.A.
-
SBA Communications Corporation
- *Disclaimer: Major Players sorted in no particular order
Telecom Energy-as-a-Service Market Companies Covered in this Report
- American Tower Corporation
- IHS Holding Limited
- Helios Towers plc
- Indus Towers Limited
- Cellnex Telecom, S.A.
- SBA Communications Corporation
- Vantage Towers AG
- PT Dayamitra Telekomunikasi Tbk
- Tower Bersama Infrastructure Tbk
- edotco Group Sdn Bhd
- Camusat S.A.S.
- Energy Vision Limited
- ESCOTEL
- Communication and Renewable Energy Infrastructure
- IPT PowerTech Group
- GreenWish Partners
- Applied Solar Technologies (India) Private Limited
- Caban Systems, Inc.
- Huawei Technologies Co., Ltd.
Recent Industry Developments in Telecom Energy-as-a-Service Market
- June 2026: American Tower published its 2025 Sustainability Report, disclosing 147 MW of on-site renewable energy capacity and approximately 1.1 GWh of battery energy storage across 25,500 global sites, alongside updated targets of a 30% greenhouse-gas-intensity reduction and 25% increase in on-site renewable generation by 2035.
- May 2026: Cellnex published its Sustainability Master Plan 2030, following the completion of its 2021-2025 ESG plan, achieving 100% renewable electricity, a 64% reduction in its carbon footprint, and ISO-certified management across 92% of its sites, establishing a compliance benchmark that EaaS counterparties across Europe are increasingly required to meet.
- March 2026: IFC committed a USD 45 million financing package, USD 27 million A-Loan, and USD 18 million blended climate finance, to IPT PowerTech Group for the modernization of 2,235 telecom sites in Ethiopia, Liberia, and Sierra Leone, targeting power-cost reductions of up to 52% in Ethiopia and annual emissions avoidance of more than 10,624 tCO₂e.
- February 2026: edotco Group received the Forward Faster Sustainability Award 2026 in the Climate Action category for integrating hybrid battery energy storage systems at off-grid tower sites, developed in collaboration with Universiti Kebangsaan Malaysia.
Global Telecom Energy-as-a-Service Market Report Scope
The Telecom Energy-as-a-Service Market Report is Segmented by Service Component (Energy Supply Services, Operations and Maintenance Services, Energy Optimization and Efficiency Services, and Financing, Asset Ownership and Lifecycle Replacement), Power Source (Grid Power, Diesel Generation, Solar Photovoltaic, Battery Energy Storage, and Hybrid Renewable and Diesel Systems), Site Connectivity (On-Grid Sites, Weak-Grid Sites, and Off-Grid Sites), and Geography (North America, South America, Europe, Asia-Pacific, and the Middle East and Africa). The Market Forecasts are Provided in Value (USD).
Segmentation Overview
| Energy Supply Services |
| Operations and Maintenance Services |
| Energy Optimization and Efficiency Services |
| Financing, Asset Ownership and Lifecycle Replacement |
| Grid Power |
| Diesel Generation |
| Solar Photovoltaic |
| Battery Energy Storage |
| Hybrid Renewable and Diesel Systems |
| Other Distributed Energy Sources |
| On-Grid Sites |
| Weak-Grid Sites |
| Off-Grid Sites |
| North America | United States |
| Canada | |
| Mexico | |
| South America | Brazil |
| Argentina | |
| Rest of South America | |
| Europe | Germany |
| United Kingdom | |
| France | |
| Italy | |
| Rest of Europe | |
| Asia-Pacific | China |
| India | |
| Japan | |
| South Korea | |
| Australia | |
| Rest of Asia-Pacific | |
| Middle East | Saudi Arabia |
| United Arab Emirates | |
| Rest of Middle East | |
| Africa | South Africa |
| Nigeria | |
| Rest of Africa |
| By Service Component | Energy Supply Services | |
| Operations and Maintenance Services | ||
| Energy Optimization and Efficiency Services | ||
| Financing, Asset Ownership and Lifecycle Replacement | ||
| By Power Source | Grid Power | |
| Diesel Generation | ||
| Solar Photovoltaic | ||
| Battery Energy Storage | ||
| Hybrid Renewable and Diesel Systems | ||
| Other Distributed Energy Sources | ||
| By Site Connectivity | On-Grid Sites | |
| Weak-Grid Sites | ||
| Off-Grid Sites | ||
| By Geography | North America | United States |
| Canada | ||
| Mexico | ||
| South America | Brazil | |
| Argentina | ||
| Rest of South America | ||
| Europe | Germany | |
| United Kingdom | ||
| France | ||
| Italy | ||
| Rest of Europe | ||
| Asia-Pacific | China | |
| India | ||
| Japan | ||
| South Korea | ||
| Australia | ||
| Rest of Asia-Pacific | ||
| Middle East | Saudi Arabia | |
| United Arab Emirates | ||
| Rest of Middle East | ||
| Africa | South Africa | |
| Nigeria | ||
| Rest of Africa | ||
Key Questions Answered in the Report
What is the Telecom Energy-as-a-Service Market size?
The Telecom Energy-as-a-Service Market is expected to increase from USD 5.70 billion in 2026 to USD 11.83 billion by 2032, at a 12.97% CAGR over 2027-2032.
What is driving demand for telecom energy-as-a-service?
5G power needs, diesel displacement, renewable procurement, and operators’ need for predictable energy costs are central drivers.
Which service component leads telecom energy-as-a-service?
Energy Supply Services led with a 38.97% share in 2026, while Energy Optimization and Efficiency Services are projected to expand at a 13.45% CAGR through 2032.
Which power source is expanding fastest for telecom sites?
Solar Photovoltaic is projected to expand at a 13.78% CAGR through 2032 as providers pair solar procurement with storage and managed contracts.
Which site connectivity type is expanding fastest?
Weak-Grid Sites is projected to expand at a 14.11% CAGR through 2032 because operators need dependable power where grid quality is inconsistent.
Which region leads the adoption of telecom energy-as-a-service?
Asia-Pacific held 27.65% in 2026 and is projected to expand at a 14.23% CAGR through 2032, supported by its large tower base and renewable-access reforms.