
Tea Market Analysis by Mordor Intelligence
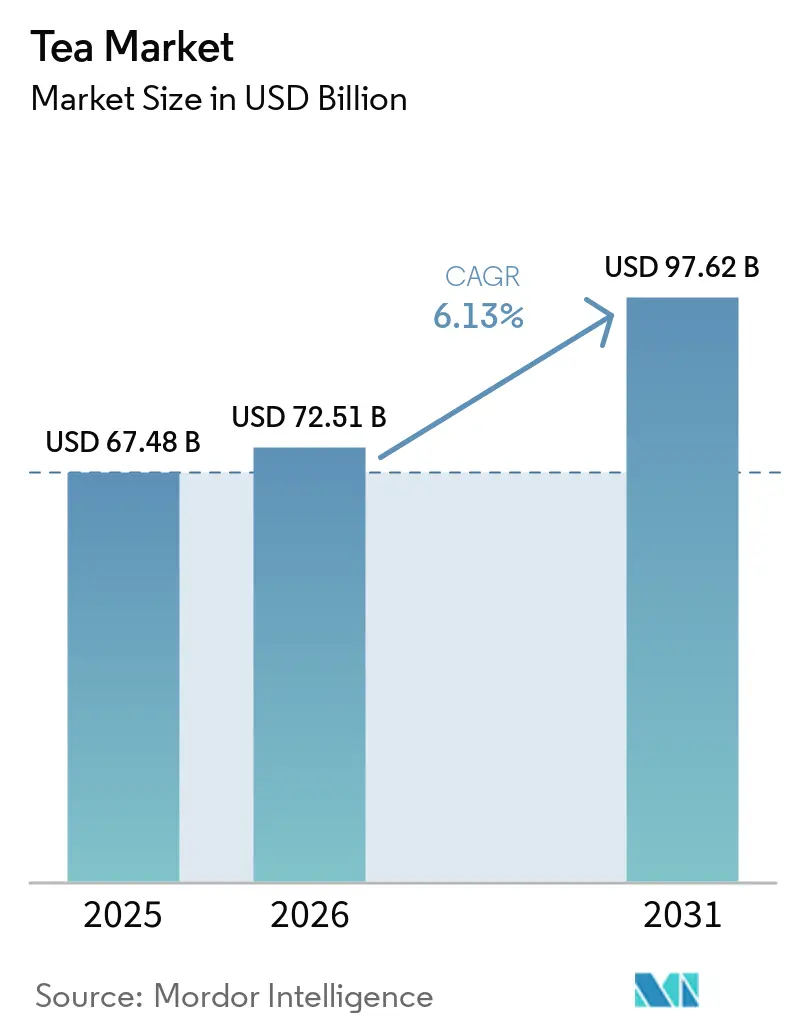
The tea market size was valued at USD 72.51 billion in 2026 and estimated to grow from USD 76.95 billion in 2027 to reach USD 102.4 billion by 2032, at a CAGR of 5.88% during the forecast period (2027-2032).
Health-oriented infusions and caffeine moderation give tea suppliers ways to compete for wellness-focused and later-day beverage choices. In Great Britain, active choice of Fairtrade tea and conversion of retail ranges connect ethical preference with certified supply on everyday shelves. Cold-brew formats in Japan add preparation and packaging to product differentiation, while flexible blends and sourcing help suppliers respond to changing leaf costs. United States tea tariffs beginning in 2025 added import-cost pressure, alongside rainfall-sensitive Kenyan supply and competing beverages in the United Kingdom. The commercial challenge is to win distinct drinking occasions while retaining enough sourcing flexibility to protect margins, since a differentiated finished drink still depends on affordable leaf.
Key Report Takeaways
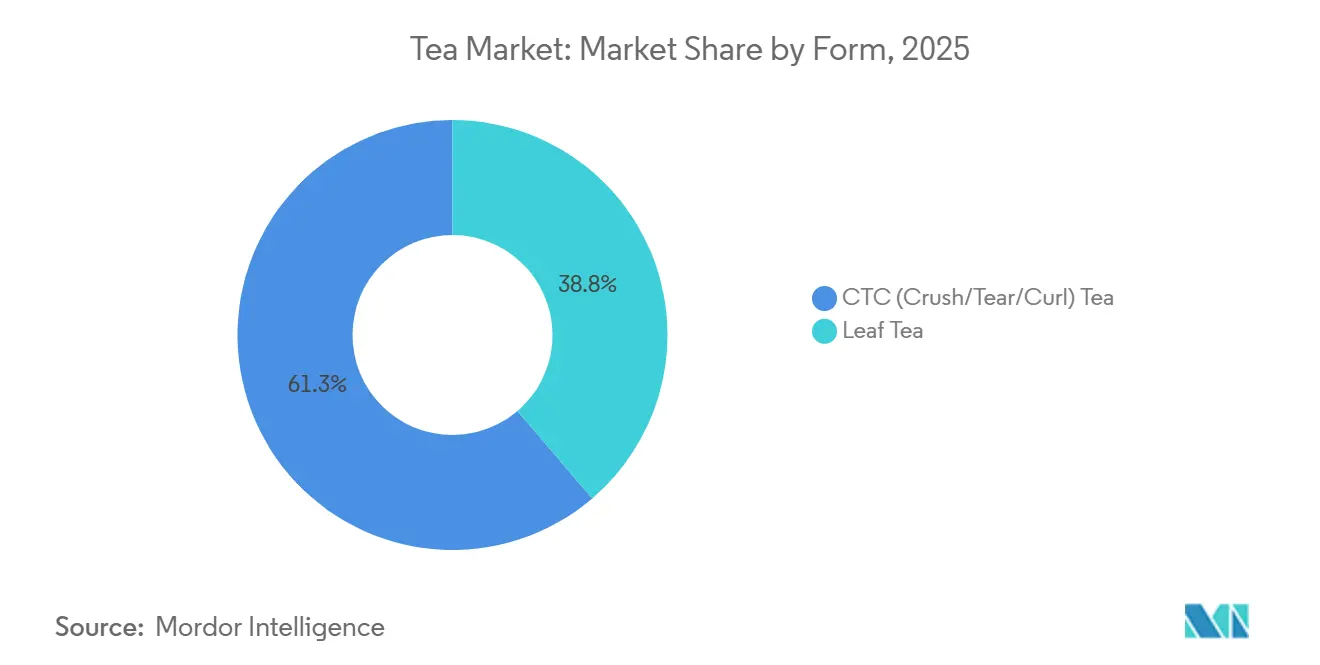
- By form, CTC (crush/tear/curl) tea led with a 61.13% tea market share in 2026, while leaf tea is forecast to grow fastest at a 6.2% CAGR during 2027-2032.
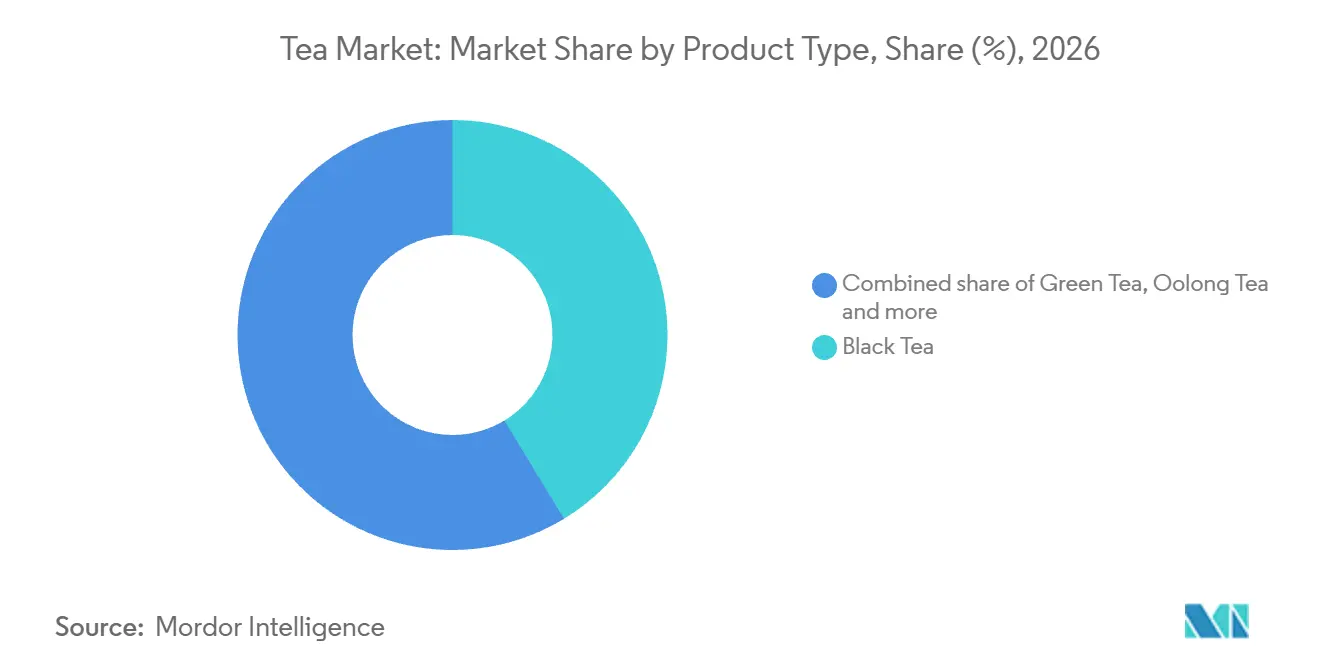
- Across product types, black tea accounted for a 41.32% share of the tea market size in 2026, and herbal and fruit tea infusions are forecast to grow fastest at a 7.25% CAGR during 2027-2032.
- Conventional tea led the category with 92.19% of tea and infusion spending in 2026, whereas organic tea is forecast to grow fastest at a 9.2% CAGR during 2027-2032.
- Within flavoring, unflavored tea led with 75.45% of tea and infusion spending in 2026, while flavored tea is forecast to grow fastest at a 7% CAGR during 2027-2032.
- Box packaging led with 71.11% of tea and infusion spending in 2026, while pouch packaging is forecast to grow fastest at a 6.8% CAGR during 2027-2032.
- Off-trade led distribution channels with 68.06% of tea and infusion spending in 2026, and on-trade is forecast to grow fastest at a 9.2% CAGR during 2027-2032.
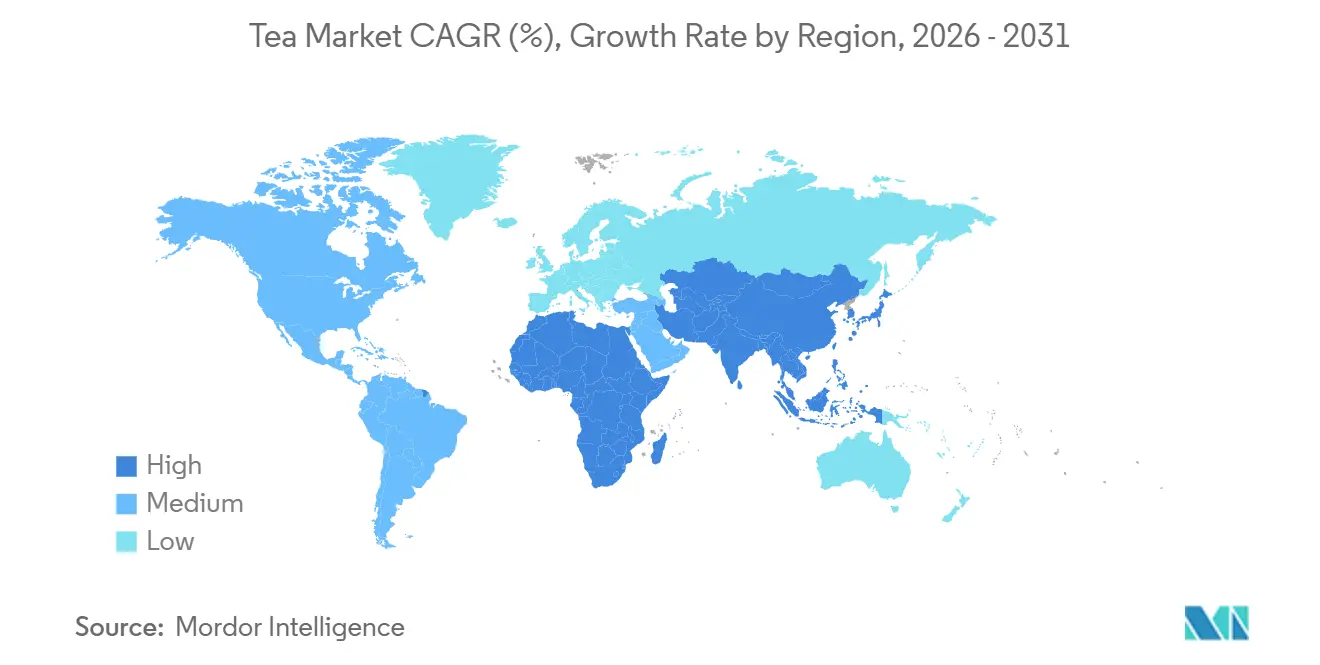
- Geographically, Asia-Pacific led with 36.97% of tea and infusion spending in 2026, while Middle East and Africa is forecast to grow fastest at an 8.2% CAGR during 2027-2032.
Note: Market numbers in this report are based on Mordor Intelligence's proprietary estimation framework, which combines nine months of actuals with Q4 projections for base year 2026.
Market Trends and Insights
Drivers Impact Analysis of Tea Market*
| Driver | (~) % Impact on CAGR Forecast | Geographic Relevance | Impact Timeline |
|---|---|---|---|
| Increased health consciousness is boosting the demand for green and herbal teas | +2.4% | Countries across Europe | Medium term (2-4 years) |
| Consumer preference for sustainable and ethically sourced products is driving market growth | +1.6% | The United Kingdom | Short term (≤ 2 years) |
| Innovation in flavors, blends, and packaging | +1.8% | Tea-consuming regions of Japan | Medium term (2-4 years) |
| Gen-Z increasingly prefers wellness teas with low caffeine or decaffeinated options. | +1.2% | The United States | Medium term (2-4 years) |
| Demand for single-origin tea drives market growth | +0.7% | The United Kingdom | Medium term (2-4 years) |
| Tea consumption patterns and their cultural importance | +1% | Guangzhou in Guangdong | Long term (≥ 4 years) |
| Source: Mordor Intelligence | |||
Increased health consciousness is boosting the demand for green and herbal teas
For herbal infusion suppliers, health-conscious demand creates room to compete on a drink’s formulation and intended occasion. In its 2026 assessment of women’s health botanicals, CBI described Europe’s functional herbal infusion market as large and growing, supported by rising health consciousness.[1] Women seeking low-calorie, low-caffeine drinks with potential wellness benefits were an important target group in that assessment. A 2025 article on the German Tea Report said green tea varieties, including matcha, were attracting health-conscious consumers in Germany. A formulation addressing both caffeine and calorie preferences can fit occasions where a stimulating or sweetened drink would be less suitable.
Consumer preference for sustainable and ethically sourced products is driving market growth
Ethical sourcing becomes commercially meaningful when certification reaches everyday retail tea ranges rather than depending entirely on specialist purchases. Fairtrade tea sales volume in the United Kingdom rose 35% in 2025 compared with 2024.[2] Kantar’s October 2025 survey found that 41% of adults aged 16 and older in Great Britain said they actively chose Fairtrade tea. Sainsbury’s conversion of all its own-brand black tea to Fairtrade in 2025 was a major contributor to the volume increase. The conversion illustrates how a retailer’s sourcing decision can carry certified supply into routine household consumption, giving participating producers access to an established selling channel. Securing a place in certified retail ranges is therefore the commercial opening for suppliers, since ethical credentials there become part of the standard product rather than a separate purchase occasion.
Innovation in flavors, blends, and packaging
Combining flavor development with a different brewing format can give tea suppliers a more distinct product proposition. In March 2025, ITO EN announced Japan’s first use of Pure Filter, a plant-derived biodegradable filter developed with Oji Holdings and Nissei, for its new cold-brew tea bags. The 4-variety series combined different teas with fruit flavors and was scheduled for sale in Japan from March 17, 2025. The partnership places part of product development in the filter itself, extending the brand’s design decisions beyond its tea blend. Its material developers therefore shape the drink’s visual appeal, since the filter’s clarity in water is part of the series’ stated appeal.
Gen-Z increasingly prefers wellness teas with low caffeine or decaffeinated options.
Caffeine moderation gives tea suppliers a way to compete for drinking occasions later in the day. In April 2025, Westrock Coffee executive Melissa Mackay said younger consumers drank tea instead of coffee later in the day to reduce caffeine intake. Twinings positioned its caffeine-free Refreshers herbal instant beverage particularly for Gen Z and Millennials when it announced U.S. distribution beginning in August 2025. A caffeine-free option can make the tea proposition suitable for an occasion defined by lower stimulation, extending its use beyond a consumer’s more caffeinated choices. The relevant competitive target is the later-day coffee occasion, where tea can replace a coffee serving as consumers seek to moderate caffeine.
Restraints Impact Analysis of Tea Market*
| Restraint | (~) % Impact on CAGR Forecast | Geographic Relevance | Impact Timeline |
|---|---|---|---|
| Intense competition from coffee and other beverages | -1% | The United Kingdom | Medium term (2-4 years) |
| Climate change and agricultural risks | -1.1% | Tea-growing regions in Kenya | Short term (≤ 2 years) |
| Consumer shift toward instant and functional beverages | -0.4% | The United Kingdom | Short term (≤ 2 years) |
| Regulatory challenges and import/export barriers hinder the smooth functioning of supply chains | -0.3% | India and European Union destinations | Medium term (2-4 years) |
| Source: Mordor Intelligence | |||
Intense competition from coffee and other beverages
Alternative beverages make additional tea-drinking occasions harder to win because the consumer can meet the same broad refreshment need elsewhere. In spring 2025, CREED Foodservice identified competition from alternative beverages and changing preferences as pressures on UK tea sellers. This constrains expansion because a familiar product does not automatically secure the next drink choice. The same report projected UK tea volume sales to decline 8% from 2023 to 2028. Each new flavor or format must give shoppers a reason to choose tea over the competing drink, leaving additional differentiation effort as a cost of winning incremental servings.
Climate change and agricultural risks
Rainfall volatility can limit the physical supply available to tea processors even when consumer demand is favorable. Tea Board of Kenya data reported by Kenya Broadcasting Corporation put production at 550.4 million kilograms in 2025, versus 598.5 million kilograms in 2024. The decline was attributed to erratic, poorly distributed rainfall. For processors drawing on Kenyan supply, a smaller harvest reduces the volume available to support their existing blends and additional orders. With Kenyan output down 8% in 2025, processors relying on that leaf face a choice between securing replacement supply and accepting lower throughput.
*Our forecasts treat driver/restraint impacts as directional, not additive. The impact forecasts reflect baseline growth, mix effects, and variable interactions.
Tea Market Segment Analysis
By Form:
Production Scale and Specialty TradingCTC (crush/tear/curl) tea accounted for a 61.13% share of the tea market size in 2026. Tea Board India recorded 1.23 billion kilograms of CTC production in India in 2025. The same 2025 table put North India’s CTC output at 1.04 billion kilograms and South India’s at 188.7 million kilograms. The largest segment by form thus has an Indian production base combining high volume with a strong regional concentration. The live expansion choice for a CTC supplier is whether to add to the dominant northern production base or to the much smaller southern one.
Leaf tea is forecast to be the fastest-growing segment by form, at a 6.2% CAGR during 2027-2032. Kenya held its first orthodox tea auction in Mombasa on September 24, 2025, with 2,925 packages weighing 91,798 kilograms going under the hammer. Orthodox processing produces whole, unbroken leaves suitable for specialty black, green, and oolong teas. This gives leaf suppliers a basis for specialty positioning, while the auction adds an organized commercial route for those lots. The first batch sold for USD 3.72 per kilogram, giving processors considering orthodox leaf a visible price signal from auction buyers.

By Product Type:
Black Tea and Broader Infusion RoutinesBlack tea represented a 41.32% tea market share in 2026. At Bama Tea Co., black-tea sales contributed 20.3% of company revenue in 2025, compared with 19.4% in 2024. The increase in its revenue share means black-tea sales grew faster than the company’s total revenue. Product development aimed at this core line would build on a category already contributing more heavily to Bama’s sales.
Herbal and fruit tea infusions are forecast to be the fastest-growing segment by product type, with a 7.25% CAGR during 2027-2032. A 2025 UK Tea & Infusions Association survey found around 3 in 10 UK consumers incorporated these infusions into daily routines alongside black or green tea. Green tea also has a specialty role in Germany, where the industry association linked matcha with younger consumers’ interest in other green and black tea specialties in 2025. Infusions that sit beside black or green tea in the UK survey widen the daily repertoire rather than replace the established cup, so growth depends on winning extra occasions.
By Category:
Conventional Scale and Organic Range DevelopmentConventional tea held 92.19% of total tea and infusion spending in 2026, making it the largest segment by category. Everyday buyers seeking a familiar cup at an accessible price give mainstream blends a broad role within this category. Serving that repeat-use demand favors large production runs built around consistent blends, so suppliers must balance leaf selection with the cost of the finished drink.
Organic tea is forecast to be the fastest-growing segment by category, with a 9.2% CAGR during 2027-2032. U.S. consumer sales of organic tea were USD 1.41 billion in 2025, up 9.2% year over year, according to the Organic Trade Association. The association also identified demand for both caffeinated and noncaffeinated options. An organic brand can retain one certified identity across products serving different caffeine preferences, since the association reports demand for both caffeinated and noncaffeinated options.
By Flavoring:
Blend Consistency and Formulation VarietyUnflavored tea held 75.45% of total tea and infusion spending in 2026, making it the largest segment by flavoring. For producers, a product defined by tea’s own taste makes blend and leaf specification the principal tools of differentiation. Changes in that base can therefore alter the tea character a repeat consumer recognizes.
Flavored tea is forecast to be the fastest-growing segment by flavoring, with a 7% CAGR during 2027-2032. Coca-Cola Europacific Partners reported that varieties such as Fuze Tea’s green tea and passion fruit ready-to-drink flavor, one of its fastest-growing in Spain, drew 50% of their volume from households under 49. For a blend developer, added flavor creates a way to distinguish products built around a similar underlying tea base. The under-49 household profile gives formulation teams a defined audience to address.
By Packaging Type:
Carton Scale and Refill FormatsBox packaging held 71.11% of total tea and infusion spending in 2026, making it the largest segment by packaging type. Bigelow Tea reports annual production of over 2.2 billion tea bags at 3 facilities in the United States. That connects the outer carton to a large stream of portioned tea production, because the non-heat-seal paper bags that make up about 90% of Bigelow’s tea bags sold are the type used in boxes.
Pouch packaging is forecast to be the fastest-growing segment by packaging type, with a 6.8% CAGR during 2027-2032. Angela Pryce launched Albion Tea’s loose-leaf range in the United Kingdom in 2025, with direct-to-consumer sales in tinplate caddies and refill pouches. Pairing a storage presentation with a refill format gives the brand separate options for an initial purchase and subsequent tea replenishment. Repeat purchases from Albion need not include the material and bulk of another tinplate caddy.
By Distribution Channel:
Digital Retail and Restaurant AccessOff-trade held 68.06% of total tea and infusion spending in 2026, making it the largest segment by distribution channel. Tata Consumer Products reported 38% market share for its India Tea business in e-commerce, including quick commerce, during FY2025-26. Online retail gives packaged tea another route to the consumer, and the company’s reported position illustrates an established brand’s substantial presence in that channel. A new entrant’s online availability would still compete with Tata’s established channel position, making product differentiation relevant even within quick-commerce services.
On-trade is forecast to be the fastest-growing segment by distribution channel, with a 9.2% CAGR during 2027-2032. In May 2026, Coca-Cola and McDonald’s agreed to make Fuze Tea the ready-to-drink tea brand at more than 660 McDonald’s establishments in Spain. An agreement with a restaurant chain can place one tea proposition into many consumer outlets through a single commercial relationship. That route gives the tea supplier access to drinking occasions where the restaurant’s menu shapes the available choice. Chain agreements concentrate the access decision in one relationship, creating both a distribution advantage and dependence on the restaurant buyer.
Geography Analysis
Asia-Pacific Tea Market
Asia-Pacific accounted for a 36.97% share of the tea market size in 2026, making it the largest geography. China recorded 2.38 million metric tons in domestic sales of traditional tea in 2025, according to the China Tea Marketing Association. Chagee reported 7,108 teahouses across 32 of China’s 34 province-level divisions on December 31, 2025, within a wider network of franchised and company-owned outlets. Large domestic demand and an extensive route to prepared servings put consumer access alongside leaf supply in decisions about product positioning and routes to buyers.
Middle East and Africa Tea Market
Middle East and Africa is forecast to be the fastest-growing geography, with an 8.2% CAGR during 2027-2032. The Chaii Republic, a Thrive Hospitality café concept, opened an outlet in Nairobi, Kenya, in July 2025, serving spiced kulhad chai and oat milk matcha alongside coffee. The opening adds a consumer-facing tea location where preparation and serving format are part of the product’s commercial value. Rwanda’s tea production also grew 8% in 2025, according to the National Agricultural Export Development Board. These developments create different commercial openings, with a larger crop supporting processing opportunities and a café capturing tea’s prepared-serving value directly from consumers.
In North America, California-based International Tea Importers said in 2025 that tariffs helped force its closure after 35 years, compounding existing financial strain from climate change and COVID-19. Its chief executive described over-leverage from financing inventory and tariffs, placing the burden on that company’s working capital. In Europe, Germany’s 2025 annual per-capita consumption of 39.2 liters of herbal and fruit infusions and 26.9 liters of black and green tea supports infusion-focused assortments. In South America, Chile’s 2025 Cadem survey found 76% of respondents enjoyed the once family meal daily and 31% named tea with bread and avocado among its associated foods. That places tea in Chile inside a shared family meal occasion.
Regulatory Framework and Outlook
This comparison covers selected jurisdictions from the perspective of suppliers developing packaged tea and herbal-infusion ranges for retail. Ingredient identity, product naming, residue compliance, and import verification can affect different parts of the same range. A formulation that offers commercial variety may consequently require a different legal product name or entry procedure across countries. Clear requirements support planning, while supplier qualification and clearance obligations add work before products reach buyers.
Regulatory Table of Tea Market
| Decision factor | United States | Argentina | Germany | India | Saudi Arabia |
|---|---|---|---|---|---|
| Primary authority | Food and Drug Administration (FDA) | Secretariat of Health Management for standards; Secretariat of Agriculture, Livestock and Fisheries through SENASA for other food control; provincial and City of Buenos Aires sanitary authorities | State and local food-control authorities | Food Safety and Standards Authority of India (FSSAI), with state and regional monitoring | Saudi Food and Drug Authority (SFDA) |
| Key instruments or direction | FSVP under 21 CFR 1.502, with applicable exceptions and modified requirements | CAA Article 1188 bis labeling provisions; Article 1192 permitted-herb table | EU Regulation 2026/742 on tea nicotine residues | December 24, 2025 tea-naming direction | August 2026 food-clearance guide and referenced tea standards |
| Commercial effect | Importers develop, maintain, and follow the applicable foreign supplier verification program, subject to exceptions or modified duties | For specified herb or food additions to tea, name the tea variety and added ingredients in descending proportion; olive leaves permitted for infusions | Temporary 0.5 mg/kg tea nicotine limit through February 22, 2030; review considers information submitted by that date or its absence | Products not derived from Camellia sinensis must not be named tea | Imported tea is subject to SFDA food-clearance procedures |
| Current policy attractiveness | Medium | High | Medium | Medium | Medium |
| Future direction of policy attractiveness | No change | Easing | No change | No change | No change |
| Source: Mordor Intelligence | |||||
The FDA’s verification regime and India’s fixed tea-identity boundary support medium ratings and continuity judgments, because entry depends on supplier controls and lawful product naming. The European Commission’s extension of the temporary 0.5 mg/kg tea nicotine limit until February 22, 2030, supports Germany’s medium rating and a continuity outlook.[3] Argentina’s high rating reflects explicit tea-labeling and herbal-infusion rules, while the olive-leaf addition effective December 2, 2025 widened the permitted-herb table. Saudi Arabia’s medium rating and continuity outlook rest on its August 2026 clearance framework, which places imported tea within SFDA food-control procedures.
Value Chain Stages
The value chain compares how growers, blenders, packers, and distributors capture income as tea moves toward its selling channels. Commercial resilience depends on coordinating these stages, because additional leaf output creates a sales opportunity only when processing and distribution can serve buyers. Tata Consumer Products invested in primary and secondary distribution infrastructure across its general-trade portfolio during FY2025-26. Its focus on route efficiency, outlet coverage, and service frequency across urban and rural markets makes distribution capability relevant alongside factory capacity.
Value Chain Analysis Table of Tea Market
| Primary activity | Key participants | Value capture | Bottleneck | Resilience response |
|---|---|---|---|---|
| Growing and primary processing | Tea growers and primary processors such as McLeod Russel India Limited and Dilmah | Processed tea sales | Matching harvest supply with processing throughput | Align leaf intake with available factory capacity |
| Blending and packing | Tea blenders such as McLeod Russel India Limited; packaging businesses such as Dilmah | Blended and packaged tea sales | Coordinating blend preparation with packing output | Qualify blend inputs and schedule packing runs together |
| Distribution to selling channels | Tea businesses with distribution networks such as Dilmah; diversified brand distributors such as Tata Consumer Products Ltd. | Tea sales to channel buyers | Maintaining outlet coverage and service frequency | Strengthen route infrastructure and coordinate replenishment |
| Source: Mordor Intelligence | ||||
Dilmah’s ownership of several tea gardens, factories, and printing and packaging facilities illustrates participation across multiple stages. McLeod Russel India Limited’s blending facilities in Amingaon and Dubai likewise extend its activities beyond estate production. Both companies can capture value beyond leaf production, Dilmah through its factories and packaging facilities and McLeod Russel through its blending sites, while taking responsibility for coordinating those additional operations.
Competitive Landscape
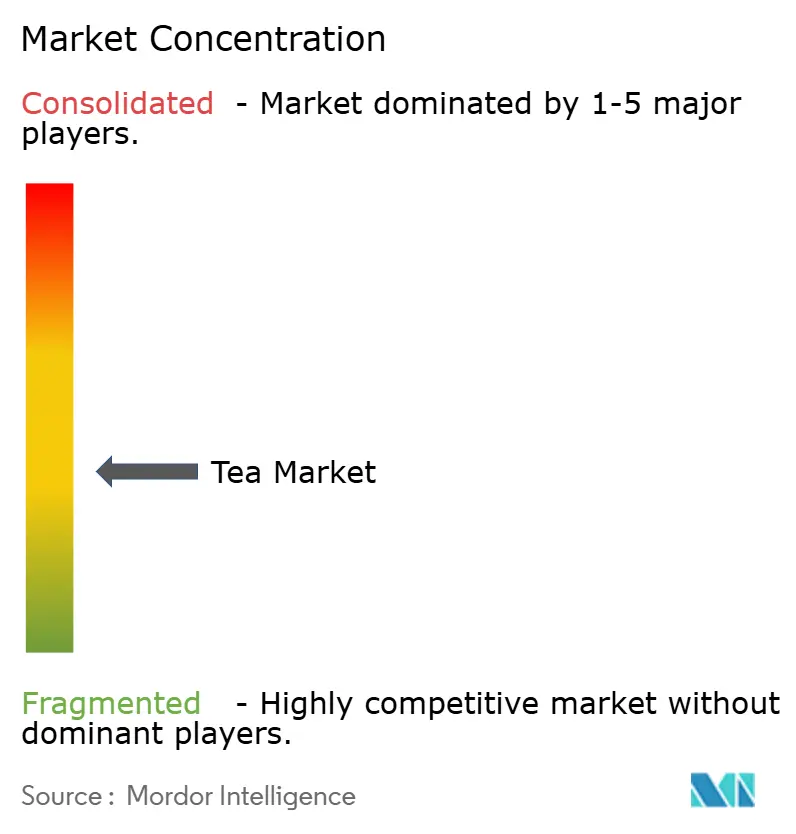
Competition is distributed across diversified beverage groups and tea-focused brand portfolios, giving the industry a moderately fragmented structure. Major players include PepsiCo, Inc., Tata Consumer Products Ltd., Associated British Foods PLC (ABF), ITO EN, Ltd., and Unilever plc. PepsiCo’s businesses made, marketed, distributed, and sold Lipton ready-to-drink tea through a joint venture with Unilever in 2025. Tata Consumer Products’ Tea business grew 3% by volume in FY2025-26, while ABF’s Grocery segment includes Twinings. Twinings’ own herbal and green tea sales rose 9% and 8% in the 52 weeks ended September 13, 2025, showing wellness-tea growth within a diversified group.
Company strategy also has to reconcile raw-tea cost changes with the price proposition offered to consumers, linking procurement choices to the way a finished tea competes. During elevated tea prices in FY2025-26, Tata Consumer Products’ India Tea business optimized blends, expanded its vendor base, and deployed advanced forecasting tools to protect margins. As tea prices moderated in the latter half of FY2025-26, the business passed on benefits to consumers. In May 2026, Tata’s board approved an Indian instant-tea facility proposal, with 2,000 metric tons of additional capacity planned over approximately 2 years, citing growing demand and saturated existing capacity.
Competitive direction shows in incumbents’ operating results and in how much of their supply they can document as certified. ITO EN’s Tea Leaves and Beverages Business reported 2.7% year-over-year net sales growth and 23.5% operating income growth for the 3 months ended July 31, 2026. Tata Consumer Products reported trustea certification for 63% of its tea procurement in FY2025-26. A supplier competing on sourcing credentials would need to distinguish its coverage or controls from an incumbent already documenting certified procurement.
Tea Industry Leaders
-
PepsiCo, Inc.
-
Tata Consumer Products Ltd.
-
Associated British Foods PLC
-
ITO EN, Ltd.
-
Unilever plc
- *Disclaimer: Major Players sorted in no particular order
Tea Market Companies Covered in this Report
- PepsiCo, Inc.
- Tata Consumer Products Ltd.
- Associated British Foods PLC
- ITO EN, Ltd.
- The Hain Celestial Group, Inc.
- Taiwan Tea Corporation
- R.C. Bigelow, Inc.
- Dilmah Ceylon Tea Company PLC
- DAVIDsTEA Inc.
- Harney & Sons Fine Teas
- Apeejay Surrendra Group
- Rishi Tea & Botanicals
- Lupicia Co., Ltd.
- Kirin Holdings Co., Ltd.
- Ten Ren Tea Co.
- Unilever plc
- JAB Holding Company
- McLeod Russel India Limited
- Teekanne GmbH & Co. KG
- Numi Organic Tea
- The Republic of Tea
- Bettys & Taylors of Harrogate Ltd.
Key Opportunities for Market Participants
These opportunities compare tea sales plays for limited-service restaurants in the United States and French commercial foodservice operators. In the National Restaurant Association’s 2026 survey, 31% of limited-service operators in the United States identified tea as a beverage growth category. In France’s commercial foodservice, excluding company and university vending machines, visits including tea consumption increased 8% year over year in Kantar’s 2025 panel. Together, these signals favor a focused tea offer that can turn operator interest and consumer visits into recurring beverage orders.
Market Opportunities Table of Tea Market
| Opportunity | Why now | Buyer / lead segment | Recommended play | Main barrier | Likely beneficiaries |
|---|---|---|---|---|---|
| Develop focused restaurant tea programs in the United States | Operators identified tea as a growth category in 2026 | U.S. limited-service restaurant operators | Test a compact tea menu before expanding the range | Delivering consistent preparation across outlets | Tea brands and foodservice tea suppliers |
| Increase repeat out-of-home tea occasions in France | Existing consumers averaged 5.2 such occasions annually in the 2025 panel | French operators serving established out-of-home tea drinkers | Build a dependable core offer around repeat ordering | Infrequent out-of-home tea occasions | Tea blenders and restaurant beverage suppliers |
| Recruit first-time out-of-home tea drinkers in France | Out-of-home tea reached 14.4% of people in France in the 2025 panel | French foodservice operators seeking additional tea customers | Offer a small introductory selection with clear drink descriptions | Converting trial into repeat consumption | Packaged tea brands and foodservice distributors |
| Source: Mordor Intelligence | |||||
The strongest opening is supplying repeatable tea programs to foodservice operators with a defined beverage-growth objective. Suppliers in the United States can build on operator interest, while the French opportunity calls for more frequent occasions among consumers already drinking tea outside the home. A U.S. program therefore needs to solve preparation across outlets, while French suppliers face a frequency challenge, making operational repeatability and a reason to reorder distinct requirements for the offer.
Recent Industry Developments in Tea Market
- Oct 2026: The Coca-Cola Company began a nationwide U.S. rollout of reformulated Gold Peak Zero Sugar ready-to-drink sweet tea with refreshed packaging on October 16, 2026.
- May 2026: Coca-Cola and McDonald’s Spain began offering Fuze Tea as the ready-to-drink tea brand at more than 660 McDonald’s locations from early May.
- May 2026: Tata Consumer Products approved a proposal for a new instant-tea facility in India, with a planned capacity addition of 2,000 metric tons over approximately 2 years.
Tea Market Report Scope and Research Methodology
Market Definition and Coverage
The global tea market measures annual end-user spending on tea and herbal or fruit infusions sold in packaged form or prepared for drinking. It covers purchases worldwide of hot or cold brewed products, with sales classified by product form, type, category, flavor, packaging, retail channel, and consumer destination.
Scope exclusions: Coffee and cocoa, tea accessories and brewing equipment, unprocessed fresh tea leaves sold to processors, and separately sold tea extracts or flavoring inputs are excluded.
Segments Covered in This Report
- By Form
- Leaf Tea
- CTC (Crush/Tear/Curl) Tea
- By Product Type
- Black Tea
- Green Tea
- Oolong Tea
- Herbal and Fruit Tea Infusions
- Other Product Types
- By Category
- Conventional Tea
- Organic Tea
- By Flavoring
- Unflavored
- Flavored
- By Packaging Type
- Box
- Bag
- Pouch
- Sachets
- Other Packaging Type
- By Distribution Channel
- Off-Trade
- Supermarkets/Hypermarkets
- Convenience/Grocery Stores
- Online Retail Stores
- Other Distribution Channels
- On-Trade
- Off-Trade
- By Geography
- North America
- United States
- Canada
- Mexico
- Rest of North America
- South America
- Brazil
- Colombia
- Chile
- Peru
- Argentina
- Rest of South America
- Europe
- United Kingdom
- Germany
- France
- Italy
- Spain
- Poland
- Belgium
- Sweden
- Rest of Europe
- Asia-Pacific
- China
- Japan
- India
- Australia
- Indonesia
- South Korea
- Thailand
- Singapore
- Rest of Asia-Pacific
- Middle East and Africa
- South Africa
- Saudi Arabia
- United Arab Emirates
- Nigeria
- Egypt
- Morocco
- Turkey
- Rest of Middle East and Africa
- North America
Data Sources, Market Sizing, and Validation
Desk Research
Public and official sources such as FAO's tea commodity profile and FAOSTAT's annual tea data collection provide context on production, trade, consumption, processing, and prices. Tea Board India's annual report and global demand-and-supply tables, drawing on International Tea Committee statistics, can inform production, exports, apparent consumption, auction prices, and regional patterns, while helping analysts test market direction and geography against end-user sales.
Company annual reports, regulatory materials, investor presentations, and reputable business press can supplement market indicators with product, channel, sourcing, and pricing context and help clarify unusual movements. The named sources are not exhaustive, and further sources inform collection, validation and clarification.
Primary Interviews and Surveys
Interviews and structured surveys would include tea growers and processors, branded tea and infusion producers, importers, retailers, and food-service buyers, with respondents positioned to discuss pricing, product mix, and channel sales. Their input would check secondary estimates, test assumptions on packaged versus prepared sales, and clarify how regional and segment evidence maps to the market boundary. Where evidence conflicts or a data point is missing, analysts would document the source and period, seek clarification from relevant respondents, and triangulate against independent production, trade, company, and retail indicators.
Distribution of primary research fieldwork respondents
| Company type | Respondent position | Region |
|---|---|---|
| Top tier: 35% | CXOs: 18% | APAC: 45% |
| Mid tier: 45% | Functional/Unit leaders: 37% | EMEA: 30% |
| Smaller Players: 20% | Managers: 45% | Americas: 25% |
Market-Sizing & Forecasting
The model estimates global annual end-user tea and infusion spending from the top down, using the accepted market total as the control and distributing value across form, product type, category, flavor, packaging, channel, and destination geography from source-reported shares, company disclosures, and trade or consumption patterns. Production and apparent consumption, export and import volumes, tea auction prices, consumer price and mix movements, and packaged versus prepared-channel activity serve as indicators: supply and trade help explain availability and destination demand, prices inform value per unit, and product and channel evidence supports the mix. A multivariate regression links these demand, price, and channel indicators to historical value where comparable observations exist, while scenario analysis carries alternative paths for weather-sensitive supply, input prices, and consumer shifts through the 2027-2032 forecast. Segment shares are built from reported sales or consumption splits and checked against company product and channel disclosures, while selective bottom-up checks compare sampled average selling prices multiplied by relevant sales volumes or supplier and channel roll-ups with the global total. Analysts investigate gaps in those checks, reconcile incompatible units and periods, and retain ranges or mark an input for clarification when source coverage cannot be aligned. Primary respondents would review the direction and business meaning of the key variable forecasts and flag unsupported assumptions for rechecking.
Data Validation & Update Cycle
Analysts triangulate market estimates against independent production, trade, price, company, and channel signals, then check totals, segment shares, units, periods, and regional roll-ups for anomalies and material variance. A second analyst reviews source traceability and model logic, and unresolved outliers return to the originating source or respondent for clarification before sign-off. The dataset is refreshed annually, reassessed between cycles after material supply, price, regulatory, or channel events, and given a fresh source and calculation review immediately before delivery.
Mordor Intelligence's Global Tea Market Size Measured Against Other Published Estimates
Published estimates can differ in the transactions and products they count and the inputs used to model demand. The global tea market measures annual end-user spending on tea and herbal or fruit infusions sold in packaged form or prepared for drinking.
Key Gap Drivers include the study's defined coverage and market-specific modeling choices. Production and apparent consumption, export and import volumes, tea auction prices, consumer price and mix movements, and packaged versus prepared-channel activity serve as indicators: supply and trade help explain availability and destination demand, prices inform value per unit, and product and channel evidence supports the mix.
Benchmark comparison
| Source | Market Size | Gaps in Research Methodology |
|---|---|---|
| Mordor Intelligence | USD 76.95 B (2027) | |
| Global Consultancy A | USD 69.5 B (2025) | At its 2025 base, this estimate is 9.7% below this report's 2027 value of USD 76.95 B, 2 years later. Its published valuation path places the estimate at an earlier point in a rising forecast period. |
| Global Consultancy B | USD 59.08 B (2026) | At its 2026 base, this estimate is 23.2% below this report's 2027 value of USD 76.95 B, 1 year later. Its earlier valuation point and slower stated forecast path both point lower against the later comparison. |
Mordor Intelligence's analysts triangulate market estimates against independent production, trade, price, company, and channel signals, then check totals, segment shares, units, periods, and regional roll-ups for anomalies and material variance.
Key Questions Answered in the Report
What is the tea market size and growth outlook?
The market is estimated at USD 76.95 billion in 2027 and forecast to reach USD 102.4 billion by 2032, at a 5.88% CAGR during 2027-2032.
What is driving demand for tea and herbal infusions?
Health-oriented infusions and ethical sourcing support demand. UK Fairtrade tea volume rose 35% in 2025 versus 2024, with Sainsbury’s 2025 conversion of all its own-brand black tea to Fairtrade a major contributor.
Which tea form has the largest share?
CTC (crush/tear/curl) tea held 61.13% of spending in 2026. Leaf tea is forecast to grow fastest among forms, at a 6.2% CAGR during 2027-2032.
Which companies are major tea competitors?
Major competitors include PepsiCo, Inc., Tata Consumer Products Ltd., Associated British Foods PLC, ITO EN, Ltd., and Unilever plc.
What could constrain the tea industry’s outlook?
Kenya Broadcasting Corporation reported Tea Board of Kenya output of 550.4 million kilograms in 2025, versus 598.5 million in 2024, with the decline attributed to erratic, poorly distributed rainfall. Such crop disruption can limit supply.
Which regions lead tea demand and forecast growth?
Asia-Pacific accounted for 36.97% of spending in 2026. Middle East and Africa is forecast to grow fastest, with an 8.2% CAGR during 2027-2032.