
Tanker Shipping Market Size and Share
Market Overview
| Study Period | 2021 - 2032 |
|---|---|
| Market Size (2027) | USD 149.75 Billion |
| Market Size (2032) | USD 197.19 Billion |
| Growth Rate (2027 - 2032) | 5.66 % |
| Fastest Growing Market | Asia-Pacific |
| Largest Market | North America |
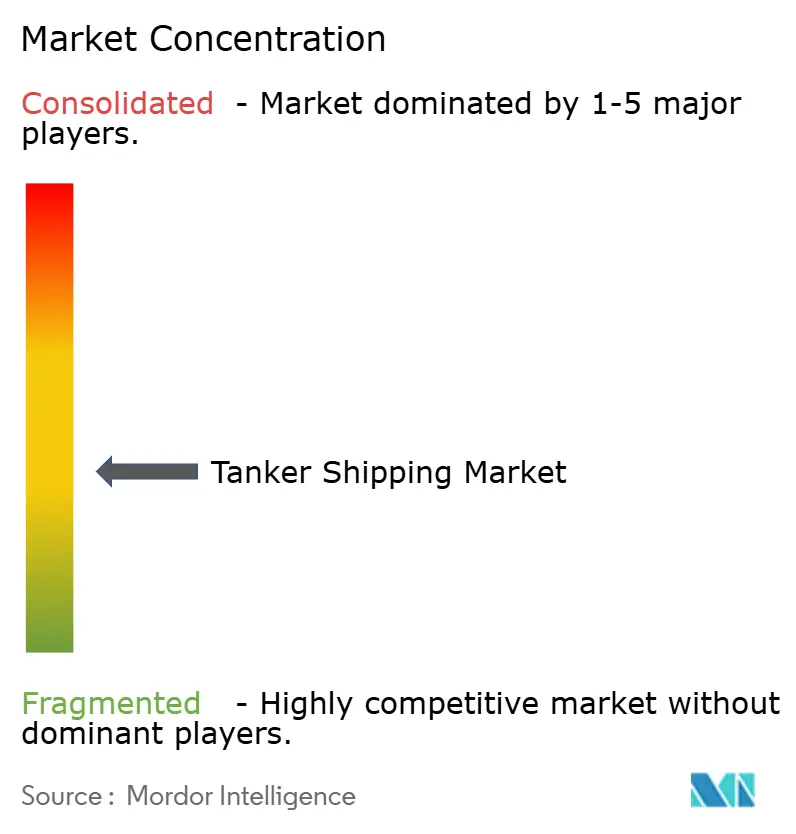
| Market Concentration | Medium |
Major Players *Disclaimer: Major Players sorted in no particular order Image © Mordor Intelligence. Reuse requires attribution under CC BY 4.0. | |
Tanker Shipping Market Analysis by Mordor Intelligence
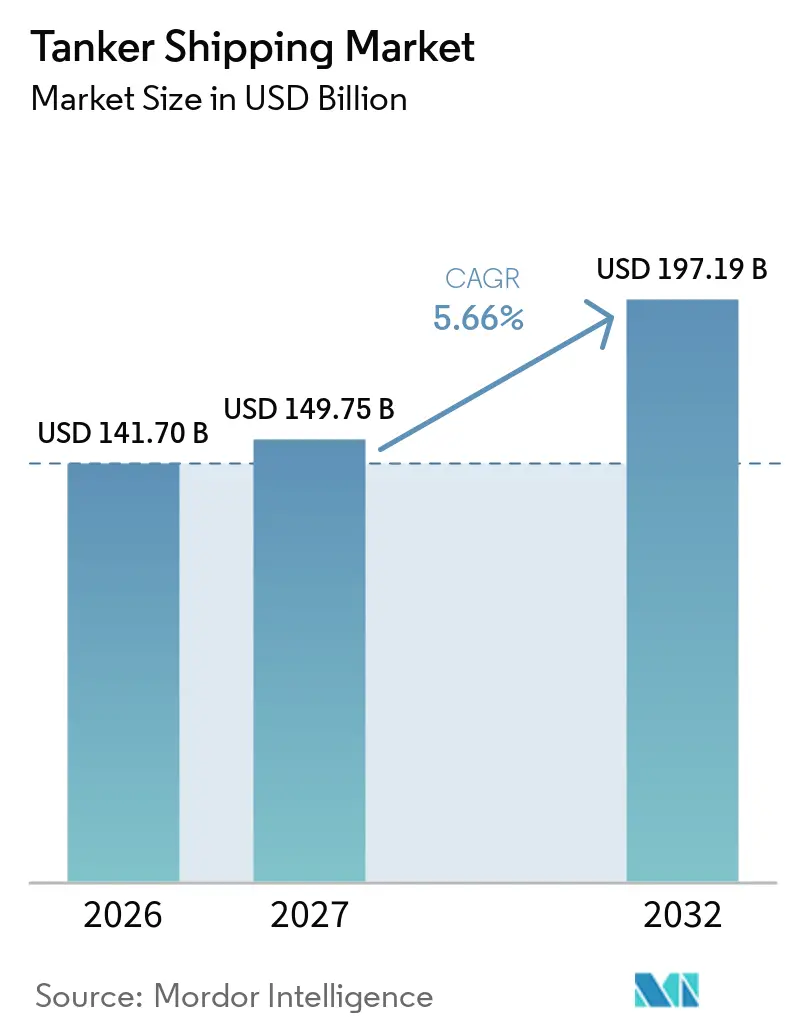
The tanker shipping market size is valued at USD 141.70 billion in 2026 and is estimated to grow from USD 149.75 billion in 2027 to reach USD 197.19 billion by 2032, at a CAGR of 5.66% during the forecast period (2027-2032).
The tanker shipping market is supported by the global reliance on seaborne energy imports. Global oil demand is projected to increase by 720,000 barrels per day to 104.4 million barrels per day by the end of 2026.[1] Non-OECD Asian economies are expected to provide most of that incremental consumption. IMO carbon-intensity requirements are also raising the value of modern, efficient vessels in international trade. The fleet included 84 ammonia-ready vessels in operation and 169 on order in December 2025. Freight income remains sensitive to oil production decisions, vessel availability, and route security.
Key Report Takeaways
- By cargo type, crude oil held 36.50% of the tanker shipping market share in 2026, while liquefied gas is forecast to grow at a 7.52% CAGR through 2032.
- By tanker type, crude oil tankers held 32.40% of the tanker shipping market size in 2026, while LNG/LPG tankers are forecast to grow at a 7.41% CAGR through 2032.
- By vessel size, large and Aframax/Suezmax tankers held 31.45% of the tanker shipping market share in 2026, while VLCCs are forecast to grow at a 7.59% CAGR through 2032.
- By trade type, deep-sea/international shipping held 56.30% of the tanker shipping market size in 2026, while short-sea shipping is forecast to grow at a 6.88% CAGR through 2032.
- By end user, oil & gas companies held 37.80% of the tanker shipping market share in 2026, while energy & gas companies are forecast to grow at a 7.30% CAGR through 2032.
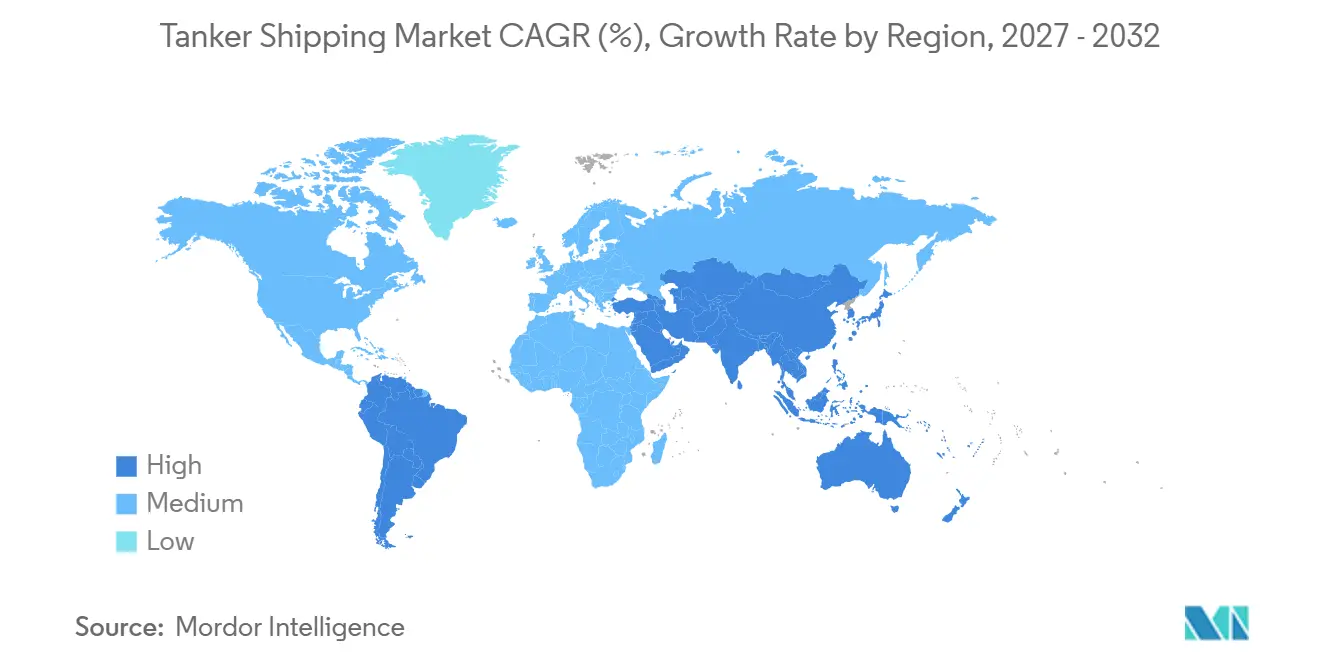
- By geography, North America held 29.20% of the tanker shipping market size in 2026, while Asia-Pacific is forecast to grow at a 7.81% CAGR through 2032.
Note: Market numbers in this report are based on Mordor Intelligence's proprietary estimation framework, which combines nine months of actuals with Q4 projections for base year 2026.
Market Trends and Insights
Drivers Impact Analysis of Tanker Shipping Market*
| Driver | (~) % Impact on CAGR Forecast | Geographic Relevance | Impact Timeline |
|---|---|---|---|
| Rising Seaborne Energy Demand in Asia-Pacific | +1.8% | Asia-Pacific core, with spillover to the Middle East and Africa | Medium term (2-4 years) |
| Geopolitical Rerouting and Higher Ton-Mile Demand | +1.5% | Global, most acute on the Asia-Europe and Middle East-Asia corridors | Short term (≤ 2 years) |
| Refinery Expansion and Cross-Regional Petroleum Product Trade | +1.2% | Middle East and Asia-Pacific, with spillover to Africa | Medium term (2-4 years) |
| Compliant-Tonnage Scarcity from Shadow-Fleet Exclusion | +0.9% | Global, concentrated in European and North American compliance zones | Short term (≤ 2 years) |
| Ammonia-Ready and Methanol-Ready Fleet Premiums | +0.6% | Global, concentrated in Europe, Japan, and South Korea | Long term (≥ 4 years) |
| Source: Mordor Intelligence | |||
Rising Seaborne Energy Demand in Asia-Pacific
Asia-Pacific energy import needs continue to support the tanker shipping market because non-OECD Asian economies are expected to contribute most of the oil transport, with a 720,000-barrel-per-day increase in global oil demand projected by the end of 2026. The region continues to require long-haul crude and product movements to serve growing consumption centers. China, India, and Southeast Asian economies remain important destinations for imported energy cargoes. Expansion of petroleum product import infrastructure also supports demand for tanker services. The Atlantic Basin crude surplus is expected to widen to 7.1 million barrels per day by 2030, supporting long-distance flows to East-of-Suez customers. These flows keep crude tanker utilization linked to refinery demand in China, India, and other Asian import markets.
Geopolitical Rerouting and Higher Ton-Mile Demand
Rerouting has added distance to major tanker voyages and has increased the tanker shipping market’s need for active capacity. Suez Canal tonnage in May 2025 remained 70% below its 2023 level. Many operators retained Cape of Good Hope routes for East-West voyages during the disruption. Longer voyages reduce the annual number of trips that each ship can make. This reduces effective vessel supply even when the number of ships does not change. The southern Africa detour extended Asia-Europe routes and shifted capacity from other lanes.[2]
Refinery Expansion and Cross-Regional Petroleum Product Trade
New refining capacity in export regions supports product tanker activity within the tanker shipping market. Middle Eastern refineries are expected to add 860,000 barrels per day to global product supply by 2030. East-of-Suez refining capacity is still expected to fall short of the region’s demand growth. This leaves a continuing need for imports from surplus refining centers. Product tankers carry these movements across long trade routes between suppliers and consuming markets. The resulting arbitrage supports utilization for ships serving the refined petroleum product trade.
Compliant-Tonnage Scarcity from Shadow-Fleet Exclusion
Sanctions have directed some cargo demand toward insured and certified ships in the tanker shipping market. The United States Treasury designated around 180 tankers and related entities linked to Russian oil exports in January 2025. The United Kingdom added more than 40 tankers to its sanctions list in October 2025. Australia sanctioned 60 vessels in June 2025.[3] Sanctioned ships face barriers to mainstream trade, insurance, and port access. Charterers that require compliant tonnage need to compete for a smaller available fleet.
Restraints Impact Analysis of Tanker Shipping Market*
| Restraint | (~) % Impact on CAGR Forecast | Geographic Relevance | Impact Timeline |
|---|---|---|---|
| Decarbonization Compliance and Alternative-Fuel Capital Requirements | -1.2% | Global, most acute in EU and North American compliance jurisdictions | Long term (≥ 4 years) |
| Freight-Rate Volatility and Exposure to Oil-Price Cycles | -1.0% | Global | Short term (≤ 2 years) |
| Safety, Insurance, and Environmental Externalities of the Shadow Fleet | -0.7% | Global, concentrated along Russian, Iranian, and Venezuelan trade corridors | Medium term (2-4 years) |
| Delivery-Wave Risk from the Expanding Tanker Orderbook | -0.5% | Global, concentrated on major deep-sea crude and product trade lanes | Medium term (2-4 years) |
| Source: Mordor Intelligence | |||
Decarbonization Compliance and Alternative-Fuel Capital Requirements
Carbon rules add capital and operating requirements across the tanker shipping market. IMO Resolution MEPC.400(83), adopted in April 2025, requires an 11% carbon intensity reduction from the 2019 reference line in 2026. The reduction factor rises to 13.6% in 2027 and 21.5% in 2030. A vessel’s CII rating is affected by design, trading pattern, and total energy use. Operators on long rerouted voyages can, therefore, face rating pressure even with efficient vessels. EU ETS, FuelEU Maritime, and MARPOL Annex VI add overlapping cost requirements for ships calling at European ports.
Freight-Rate Volatility and Exposure to Oil-Price Cycles
Freight earnings in the tanker shipping market remain exposed to oil production decisions and security events. Tanker rates increased in June 2025 after risk escalated around the Strait of Hormuz. World oil demand was expected to grow by 830,000 barrels per day in 2025. This was the lowest growth rate since 2009, excluding the COVID period. Sanctions and supply rerouting can create temporary rate increases that fade as trade patterns adjust.[4] Spot-market operators are more exposed when these rate changes also influence vessel values and chartering decisions.
*Our forecasts treat driver/restraint impacts as directional, not additive. The impact forecasts reflect baseline growth, mix effects, and variable interactions.
Tanker Shipping Market Segment Analysis
By Cargo Type:
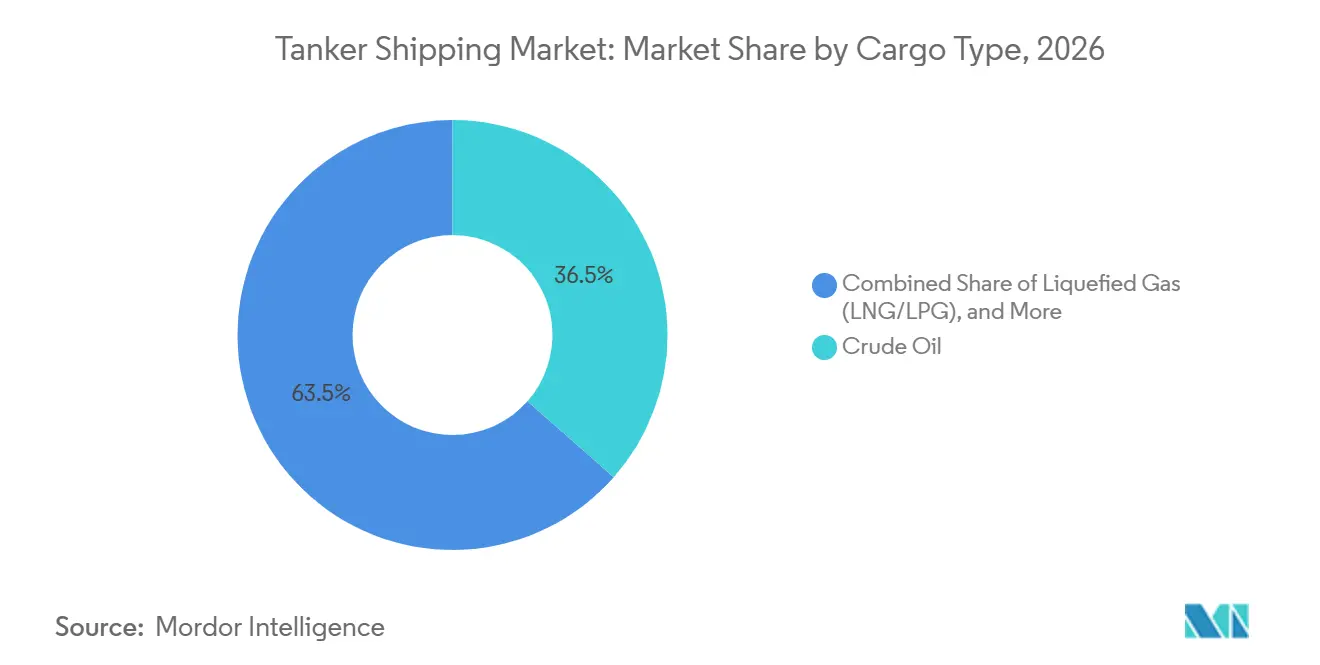
Crude Oil Remains the Largest Cargo StreamCrude oil held 36.50% of the tanker shipping market share in 2026. It remained the largest cargo stream because major producers and Asian refineries depend on long-haul crude trade. The Strait of Hormuz carried nearly 15 million barrels per day of crude during 2025, before it was closed indefinitely. This route links Middle Eastern producers with major Asian buyers. Refined petroleum products formed the next major cargo group. They benefit from trade between refining surplus regions and markets with product supply gaps.
Liquefied gas is projected to expand at a 7.52% CAGR through 2032. LNG and LPG cargo are supported by import terminal development and growing gas procurement in Asia. The tanker shipping market serves these flows with vessels that have specialized containment and handling systems. Chemicals, vegetable oils, fats, and other liquid bulk cargoes occupy smaller but distinct routes. These cargoes often require parcels or coated tankers. Their specialized operating requirements limit direct substitution by conventional crude carriers.
By Tanker Type:
Crude Tankers Lead While LNG/LPG Vessels Grow FasterCrude oil tankers accounted for 32.40% of the tanker shipping market size in 2026. Their position reflects the central role of long-haul crude movements in global energy supply. Product tankers support the distribution of gasoline, diesel, and other refined fuels. Chemical tankers operate under separate cargo handling and ship design requirements. The International Chemical Tanker Code applies to chemical carriers and supports the need for specialized equipment. This technical distinction supports established operators with suitable fleets.
LNG/LPG tankers are projected to grow at a 7.41% CAGR through 2032. The Ammonia Energy Association recorded 84 ammonia-ready vessels in service worldwide in December 2025. It also recorded 169 ammonia-ready vessels on order. Some LPG and chemical carriers can become part of the ammonia transport network as trade develops. LNG dual-fuel systems provide another route for operators seeking lower-emission capability. These fleet decisions are changing the investment mix across the tanker shipping industry.
By Vessel Size:
Large Tankers Lead and VLCCs Expand FastestLarge and Aframax/Suezmax tankers held 31.45% of the tanker shipping market share in 2026. These ships serve crude and product trades across short, medium, and long routes. Aframax vessels remained important in regional and export trades where port limits restrict larger ships. Medium-range tankers support high-volume refined product movements. Small and handy tankers remain relevant in coastal routes with draft constraints. Their role is especially clear in ASEAN and Mediterranean trade lanes.
VLCCs are projected to grow at a 7.59% CAGR through 2032. They benefit from the long-haul movement of Atlantic Basin crude to Asian demand centers. The global tanker fleet reached 8,090 vessels at the end of July 2026, while the orderbook reached 1,535 vessels. The orderbook-to-fleet ratio was 19.0%, up from 15.8% in mid-2025. New deliveries can add capacity, although replacement of older ships may limit net fleet growth. This delivery cycle remains a key consideration for the tanker shipping market.
By Trade Type:
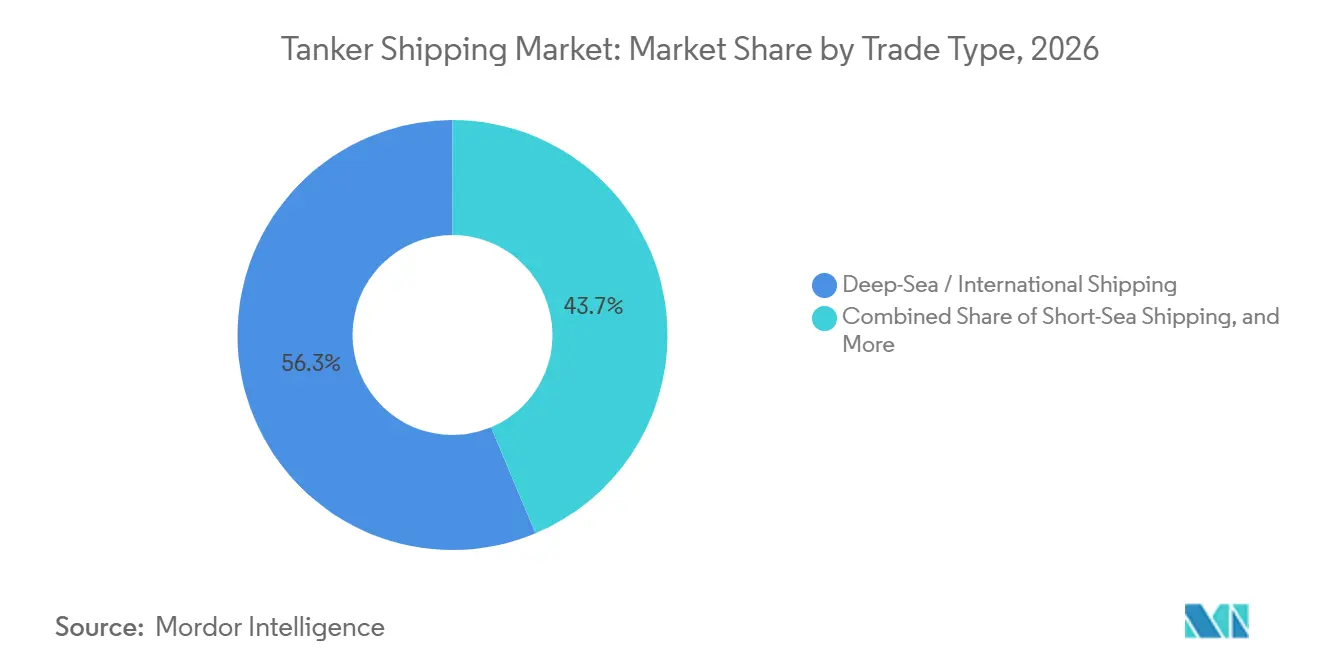
Deep-Sea Shipping Holds the Main Revenue PositionDeep-sea/international shipping held 56.30% of the tanker shipping market size in 2026. Long voyages between the Middle East, the Americas, Europe, and Asia generate the highest ton-mile demand. VLCC crude movements from the Arabian Gulf to China are central to this trade. Product tanker voyages from Atlantic Basin refineries to Asian import markets also support revenue. Domestic and coastal shipping remains important for local refinery and distribution networks. The United States Jones Act trade and Brazilian coastal crude flows are examples of these shorter routes.
Short-sea shipping is projected to grow at a 6.88% CAGR through 2032. Southeast Asian terminal investment supports additional regional product movements. South and Southeast Asian LNG import infrastructure also adds regional gas transport demand. Medium-range and smaller tankers are suited to many of these routes. Coastal operations may face changing compliance expectations as port-state controls develop. The tanker shipping market, therefore, serves both high-value deep-sea routes and expanding regional supply chains.
By End User:
Oil and Gas Companies Remain the Largest CharterersOil & gas companies held 37.80% of the tanker shipping market share in 2026. These companies charter VLCC and Suezmax capacity for term and voyage business. Long-term charter agreements can provide a stable utilization base for shipowners. Refineries and petroleum product companies charter vessels for crude feedstock and product distribution. Petrochemical and chemical companies support demand for specialized chemical tankers. Commodity traders remain important in the spot market, where their activity is closely linked to pricing conditions.
Energy & gas companies are projected to expand at a 7.30% CAGR through 2032. This group includes buyers increasing LNG procurement in South Korea, Japan, India, and Southeast Asia. New seaborne buyers add demand for LNG and LPG carrier capacity. Liquefaction projects in the United States, Africa, Canada, and Argentina are expected to require dedicated shipping routes. These developments broaden the group of charterers using specialized gas vessels. They also make fleet availability important for the tanker shipping market.
Geography Analysis
North America and Europe Tanker Shipping Market
North America held 29.20% of the tanker shipping market share in 2026. The United States Gulf Coast has become a major origin for crude and LNG exports. Long-haul shipments to Europe and Asia support Suezmax and Aframax utilization. Texas and Louisiana LNG export projects also support gas carrier demand. Europe remains a major consuming region and has adjusted its crude sourcing away from Russian supply. European import routes increasingly draw cargo from the Americas, West Africa, and the Middle East.
APAC Tanker Shipping Market
Asia-Pacific is projected to grow at a 7.81% CAGR through 2032. Southeast Asian economies are expanding their petroleum product import infrastructure. LNG terminals are also developing in Bangladesh, Pakistan, Vietnam, and the Philippines. China and India received 44% of crude exports that passed through the Strait of Hormuz in 2025. COSCO Shipping Energy Transportation and China Merchants Energy Shipping are expanding fleets in line with long-term energy security goals. This approach limits spot-market exposure for part of the regional fleet.
South America and MEA Tanker Shipping Market
South America remains a growing tanker demand base through Brazilian crude exports from the Campos and Santos Basins. These exports move mainly to Asia and Europe on VLCC and Suezmax voyages. Argentina’s LNG export plans could add gas carrier demand during the forecast period. The Middle East and Africa are both cargo origins and refining export regions. The UAE and Saudi Arabia moved more than 7 million barrels per day of crude through the Strait of Hormuz in 2025. Qatar’s LNG exports further support the role of liquefied gas within the tanker shipping market.
Competitive Landscape
The tanker shipping market is moderately fragmented because no operator holds a dominant position across all vessel classes. Greek shipowners, including Tsakos Energy Navigation, Minerva Marine, and Okeanis Eco Tankers, hold important positions in VLCC and Suezmax operations. Their capacity becomes more valuable when compliant crude tanker availability tightens. East Asian state-linked operators also have a substantial role in regional energy logistics. COSCO Shipping Energy Transportation and China Merchants Energy Shipping continue to align fleet decisions with supply security. Their focus differs from operators seeking mainly short-term freight returns.
CMB.TECH delivered 2 ammonia-ready VLCCs under the Euronav brand in November 2025. The 319,000 DWT vessels show how larger owners are positioning fleets for future fuel requirements. Product and chemical tanker competition includes Scorpio Tankers, Hafnia, TORM, and Ardmore Shipping. These operators face high vessel interchangeability and earnings that closely follow regional refining margins. Larger owners can use scale to seek longer time-charter coverage. Smaller owners often have greater spot-market exposure and face higher costs on older ships.
Yara Clean Ammonia and NYK concluded a time-charter agreement in 2025 for an ammonia-fueled medium gas carrier scheduled for delivery in November 2026. The agreement ties vessel deployment to a specific fuel supply relationship. It shows why fuel handling capability is becoming relevant alongside vessel ownership. Ammonia carrier and methanol-ready product tanker niches provide room for early fleet investment. Modern ships can be more attractive to cargo owners who require lower-emission logistics. The tanker shipping market remains competitive across crude, product, chemical, and gas carrier operations.
Tanker Shipping Industry Leaders
-
Frontline Ltd.
-
Euronav NV
-
Scorpio Tankers Inc.
-
International Seaways, Inc.
-
DHT Holdings, Inc.
- *Disclaimer: Major Players sorted in no particular order
Tanker Shipping Market Companies Covered in this Report
- Frontline plc
- CMB.TECH NV
- Scorpio Tankers Inc.
- International Seaways, Inc.
- DHT Holdings, Inc.
- Teekay Corporation
- Tsakos Energy Navigation Limited
- Bahri
- Hafnia Limited
- Odfjell SE
- Stolt-Nielsen Limited
- TORM plc
- Ardmore Shipping Corporation
- Mitsui O.S.K. Lines, Ltd.
- Nippon Yusen Kabushiki Kaisha
- COSCO Shipping Energy Transportation Co., Ltd.
- China Merchants Energy Shipping Co., Ltd.
- Kuwait Oil Tanker Company
- MISC Berhad
- Minerva Marine Inc.
- ADNOC Logistics & Services plc
- Okeanis Eco Tankers Corp.
- Overseas Shipholding Group, Inc.
- EXMAR
Recent Industry Developments in Tanker Shipping Market
- September 2026: Trafigura established Volare Shipping Ltd., a new group company to own, operate, and scale a modern VLCC fleet comprising 6 vessels in operation and 8 newbuilds on order. The company disclosed a contemplated private placement of approximately USD 500 million and a proposed listing on Euronext Growth Oslo, with Trafigura retaining majority ownership following the offering.
- July 2026: ADNOC Logistics and Services purchased 5 VLCCs from Frontline for approximately USD 590 million and separately acquired 3 very large gas carriers for approximately USD 115 million each. The company also chartered approximately 25 crude tankers from Sinokor Maritime to manage surging cargo volumes amid tight tanker supply around the Strait of Hormuz.
- June 2026: DHT Holdings ordered one new VLCC from Hanwha Ocean, scheduled for delivery in August 2028 as part of the company's Antelope Class series. The order extended DHT's modern fleet program, building on two earlier Hanwha deliveries received in H1 2026.
- April 2026: Hafnia Limited signed a newbuild agreement with Hyundai Heavy Industries for 8 MR product tankers at a total purchase price of approximately USD 405 million, with deliveries scheduled between Q3 2028 and Q2 2029. The order supported fleet renewal and incorporated fuel-efficient designs aligned with CII compliance pathways.
Global Tanker Shipping Market Report Scope
Segmentation Overview
| Crude Oil |
| Refined Petroleum Products |
| Chemicals |
| Liquefied Gas (LNG/LPG) |
| Vegetable Oils & Fats |
| Other Liquid Bulk Cargo |
| Crude Oil Tankers |
| Product Tankers |
| Chemical Tankers |
| Liquefied Gas (LNG/LPG) Tankers |
| Others |
| Small and Handy Tankers |
| Medium-Range Tankers |
| Large & Aframax/Suezmax Tankers |
| Very Large Crude Carriers (VLCC) |
| Others |
| Domestic / Coastal |
| Short-Sea Shipping |
| Deep-Sea / International Shipping |
| Oil & Gas Companies |
| Refineries & Petroleum Product Companies |
| Petrochemical & Chemical Companies |
| Energy & Gas Companies |
| Commodity Traders & Others |
| North America | United States |
| Canada | |
| Mexico | |
| South America | Brazil |
| Argentina | |
| Peru | |
| Chile | |
| Rest of South America | |
| Europe | Germany |
| United Kingdom | |
| France | |
| Italy | |
| Spain | |
| Russia | |
| Nordics (Denmark, Finland, Iceland, Norway, and Sweden) | |
| Rest of Europe | |
| Asia-Pacific | China |
| India | |
| Japan | |
| South Korea | |
| Australia | |
| Southeast Asia (ASEAN) | |
| Rest of Asia-Pacific | |
| Middle East and Africa | Saudi Arabia |
| United Arab Emirates | |
| Qatar | |
| South Africa | |
| Nigeria | |
| Egypt | |
| Rest of Middle East and Africa |
| By Cargo Type | Crude Oil | |
| Refined Petroleum Products | ||
| Chemicals | ||
| Liquefied Gas (LNG/LPG) | ||
| Vegetable Oils & Fats | ||
| Other Liquid Bulk Cargo | ||
| By Tanker Type | Crude Oil Tankers | |
| Product Tankers | ||
| Chemical Tankers | ||
| Liquefied Gas (LNG/LPG) Tankers | ||
| Others | ||
| By Vessel Size | Small and Handy Tankers | |
| Medium-Range Tankers | ||
| Large & Aframax/Suezmax Tankers | ||
| Very Large Crude Carriers (VLCC) | ||
| Others | ||
| By Trade Type | Domestic / Coastal | |
| Short-Sea Shipping | ||
| Deep-Sea / International Shipping | ||
| By End User | Oil & Gas Companies | |
| Refineries & Petroleum Product Companies | ||
| Petrochemical & Chemical Companies | ||
| Energy & Gas Companies | ||
| Commodity Traders & Others | ||
| By Geography | North America | United States |
| Canada | ||
| Mexico | ||
| South America | Brazil | |
| Argentina | ||
| Peru | ||
| Chile | ||
| Rest of South America | ||
| Europe | Germany | |
| United Kingdom | ||
| France | ||
| Italy | ||
| Spain | ||
| Russia | ||
| Nordics (Denmark, Finland, Iceland, Norway, and Sweden) | ||
| Rest of Europe | ||
| Asia-Pacific | China | |
| India | ||
| Japan | ||
| South Korea | ||
| Australia | ||
| Southeast Asia (ASEAN) | ||
| Rest of Asia-Pacific | ||
| Middle East and Africa | Saudi Arabia | |
| United Arab Emirates | ||
| Qatar | ||
| South Africa | ||
| Nigeria | ||
| Egypt | ||
| Rest of Middle East and Africa | ||
Key Questions Answered in the Report
What is the projected value of tanker shipping in 2032?
The sector is forecast to reach USD 197.19 billion by 2032, rising from USD 149.75 billion in 2027 at a 5.66% CAGR.
Which cargo type holds the largest share?
Crude oil leads with 36.50% share in 2026, supported by long-haul movements from major producing regions to Asian refineries.
Which vessel category is growing fastest?
Very large crude carriers are forecast to grow at a 7.59% CAGR through 2032, supported by long-distance crude movements to Asia.
Why are tanker voyages taking longer?
Red Sea disruption has diverted many ships around the Cape of Good Hope, increasing voyage distances and reducing effective capacity.
Which region is expanding fastest?
Asia-Pacific is expected to grow at a 7.81% CAGR through 2032, supported by energy import demand and new gas import infrastructure.
How do carbon rules affect tanker operators?
CII reduction requirements and regional rules raise compliance costs and favor owners with modern, efficient fleets.