
Sustainable Aviation Fuel Market Size and Share
Market Overview
| Study Period | 2022 - 2032 |
|---|---|
| Market Size (2027) | USD 3.74 Billion |
| Market Size (2032) | USD 24.27 Billion |
| Growth Rate (2027 - 2032) | 45.36 % |
| Fastest Growing Market | Asia-Pacific |
| Largest Market | North America |
| Market Concentration | Medium |
Major Players *Disclaimer: Major Players sorted in no particular order Image © Mordor Intelligence. Reuse requires attribution under CC BY 4.0. | |
Sustainable Aviation Fuel Market Analysis by Mordor Intelligence
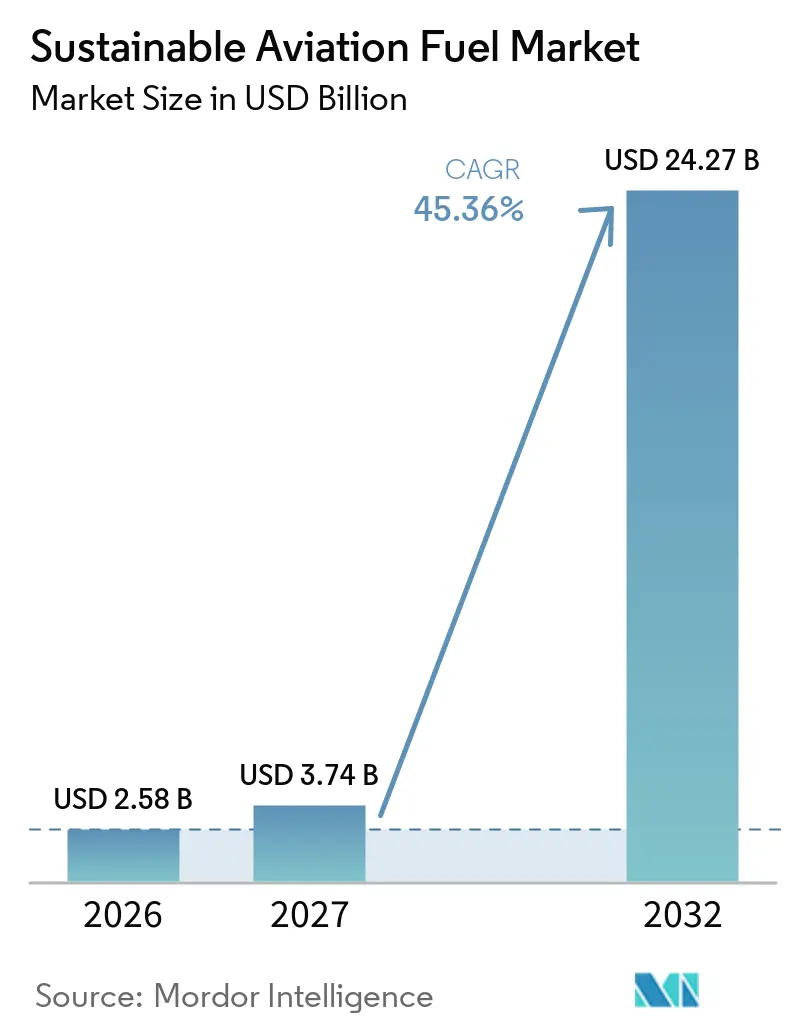
The Sustainable Aviation Fuel Market size is projected to be USD 2.58 billion in 2026, USD 3.74 billion in 2027, and reach USD 24.27 billion by 2032, at a CAGR of 45.36% from 2027 to 2032. Binding fuel mandates are making demand more predictable for producers, particularly in Europe and parts of Asia-Pacific. EU airports received 1.1 million tons of sustainable aviation fuel in 2025, equal to 2.8% of aviation fuel supplied at Union airports and above the 2% obligation.[1] This result showed that regulatory requirements can convert announced capacity into physical supply. It also highlighted the sector’s dependence on Hydro processed Esters and Fatty Acids (HEFA) feedstocks and the need for alcohol-to-jet, waste-to-fuel, and power-to-liquid capacity. Long-term airline purchase agreements and corporate certificate purchases are widening the set of buyers willing to support new facilities.
Key Report Takeaways
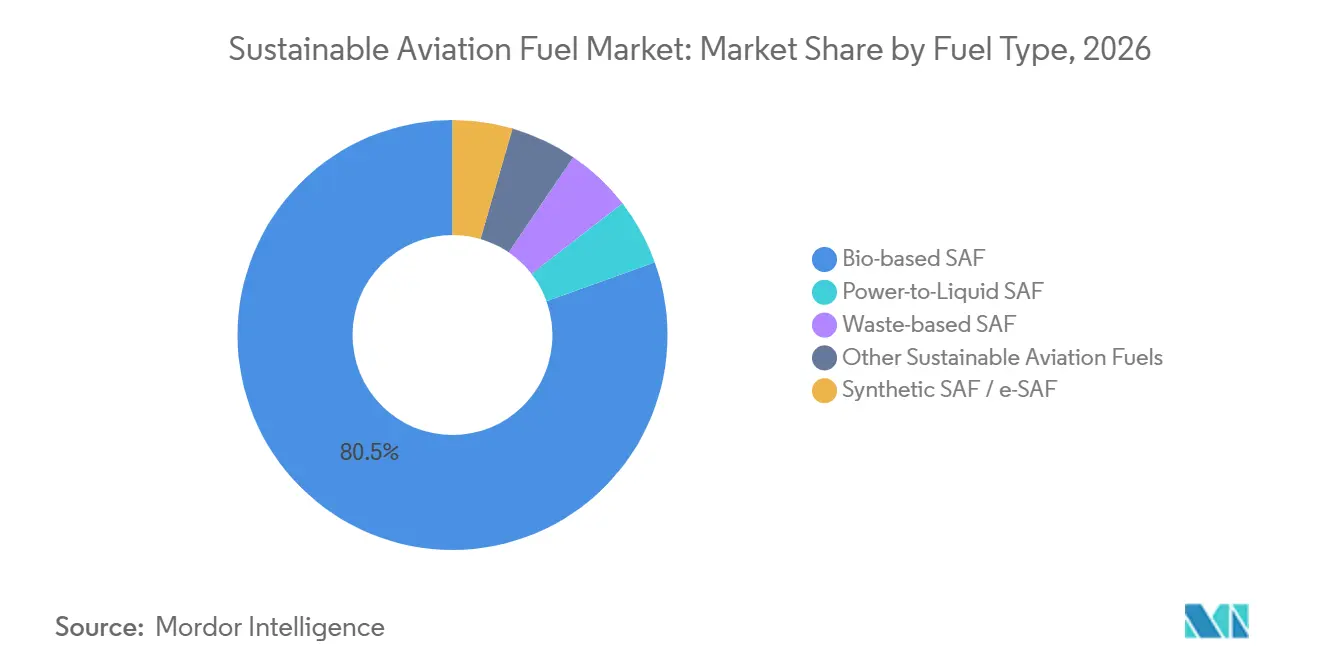
- By fuel type, bio-based fuel held 80.5% of the sustainable aviation fuel market share in 2026, while power-to-liquid fuel is projected to record a 47.5% CAGR through 2032.
- By blending ratio, up-to-10% blends accounted for 62.1% of the sustainable aviation fuel market size in 2026, while above-50% blends are projected to grow at a 48.3% CAGR through 2032.
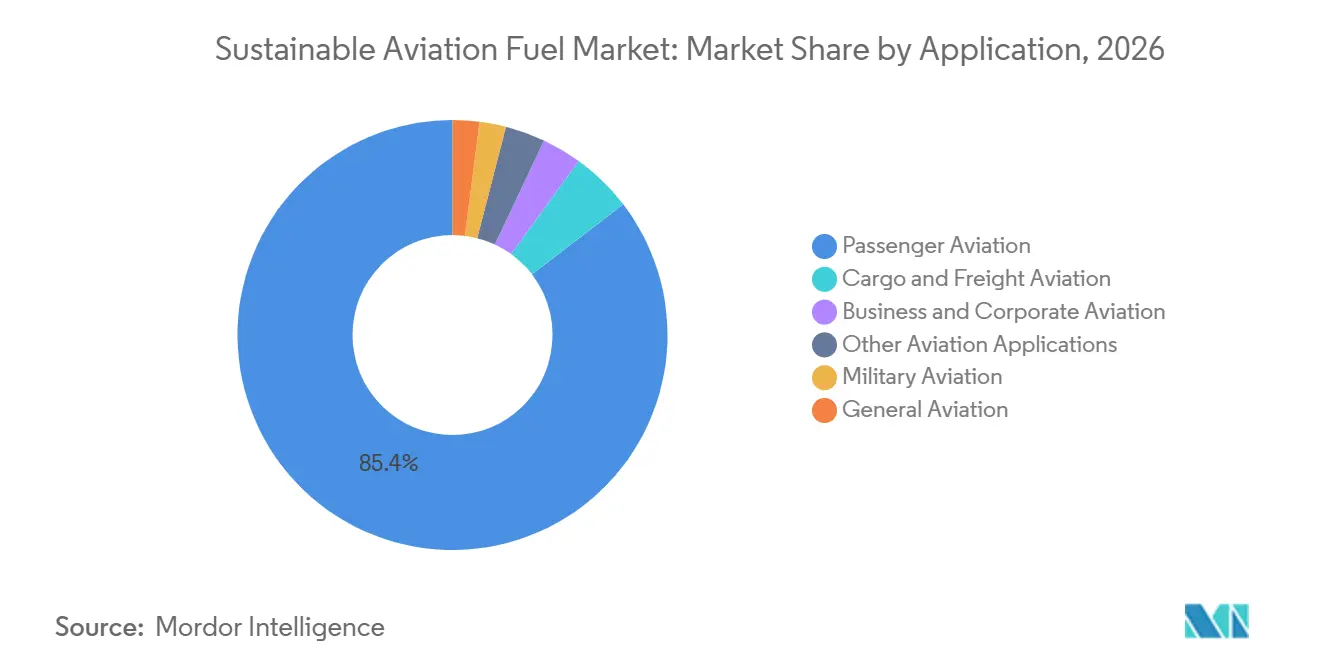
- By application, passenger aviation held 85.4% of the sustainable aviation fuel market share in 2026, while military aviation is forecast to expand at a 45.7% CAGR through 2032.
- By company capacity, Neste held 38% of global production capacity in 2026, while the 5 largest producers controlled 64% of supply.
- By geography, North America held 42.2% of revenue in 2026, while Asia-Pacific is projected to register a 51.2% CAGR through 2032.
Note: Market numbers in this report are based on Mordor Intelligence's proprietary estimation framework, which combines nine months of actuals with Q4 projections for base year 2026.
Market Trends and Insights
Drivers Impact Analysis of Sustainable Aviation Fuel Market*
| Driver | (~) % Impact on CAGR Forecast | Geographic Relevance | Impact Timeline |
|---|---|---|---|
| Binding SAF Blending Mandates and Carbon-Reduction Policies | +9.5% | Global, led by EU, UK, US, and Asia-Pacific | Short term (≤ 2 years) |
| Airline Net-Zero Commitments and Long-Term Offtake Agreements | +7.5% | Global, concentrated in North America and Europe | Short term (≤ 2 years) |
| Refinery Conversion and Brownfield Infrastructure Reuse | +5.5% | Europe, North America, and Asia-Pacific | Medium term (2-4 years) |
| Commercialization of Non-Lipid Pathways and Renewable Power-to-Liquid | +6.5% | EU, UK, US, Chile, and South Africa | Long term (≥ 4 years) |
| Corporate Travel, Cargo, and Defense Demand for Traceable SAF Certificates | +4.5% | Global, centered on North America and the EU | Medium term (2-4 years) |
| Airport Storage, Blending, and Book-and-Claim Network Expansion | +4% | North America, Europe, and Asia-Pacific | Medium term (2-4 years) |
| Source: Mordor Intelligence | |||
Binding Sustainable Aviation Fuel (SAF) Blending Mandates and Carbon-Reduction Policies
Binding blending obligations cover a growing share of global aviation fuel demand and give producers clearer demand floors. The UK Sustainable Aviation Fuel Act 2026 established revenue-certainty contracts that support producer income when fuel prices fall below the agreed level.[2] The mechanism is funded through a levy on aviation fuel suppliers and is intended to support investment in domestic production. Japan also moved toward mandatory blending for international departures from 7 major airports beginning in 2030, replacing a purely voluntary approach with a compliance-led framework. Demand certainty can improve the financing case for first-of-a-kind plants because lenders can assess future sales with more confidence. The resulting finance structure may reduce the cost burden that early projects otherwise carry alone.
Airline Net-Zero Commitments and Long-Term Offtake Agreements
Airlines are using longer supply agreements to secure fuel volumes and provide revenue visibility to developers. These contracts now extend well beyond the short procurement cycles that previously characterized the sustainable aviation fuel market. American Airlines and Google signed a 35-million-gallon sustainable aviation fuel certificate agreement in June 2026. The transaction showed that large corporate buyers can support decarbonization without receiving the physical fuel at their own locations. Book-and-claim systems allow the environmental attribute to be separated from the physical delivery route. This approach gives producers access to corporate demand alongside airline demand and can support broader buyer participation.
Commercialization of Non-Lipid Pathways and Renewable Power-to-Liquid
Non-lipid pathways are becoming more important because waste oils and fats cannot provide enough feedstock for long-term requirements. Power-to-liquid production combines captured carbon dioxide, water, and renewable electricity to make synthetic jet fuel. Germany approved EUR 350 million, equivalent to USD 385 million, in funding for the Brandenburg eSAF project at the PCK refinery in Schwedt.[3] The plant is planned to produce more than 30,000 tons of eSAF annually from 2030. It will use green hydrogen and biogenic carbon dioxide in a Fischer-Tropsch process. Standardized plant designs and larger renewable power systems are expected to matter more as these projects move from pilot scale to commercial operation.
Corporate Travel, Cargo, and Defense Demand for Traceable SAF Certificates
Corporate travel programs are adding another source of demand through sustainable aviation fuel certificates. A book-and-claim transaction lets a company claim the environmental benefit from fuel used elsewhere in the aviation network. This structure is particularly relevant for freight and business travel because physical fuel supply remains limited to selected airports. The Sustainable Aviation Buyers Alliance selected Infinium’s Project Atlas in April 2026 for its next-generation procurement program. Defense demand adds a separate case for new supply because governments value fuel security as well as emissions reduction. Civilian sales can improve the economics of facilities that also support strategic fuel needs.
Restraints Impact Analysis of Sustainable Aviation Fuel Market*
| Restraint | (~) % Impact on CAGR Forecast | Geographic Relevance | Impact Timeline |
|---|---|---|---|
| SAF Cost Premium Versus Fossil Jet Fuel | -4.5% | Global | Short term (≤ 2 years) |
| Sustainable Waste-Lipid Competition and Feedstock Certification Risk | -3% | Europe and Asia-Pacific, particularly China, Indonesia, and Malaysia | Medium term (2-4 years) |
| First-of-a-Kind Project Finance and Commissioning Delays | -2.5% | Global, particularly the EU and North America | Medium term (2-4 years) |
| Electrolyzer, Renewable-Power, Carbon-Capture, and Water Constraints for E-SAF | -2% | EU, UK, US, and emerging Middle East and Africa exposure | Long term (≥ 4 years) |
| Source: Mordor Intelligence | |||
SAF Cost Premium Versus Fossil Jet Fuel
Fuel cost remains the most immediate constraint on adoption across the sustainable aviation fuel market. The International Council on Clean Transportation estimated that 2024 production costs ranged from EUR 1,461 per ton for HEFA biofuels to EUR 7,695 per ton for synthetic e-fuels.[4] The same assessment placed fossil jet fuel at EUR 630 to EUR 800 per ton. IATA stated that airlines paid USD 2.9 billion in sustainable aviation fuel premiums in 2025. Higher fuel prices can place a greater burden on short-haul operators because their margins are often narrower and their ability to pass through costs is limited. Policy design therefore needs to address both demand creation and the pace of supply growth.
Sustainable Waste-Lipid Competition and Feedstock Certification Risk
The market’s dependence on HEFA makes reliable used cooking oil and waste-lipid supply essential. Limited certified feedstock can raise costs and constrain production even when refinery capacity is available. The draft identified an estimated 1.0 million to 1.5 million tons of certification-compliant used cooking oil supply each year, with a 2030 ceiling of 2.0 million tons. It also noted that used cooking oil (UCO) supply chains in China, Malaysia, and Indonesia face risks of mislabeling and difficult verification. China drafted stronger traceability standards in 2025 that would require batch-level logging and time-stamped checks. Tighter verification can improve supply integrity, but it may also reveal a smaller pool of qualifying feedstock. This is reinforcing interest in alcohol-to-jet, Fischer-Tropsch, and power-to-liquid pathways that use different raw materials.
*Our forecasts treat driver/restraint impacts as directional, not additive. The impact forecasts reflect baseline growth, mix effects, and variable interactions.
Sustainable Aviation Fuel Market Segment Analysis
By Fuel Type:
Bio-Based Fuel Leads While Power-to-Liquid Expands Future Supply OptionsBio-based fuel held 80.5% of sustainable aviation fuel market size in 2026. Its lead reflected the maturity of HEFA production and established collection networks for used cooking oil, tallow, and agricultural residues. These feedstocks can be processed into certified drop-in fuel that works with existing aircraft and fueling systems. Synthetic fuel pathways based on industrial waste gases were active but remained limited at commercial scale. Waste-based fuels made from municipal solid waste and agricultural residues were also in development. Their progress depends on reliable feedstock aggregation, conversion performance, and financing. Alcohol-to-jet offers another route because it converts ethanol into jet fuel. LanzaJet’s Freedom Pines Fuels plant in Georgia reached commercial operation in 2025 and demonstrated the pathway at scale. The company described planned capacity across the US, UK, Japan, and EU, which indicates the pathway’s wider commercial potential.
Power-to-liquid fuel is forecast to grow at a 47.5% CAGR through 2032, the highest rate among fuel types. It uses renewable electricity, water, and captured carbon dioxide rather than biomass inputs. This reduces exposure to the waste-oil supply limits that affect HEFA production. The sustainable aviation fuel market will need this pathway if fuel supply is to expand without relying only on lipid feedstocks. Twelve opened AirPlant One in Moses Lake, Washington, in June 2026 to produce E-Jet fuel from captured carbon dioxide, water, and renewable electricity. The facility’s airline and corporate agreements show how physical deliveries and certificate transactions can work together. Power-to-liquid projects still require large volumes of renewable power and electrolyzer capacity. They also require carbon dioxide supply and water resources at the same location or within an economic transport distance. These requirements make project siting and infrastructure planning central to future expansion.

By Blending Ratio:
Low Blends Remain Common While High Blends Gain SupportUp-to-10% blends held 62.1% of the sustainable aviation fuel market size in 2026. Airports generally used low blends because existing storage, blending, and distribution systems were built around conventional jet fuel. This approach allows airports to meet early requirements without major changes to their fuel operations. The 10% to 30% and 30% to 50% ranges were gaining importance at hubs with dedicated storage and controlled blending systems. Amsterdam Airport Schiphol had 12 segregated fuel tanks by 2025 and could support more than 100 daily sustainable aviation fuel refueling operations. The original draft identified 2.8 million barrels of capacity at the airport. Purpose-built midstream infrastructure is therefore becoming an important part of the sustainable aviation fuel market. Exolum invested GBP 4.5 million, equivalent to USD 5.7 million, in an independent blending facility at Redcliffe Bay in the UK. The investment formed part of a planned national pipeline network for sustainable aviation fuel.
Above-50% blends are forecast to expand at a 48.3% CAGR through 2032. Their growth depends on aircraft approval, reliable fuel specifications, and airport capability to manage higher-blend products. Demonstration flights have already shown that certain aircraft can operate on 100% sustainable aviation fuel. These trials provide operating evidence, although broader fleet use still depends on regulatory approvals. The European Union Aviation Safety Agency (EASA) is working toward broader approval for 100% sustainable aviation fuel use by 2030. Approval would remove the current 50% blending ceiling that applies to many certified pathways. The neat-fuel segment remained small in 2025 because the needed fuel volumes and approvals were not yet widely available. It remains important because it gives pure-pathway producers a larger potential outlet once certification progresses. Higher blends will also require airport operators to coordinate closely with refiners, airlines, and fuel distributors.
By Application:
Passenger Aviation Provides Volume While Military Demand AcceleratesPassenger aviation accounted for 85.4% of sustainable aviation fuel market share in 2026. The segment’s scale reflects the fuel requirements of scheduled passenger networks and airline climate commitments. Long-haul services use substantial fuel volumes and face greater exposure to carbon costs and international emissions rules. These conditions have encouraged airlines to sign multi-year offtake agreements. Delta Air Lines signed a 5-year agreement with Shell in 2025 for a minimum of 15 million gallons of sustainable aviation fuel in 2026. The agreement was intended to run through 2030. Cargo and freight aviation also support demand because logistics firms are responding to corporate emissions-reporting requirements. Book-and-claim arrangements allow shippers to support sustainable fuel even where physical deliveries are not available. Business and general aviation add smaller volumes but can help extend demand to regional airports.
Military aviation is projected to be the fastest-growing application, at a 45.7% CAGR through 2032. Demand in this segment is driven by energy security and operational resilience as well as emissions objectives. The US Department of Defense used 4.6 billion gallons of jet fuel annually in the draft’s cited estimate. This scale could support finance for early projects if procurement rules allow larger sustainable aviation fuel purchases. Norway completed a flight using an F-35 and a sustainable aviation fuel blend in 2025. The UK also operated F-35A aircraft on commercially available blends containing up to 50% renewable content. These operating examples indicate that military applications can use certified fuels within relevant specifications. Defense procurement may provide dependable anchor demand for projects that also serve commercial customers. The segment will still need clear technical standards, secure logistics, and funding structures suited to public procurement.
Geography Analysis
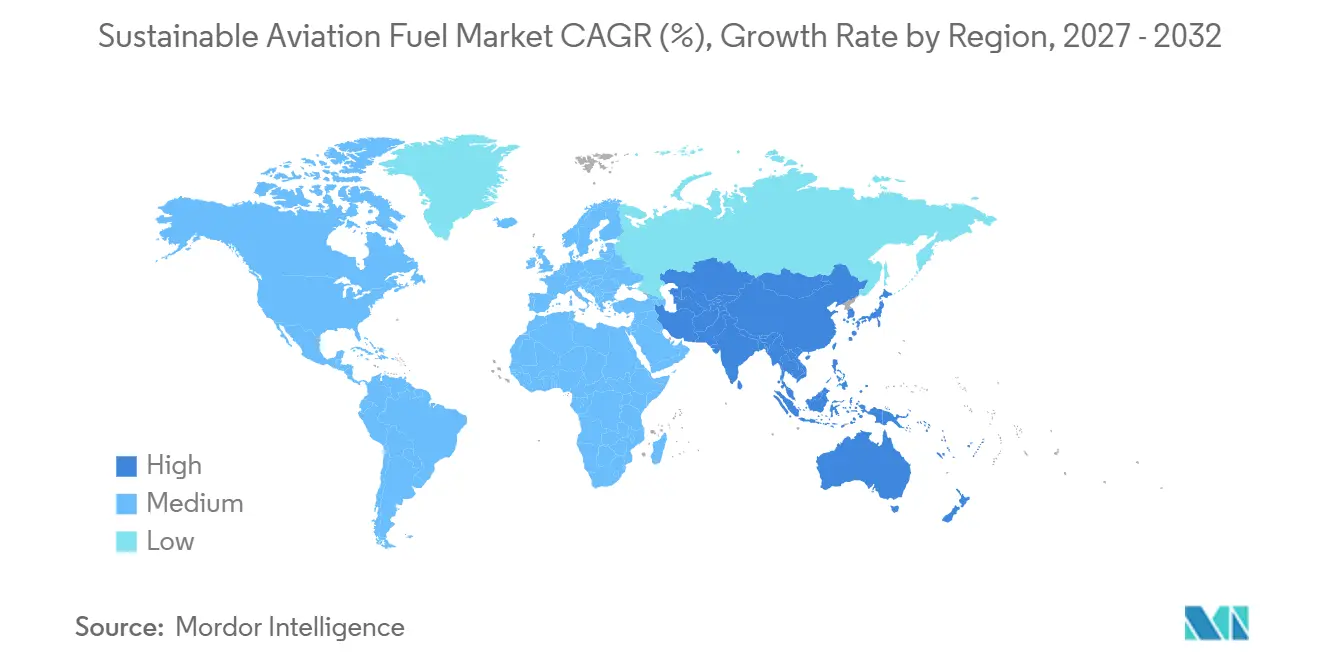
North America held 42.2% of the sustainable aviation fuel market size in 2026, making it the largest regional contributor. The region’s position was supported by blender tax credits, operational HEFA capacity, and existing aviation fuel infrastructure. The US Sustainable Aviation Fuel Grand Challenge targets 3 billion gallons of annual output by 2030. Sustainable aviation fuel was available at major hubs including Los Angeles, San Francisco, New York JFK, and Minneapolis-St. Paul. Minnesota’s Pine Bend refinery added a blending facility that can handle 30 million gallons of neat sustainable aviation fuel each year. This infrastructure reduces the need to build entirely new distribution systems for early volumes.
Europe’s sustainable aviation fuel market is shaped by the regulatory pull of ReFuelEU Aviation. Union airports received 1.1 million tons of sustainable aviation fuel across 121 airports in all 27 Member States during 2025. This was an increase from 33 airports in 2024 and showed that supply expanded beyond a small number of hubs. The 0.7% eSAF requirement for 2030 is supporting investment in synthetic fuel production. Germany, Luxembourg, and Austria launched a double-sided auction with EUR 2.1 billion, equivalent to USD 2.3 billion, of funding through the eSAF Early Movers Coalition. The regional pipeline includes HEFA, alcohol-to-jet, and eSAF projects, with France and Spain hosting many announced expansions. TotalEnergies began sustainable aviation fuel production at Grandpuits in 2025 with 230,000 tons per year of capacity. South America and Middle East and Africa are earlier in development, but agricultural resources, green hydrogen, and export demand create opportunities for future projects.
Asia-Pacific is projected to grow at a 51.2% CAGR through 2032, the highest regional rate in the sustainable aviation fuel market. The region is moving from voluntary goals toward binding measures in several countries. Singapore’s levy applies to departing flights from October 1, 2026, while South Korea mandates 1% blending from 2027. Japan has set a 10% usage target for 2030, and Indonesia has proposed 1% blending from 2027. Australia committed AUD 1.1 billion, equivalent to USD 720 million, to low-carbon liquid-fuel production incentives. Airbus and Cathay Group also announced an investment of up to USD 70 million in October 2025 to support regional supply. China’s initial output and work on used cooking oil traceability could support its position as a producer and potential exporter.
Competitive Landscape
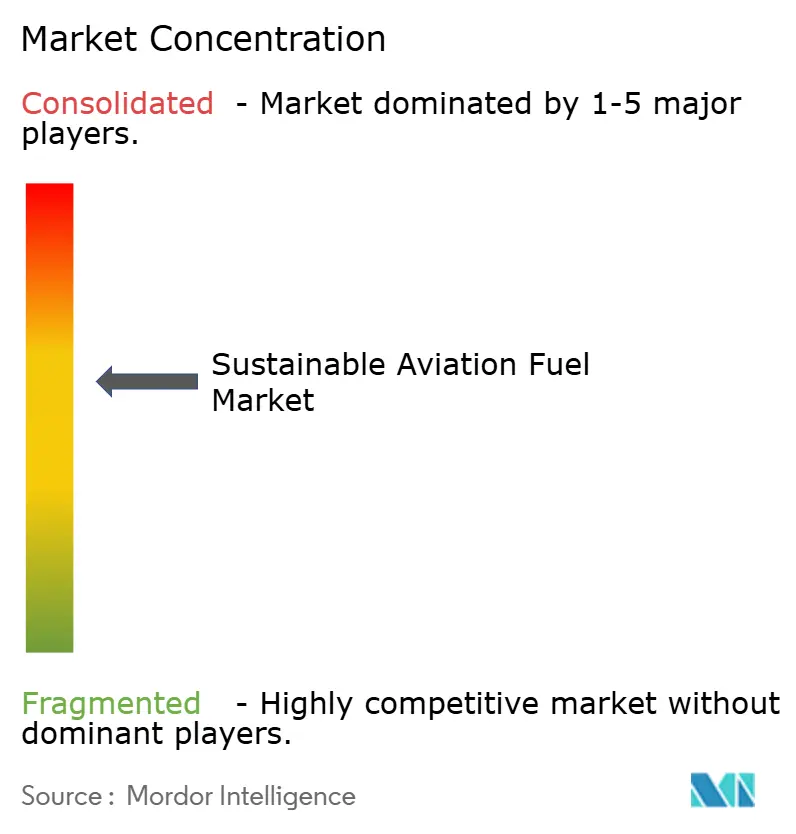
The sustainable aviation fuel market was moderately concentrated in 2026, although new pathways are expected to broaden the supplier base. Neste held 38% of global production capacity and operated facilities in Finland, Singapore, and the Netherlands. Its capacity was 1.5 million tons per year, with the Rotterdam expansion planned to raise total capacity to 2.2 million tons per year in 2027. The 5 largest producers, Neste, World Energy, TotalEnergies, BP, and Phillips 66, controlled 64% of supply. Their position was built largely on HEFA capacity and access to refining, feedstock, and airport distribution networks. This structure gives established suppliers an advantage in physical deliveries, but it also exposes them to pressure on waste-lipid inputs.
Oil and energy companies are increasingly using offtake arrangements with independent developers to gain exposure to new technologies. This approach lets them secure volumes without holding all construction and technology risk inside their own balance sheets. TotalEnergies began production at Grandpuits as part of a EUR 500 million, equivalent to USD 541 million, transformation of the refinery into a zero-oil platform. LanzaJet’s Freedom Pines facility reached commercial operation in 2025 and provided a commercial reference for alcohol-to-jet technology. In May 2026, LanzaTech selected North Sea Port in Ghent as the intended location for a commercial alcohol-to-jet facility under the FLITE consortium. These moves show that the competitive field increasingly includes technology developers as well as established refiners.
Technology ownership is becoming an important differentiator as the sustainable aviation fuel market moves beyond HEFA. Electrolyzers, gasification systems, carbon capture, hydrogen production, and fuel-upgrading processes can determine whether a project reaches reliable commercial output. Suppliers that can combine process technology with long-term offtake and feedstock access are better positioned to manage execution risk. Midstream services also represent an important competitive area, including blending hubs, certificate registries, and demand-aggregation platforms. The number of suppliers may rise as alcohol-to-jet and power-to-liquid facilities move into commercial service from 2027 onward. Existing leaders will retain advantages in scale and customer relationships, but diversification should limit the dominance of any single pathway.
Sustainable Aviation Fuel Industry Leaders
-
Neste Oyj
-
TotalEnergies SE
-
World Energy, LLC
-
Shell plc
-
BP p.l.c.
- *Disclaimer: Major Players sorted in no particular order
Sustainable Aviation Fuel Market Companies Covered in this Report
- Neste Oyj
- TotalEnergies SE
- World Energy, LLC
- Shell plc
- BP p.l.c.
- Eni S.p.A.
- OMV Aktiengesellschaft
- Phillips 66
- Gevo, Inc.
- LanzaJet, Inc.
- LanzaTech Global, Inc.
- SkyNRG B.V.
- Fulcrum BioEnergy, Inc.
- Aemetis, Inc.
- Velocys plc
- Topsoe A/S
- Honeywell International Inc.
- Chevron Corporation
- Alder Renewables Holdings, LLC
- HIF Global
- Twelve Benefit Corporation
- Virent, Inc.
- Air Company Holdings, Inc.
- Repsol, S.A.
- Moeve, S.A.
Recent Industry Developments in Sustainable Aviation Fuel Market
- September 2026: The European Union Aviation Safety Agency (EASA) published its ReFuelEU Aviation Annual Technical Report 2026, confirming that EU sustainable aviation fuel supply exceeded the 2025 mandate target.
- June 2026: American Airlines and Google signed a Sustainable Aviation Fuel certificate (SAFc) agreement covering 35 million gallons, or 132 million liters, of sustainable aviation fuel over 3 years, with estimated reductions of 300,000 metric tons of CO2e.
- May 2026: LanzaTech selected North Sea Port, Ghent, Belgium, as the site for Europe’s first commercial-scale alcohol-to-jet sustainable aviation fuel facility under the FLITE consortium.
- March 2026: The UK Sustainable Aviation Fuel Act 2026 received Royal Assent, establishing revenue-certainty contracts funded by a levy on aviation fuel suppliers.
Global Sustainable Aviation Fuel Market Report Scope
The Sustainable Aviation Fuel (SAF) market refers to the global economic sector dedicated to the production, distribution, commercialization, and blending of low-carbon, drop-in alternative fuels designed for use in commercial and military aircraft. SAF is a cleaner alternative to conventional, fossil-based kerosene jet fuel. It is produced from renewable and waste feedstocks, such as used cooking oil, municipal solid waste, agricultural residues, woody biomass, and captured CO2 mixed with green hydrogen (synthetic e-fuels).
The sustainable aviation fuel market report is segmented by fuel type into bio-based, synthetic or e-SAF, power-to-liquid, waste-based, and other categories. Based on the blending ratio, the market is divided into segments up to 10%, 10–30%, 30–50%, above 50%, and 100% neat SAF, while applications cover passenger, cargo, military, business, general. The report also covers the market size and forecasts for the global sustainable aviation fuel market across 26 countries in key regions. For each segment, the market sizing and forecasts have been provided on the basis of value (USD).
Segmentation Overview
| Bio-based SAF |
| Synthetic SAF / e-SAF |
| Power-to-Liquid SAF |
| Waste-based SAF |
| Other Sustainable Aviation Fuels |
| Up to 10% SAF Blend |
| 10–30% SAF Blend |
| 30–50% SAF Blend |
| Above 50% SAF Blend |
| 100% SAF / Neat SAF |
| Passenger Aviation |
| Cargo and Freight Aviation |
| Military Aviation |
| Business and Corporate Aviation |
| General Aviation |
| Other Aviation Applications |
| North America | United States |
| Canada | |
| Mexico | |
| Europe | Germany |
| France | |
| Italy | |
| Spain | |
| United Kingdom | |
| Poland | |
| Russia | |
| Rest of Europe | |
| Asia-Pacific | China |
| India | |
| Japan | |
| South Korea | |
| Australia | |
| Indonesia | |
| Vietnam | |
| Thailand | |
| Rest of Asia-Pacific | |
| South America | Brazil |
| Argentina | |
| Chile | |
| Rest of South America | |
| Middle East and Africa | Saudi Arabia |
| United Arab Emirates | |
| Egypt | |
| South Africa | |
| Morocco | |
| Rest of Middle East and Africa |
| By Fuel Type | Bio-based SAF | |
| Synthetic SAF / e-SAF | ||
| Power-to-Liquid SAF | ||
| Waste-based SAF | ||
| Other Sustainable Aviation Fuels | ||
| By Blending Ratio | Up to 10% SAF Blend | |
| 10–30% SAF Blend | ||
| 30–50% SAF Blend | ||
| Above 50% SAF Blend | ||
| 100% SAF / Neat SAF | ||
| By Application | Passenger Aviation | |
| Cargo and Freight Aviation | ||
| Military Aviation | ||
| Business and Corporate Aviation | ||
| General Aviation | ||
| Other Aviation Applications | ||
| By Geography | North America | United States |
| Canada | ||
| Mexico | ||
| Europe | Germany | |
| France | ||
| Italy | ||
| Spain | ||
| United Kingdom | ||
| Poland | ||
| Russia | ||
| Rest of Europe | ||
| Asia-Pacific | China | |
| India | ||
| Japan | ||
| South Korea | ||
| Australia | ||
| Indonesia | ||
| Vietnam | ||
| Thailand | ||
| Rest of Asia-Pacific | ||
| South America | Brazil | |
| Argentina | ||
| Chile | ||
| Rest of South America | ||
| Middle East and Africa | Saudi Arabia | |
| United Arab Emirates | ||
| Egypt | ||
| South Africa | ||
| Morocco | ||
| Rest of Middle East and Africa | ||
Key Questions Answered in the Report
What is the projected size of sustainable aviation fuel by 2032?
The sector is forecast to reach USD 24.27 billion by 2032, growing from USD 3.74 billion in 2027 at a 45.36% CAGR.
Which fuel type is growing fastest?
Power-to-liquid fuel is forecast to grow at a 47.5% CAGR through 2032 because it does not depend on biomass feedstocks.
Why is sustainable aviation fuel more expensive than conventional jet fuel?
Feedstock, renewable power, project financing, and early-stage plant costs keep production costs well above conventional jet fuel.
Which region leads global sustainable aviation fuel demand?
North America held 42.2% of revenue in 2026, supported by production capacity, incentives, and established airport fuel infrastructure.
Which region is expected to grow fastest through 2032?
Asia-Pacific is expected to grow at a 51.2% CAGR as governments introduce blending mandates and production incentives.
How concentrated is the supplier base?
The top 5 producers controlled 64% of supply in 2026, led by companies with established HEFA production and airport distribution access.