
Subsurface Utility Imaging Systems Market Size and Share
Market Overview
| Study Period | 2020 - 2031 |
|---|---|
| Market Size (2026) | USD 1.71 Billion |
| Market Size (2031) | USD 2.44 Billion |
| Growth Rate (2026 - 2031) | 7.37 % |
| Fastest Growing Market | Asia-Pacific |
| Largest Market | North America |
| Market Concentration | Medium |
Major Players *Disclaimer: Major Players sorted in no particular order Image © Mordor Intelligence. Reuse requires attribution under CC BY 4.0. | |
Subsurface Utility Imaging Systems Market Analysis by Mordor Intelligence
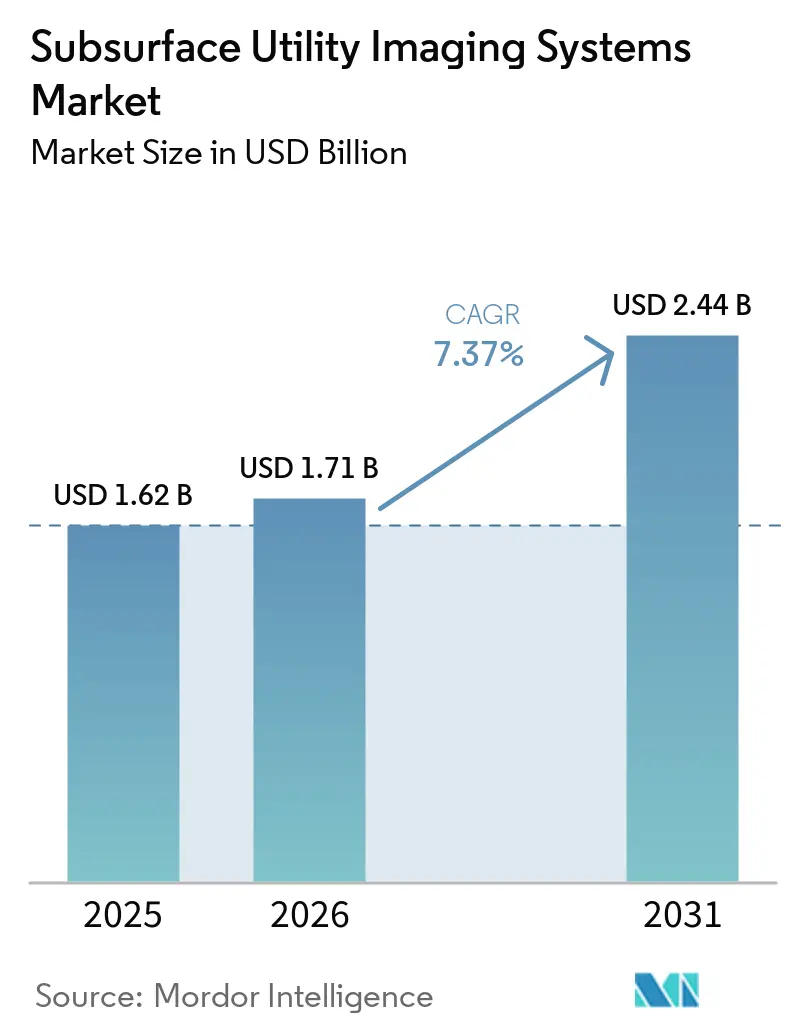
The Subsurface utility imaging systems market size was valued at USD 1.62 billion in 2025 and is estimated to reach USD 2.44 billion by 2031, at a CAGR of 7.37% during 2026-2031. Infrastructure renewal is increasing the need to identify aging water, sewer, and power assets before construction begins. Excavation-damage prevention rules are making accurate utility location a routine part of project planning. Digital records are also moving subsurface imaging beyond one-time pre-dig work and into long-term asset management. Sensor-fusion platforms can connect field findings with digital-twin and environmental, social, and governance programs. Vendors can therefore find opportunities in managed locate services, cloud-based records, and workflows that support defensible survey documentation.
Key Report Takeaways
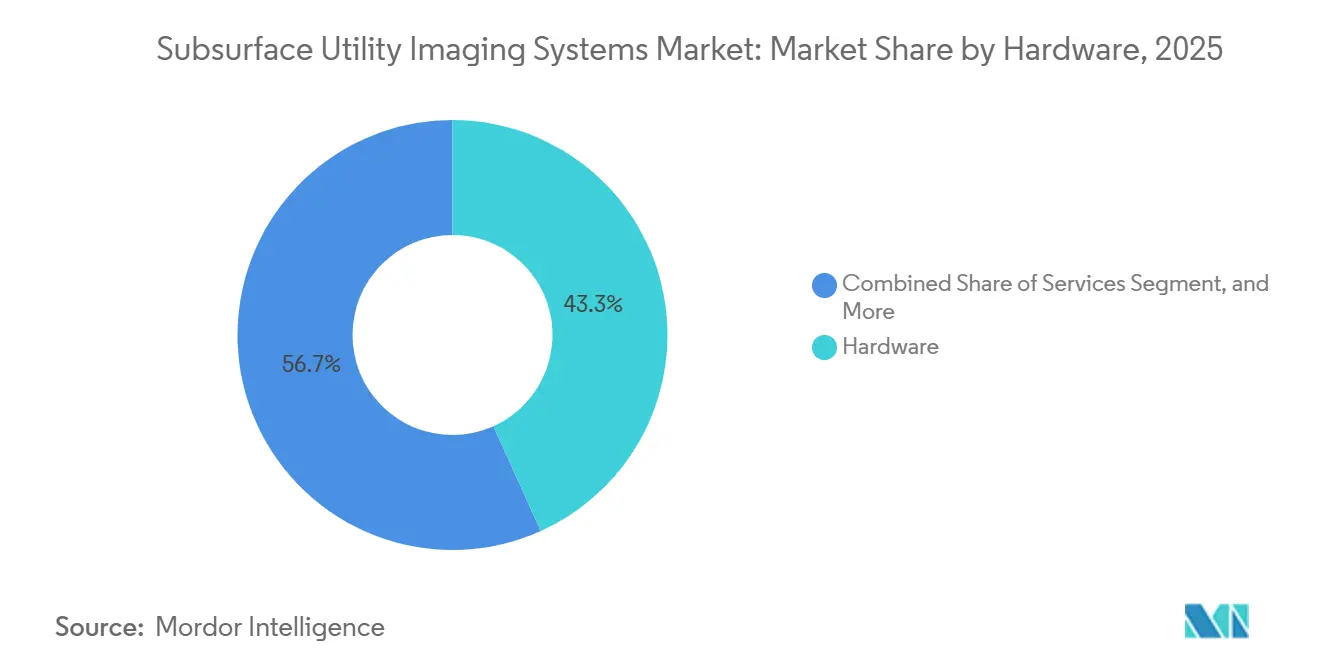
- By offering, hardware held 43.27% of the share of the Subsurface utility imaging systems market in 2025, while services are projected to expand at a 7.82% CAGR through 2031.
- By technology, ground-penetrating radar held 40.21% share in 2025, while multi-sensor and integrated detection platforms are projected to expand at a 7.91% CAGR through 2031.
- By utility type, electric power and transmission utilities held 26.43% share in 2025, while telecommunications and fiber optics are projected to expand at a 7.64% CAGR through 2031.
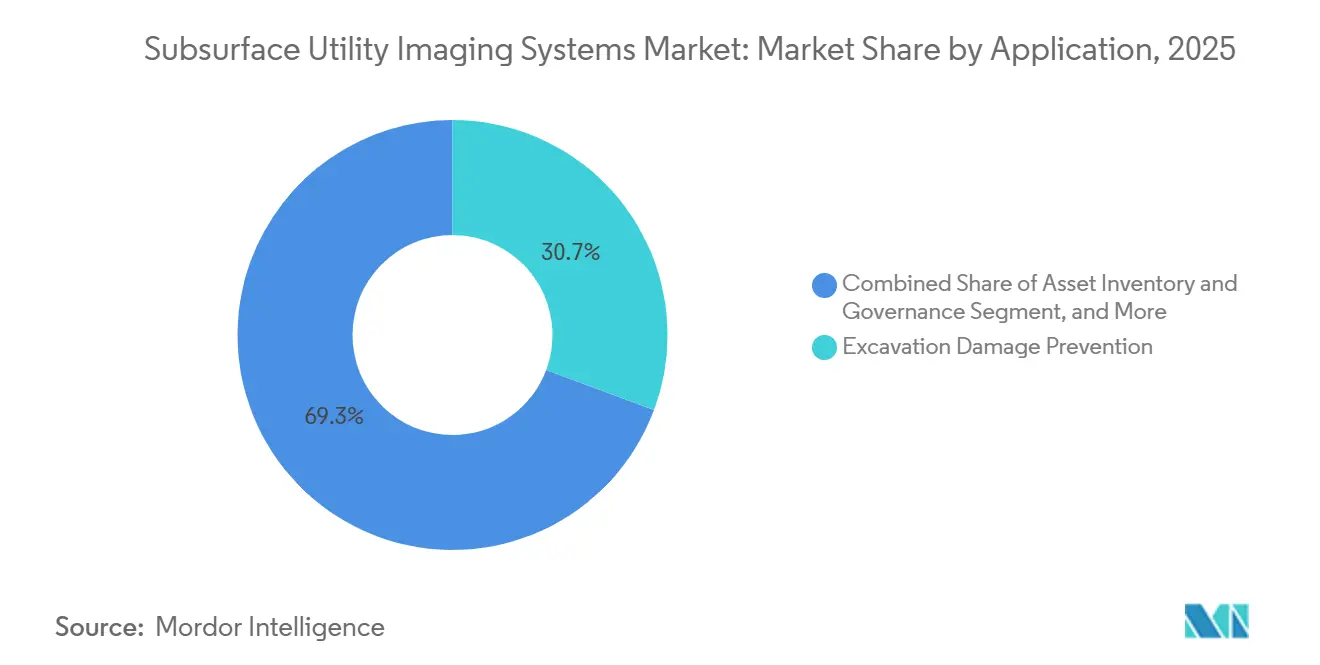
- By application, excavation damage prevention held 30.67% share in 2025, while asset inventory and governance are projected to expand at a 7.88% CAGR through 2031.
- By end-user industry, engineering and construction firms held 28.53% share in 2025, while transportation and infrastructure operators are projected to expand at an 8.14% CAGR through 2031.
- By geography, North America held 33.92% share in 2025, while Asia-Pacific is projected to expand at an 8.21% CAGR through 2031.
Note: Market size and forecast figures in this report are generated using Mordor Intelligence’s proprietary estimation framework, updated with the latest available data and insights as of January 2026.
Global Subsurface Utility Imaging Systems Market Trends and Insights
Drivers Impact Analysis*
| Driver | (~) % Impact on CAGR Forecast | Geographic Relevance | Impact Timeline |
|---|---|---|---|
| Infrastructure Renewal and Excavation-Damage Prevention | +2.3% | Global, concentrated in North America and Western Europe | Short term (≤ 2 years) |
| Fiber-Optic and 5G Network Expansion | +1.6% | Global, with highest intensity in Asia-Pacific, North America, and Western Europe | Short term (≤ 2 years) |
| Smart-City and Digital-Twin Deployment | +1.3% | Asia-Pacific core, with expansion into Europe and the Middle East | Medium term (2-4 years) |
| Energy Transition and Grid Undergrounding | 1.0% | North America and Western Europe, with early gains in Saudi Arabia and the UAE | Medium term (2-4 years) |
| AI-Assisted Sensor Fusion and Automated Interpretation | 0.8% | Global, led by North America, Europe, and Asia-Pacific | Medium term (2-4 years) |
| Insurance and Contractor Liability Pressure for Defensible Subsurface Records | 0.6% | North America and the United Kingdom, with emerging uptake in the European Union | Short term (≤ 2 years) |
| Source: Mordor Intelligence | |||
Infrastructure Renewal and Excavation-Damage Prevention
The replacement of water mains, sewer lines, and power conduits installed from the 1950s through the 1980s is creating a durable demand base for the Subsurface utility imaging systems market. This work does not follow new construction starts as closely as greenfield survey volumes do. PHMSA stated in its April 2026 advisory that excavation damage caused 39.3% of incidents in its pipeline database. The advisory directed operators to reinforce Common Ground Alliance locating, marking, and excavation practices during a period of major infrastructure activity. Aging corridors can concentrate risk within specific urban areas, which supports targeted high-density surveys instead of broad locate programs. This requirement favors quality-level B and A work that confirms utility positions under ASCE/UESI/CI 38-22 standards.[1]U.S. Department of Transportation, Pipeline and Hazardous Materials Safety Administration, “Pipeline Safety: Advisory Bulletin on Preventing Excavation Damage During National Safe Digging Month and Beyond,” Federal Register, phmsa.dot.gov.
Fiber-Optic and 5G Network Expansion
Fiber construction can create a pre-construction clearance survey and a post-installation as-built capture for each kilometer installed. This sequence makes demand for the Subsurface utility imaging systems market more persistent than network mileage alone would suggest. Underground fiber installation costs USD 16 per foot in North America during 2025, compared with USD 6.50 per foot for aerial installation. An incorrectly identified utility can therefore create a significant project cost rather than only a safety concern. The Fiber Broadband Association identified accurate subsurface data as a core risk-control step in fielding, base mapping, and permitting workflows. Telecom operators and municipal broadband authorities are increasingly including survey requirements in right-of-way conditions.[2]Fiber Broadband Association, “Building Better Broadband: Accelerating Design and Securing Permit Approvals,” Fiber Broadband Association, fiberbroadband.org.
Smart-City and Digital-Twin Deployment
City digital twins need reliable underground information when agencies plan, maintain, and manage risk across dense infrastructure networks. This need is positioning the Subsurface utility imaging systems market as a source of long-lived data rather than a project-only survey service. Seoul's S-Map program modeled more than 48,000 km of buried pipes, conduits, and cables across a 605 km² area. It used cross-referenced ground-penetrating radar surveys at 2,400 sample points. Genoa completed a surface and subsurface digital-twin pilot in November 2025 using high-precision surveying and georadar data in high-risk hydrogeological areas. New York City also announced a USD 10 million program in November 2025 for a 3D underground map, supported by a multiyear USD 1.2 million research program.[3]Seoul Vision 2030, “S-Map Digital Twin,” Seoul Metropolitan Government, seoulvision2030.com.
Energy Transition and Grid Undergrounding
Grid undergrounding is adding demand for corridor-wide clearance surveys before trenching and as-built records after installation. The Subsurface utility imaging systems market benefits when wildfire prevention, weather resilience, and renewable integration turn undergrounding into planned capital work. Pacific Gas and Electric had constructed and energized extensive underground power lines by November 2024. Its 2026-2028 wildfire mitigation plan included further underground line installations. Germany is also directing climate adaptation funding toward grid undergrounding and water-network renewal. Saudi Arabia and the UAE are supporting similar activity through smart-grid and data-center interconnect programs.
Restraints Impact Analysis*
| Restraint | (~) % Impact on CAGR Forecast | Geographic Relevance | Impact Timeline |
|---|---|---|---|
| High Equipment and Maintenance Costs | -1.1% | Emerging markets in Asia-Pacific, Africa, and South America, and municipal sectors globally | Short term (≤ 2 years) |
| Shortage of Certified Utility-Imaging Professionals | -0.8% | Global, most acute in North America and Western Europe | Short term (≤ 2 years) |
| Urban Radio-Frequency Interference and Challenging Ground Conditions | -0.5% | Dense urban cores globally, particularly historical city centers | Medium term (2-4 years) |
| Fragmented Data Ownership and Utility Record Standards | -0.3% | Global, particularly markets without national utility registers | Long term (≥ 4 years) |
| Source: Mordor Intelligence | |||
High Equipment and Maintenance Costs
Configured field units that combine ground-penetrating radar, sensor-fusion tools, and survey-grade GNSS require substantial upfront investment. These costs limit access to the Subsurface Utility Imaging Systems Market for smaller contractors and municipal agencies, especially in lower-income markets. Managed locate providers also need to spread this investment across uneven project pipelines. Software subscriptions for interpretation and cloud records add recurring costs to the initial hardware purchase. Equipment-as-a-service contracts can combine hardware, software, calibration, and support within long-term agreements. Adoption remains strongest where framework agreements and long-term service contracts are already established.
Shortage of Certified Utility-Imaging Professionals
Ground-penetrating radar interpretation requires specialist training that is not standardized consistently across jurisdictions. The shortage can restrict the Subsurface utility imaging systems market, even where clients have funding and equipment is available. Common Ground Alliance practices and ASCE 38-22 provide quality classifications, but no single global certification exists for utility-imaging technicians. Variable service standards can increase contractor liability and reduce client confidence in data quality. A 2025 peer-reviewed review found that soil variability, different acquisition methods, and urban signal clutter still require experienced human judgment. Vendors with formal training, remote review, and managed interpretation services can address this operational constraint.
*Our forecasts treat driver/restraint impacts as directional, not additive. The impact forecasts reflect baseline growth, mix effects, and variable interactions.
Segment Analysis
By Offering: Services Gain Ground Against Hardware's Current Lead
Hardware held 43.27% of the share of the Subsurface utility imaging systems market in 2025. Ground-penetrating radar arrays, electromagnetic locators, acoustic tools, and multi-sensor platforms require substantial capital investment. These tools remain central to field detection campaigns. Hardware purchases are generally tied to equipment budgets and discrete replacement cycles. That purchasing pattern can make hardware revenue uneven across project periods.
Services are projected to expand at a 7.82% CAGR from 2026 to 2031. Utility owners and engineering firms are increasingly outsourcing locate workflows instead of operating equipment internally. Per-survey pricing can provide a clearer cost structure and access to specialist interpretation. Software connects field acquisition with digital-record delivery through cloud interpretation, GIS-linked asset tools, and BIM modules. A 2026 case study showed that combined UAV photogrammetry, laser scanning, and ground-penetrating radar can support cloud-based service delivery aligned with recognized quality standards.



By Technology: Integrated Detection Broadens Survey Coverage
Ground-penetrating radar held 40.21% of the share of the Subsurface utility imaging systems market in 2025. It can identify metallic and non-metallic utilities during a single traverse. This capability is important as polyethylene and PVC pipes replace many metallic lines in new installations. Electromagnetic and radio-frequency locators remain widely used for metallic lines because they cost less and have a simpler operating process. Their limits are more evident when clients need broad utility coverage.
Multi-sensor and integrated detection platforms are projected to expand at a 7.91% CAGR from 2026 to 2031. These systems combine ground-penetrating radar and electromagnetic methods on cart, vehicle, or drone platforms. The combination can identify more utility types during a single field visit. Research published in 2026 found that dense urban settings require sensor fusion, physics-guided learning, and uncertainty-aware interpretation for utility-level analysis. Acoustic and ultrasonic systems remain relevant for pipe leak work, while ferromagnetic systems and traceable rodders support specialized tracing tasks.
By Utility Type: Fiber Deployment Raises Telecom Survey Demand
Electric power and transmission utilities held 26.43% of the share of the Subsurface utility imaging systems market in 2025. Dense power networks create substantial survey requirements in both new projects and renewal work. Grid hardening and undergrounding programs also require accurate corridor information before construction. The high consequence of service disruption keeps utility location important for power projects. This base supports continued demand across the Subsurface utility imaging systems market for detection and documentation tools.
Telecommunications and fiber optics are projected to expand at a 7.64% CAGR from 2026 to 2031. Fiber-to-the-premises and 5G programs require clearance before construction and as-built documentation afterward. Drinking water and sewer networks also offer resilient demand because many older systems lack precise digital pipe records. SebaKMT reported in June 2026 that this gap remains relevant for water operators and can be addressed through acoustic detection and ground-penetrating radar surveys. Gas and oil pipelines require high-value quality-level A surveys because a strike can have severe safety and liability consequences.
By Application: Asset Records Extend Client Engagements
Excavation damage prevention held 30.67% of the share of the Subsurface utility imaging systems market in 2025. One Call requirements, PHMSA enforcement, and insurer documentation need support for this application. Pre-dig surveys are a contractual requirement in many regulated locations. Engineering teams also use imaging during design to identify utility conflicts before field work begins. This can limit disruptions and remediation expenses during capital delivery.
Asset inventory and governance are projected to expand at a 7.88% CAGR from 2026 to 2031. The application is shifting demand from single-project surveys toward continuously updated subsurface records. These records can support multiyear data maintenance arrangements between providers and clients. Directional drilling and cross-bore prevention require high-certainty methods because failure can create serious safety and remediation exposure. Environmental due diligence and underground storage tank detection remain smaller applications, supported by compliance work at legacy industrial and commercial sites.
By End-User Industry: Transportation Programs Support Faster Adoption
Engineering and construction firms held 28.53% of the share of the Subsurface utility imaging systems market in 2025. These firms often include survey costs during pre-bid project scoping. Their demand is linked to project volume and the complexity of each site's underground conditions. Utility providers and telecommunications firms provide recurring work through maintenance and network expansion. Oil and gas operators add lower-volume but high-value requirements.
Transportation and infrastructure operators are projected to expand at an 8.14% CAGR from 2026 to 2031. Highway and rail programs require wide-area clearance work across rights-of-way. Transit agencies are also incorporating underground utility models into BIM workflows. In August 2026, the Oklahoma Department of Transportation adopted ProStar's PointMan platform for utility management across state rights-of-way. Government agencies and environmental and geotechnical service providers also create demand during smart-city and brownfield remediation programs.
Geography Analysis
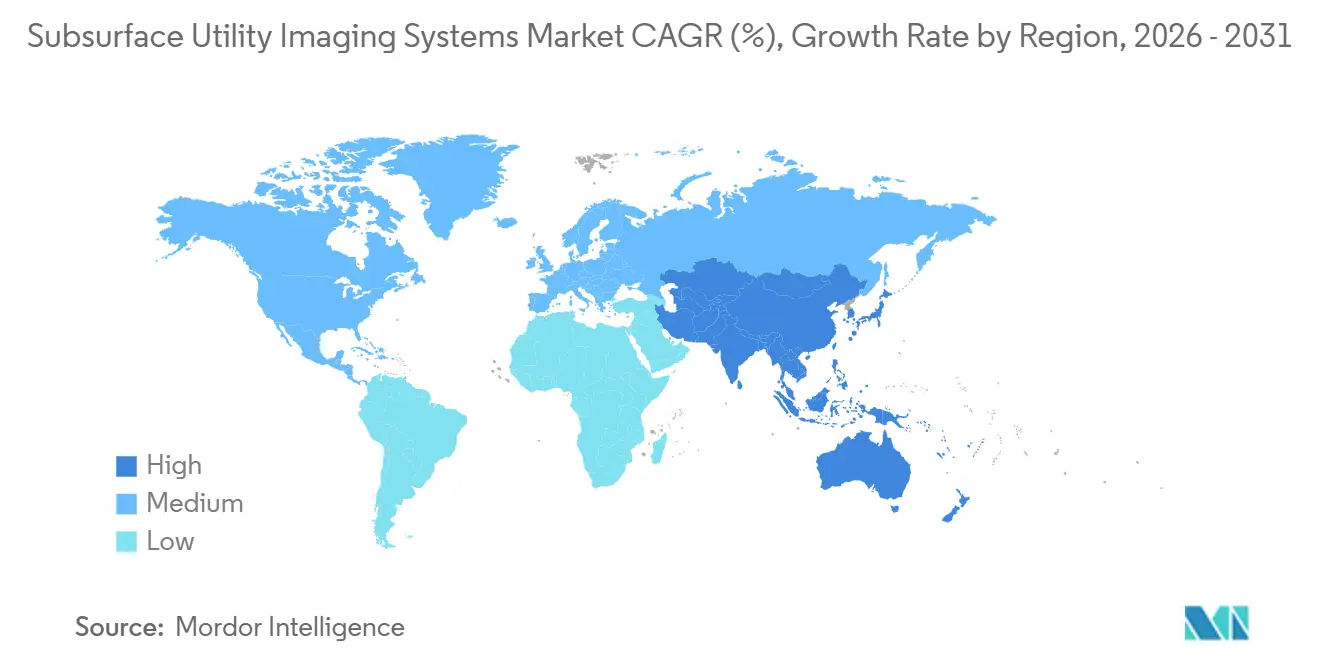
North America held 33.92% share of the Subsurface utility imaging systems market in 2025. Mature regulation, dense underground networks, and sustained renewal and construction investment support this position. The United States uses One Call and 811 requirements with PHMSA enforcement under 49 CFR Part 196, creating a baseline need for verification before excavation. Infrastructure work on roads, bridges, utilities, and broadband is raising survey volumes in congested corridors. Canada is updating locate-quality practices through provincial notification systems and urban renewal programs, while Mexico is developing demand through energy reform execution and highway expansion.
Asia-Pacific is projected to expand at an 8.21% CAGR from 2026 to 2031. Metro construction in China requires clearance before tunnel boring, and India's National Infrastructure Pipeline is creating Subsurface utility imaging systems market requirements across highways, smart cities, and energy grids. South Korea's S-Map demonstrates how metropolitan authorities can develop usable subsurface digital twins. Singapore's Digital Underground project is considering governance for continuous data ingestion. Japan's aging pipes and seismic resilience work, together with Australia's damage-prevention rules and infrastructure pipeline, support ongoing activity.
Europe, the Middle East, and Africa present varied conditions for the Subsurface utility imaging systems market. Germany and France are directing climate adaptation funding toward grid undergrounding and water renewal, while German water systems often need inspection because older urban networks lack reliable digital records. The United Kingdom's National Underground Asset Register exceeded 3 million km after Openreach contributed 550,000 km of network data in late 2025. Saudi Arabia's NEOM projects and Vision 2030 plans, together with early adoption in South Africa, Nigeria, Brazil, and Argentina, are strengthening demand for professional locating practices.

Competitive Landscape
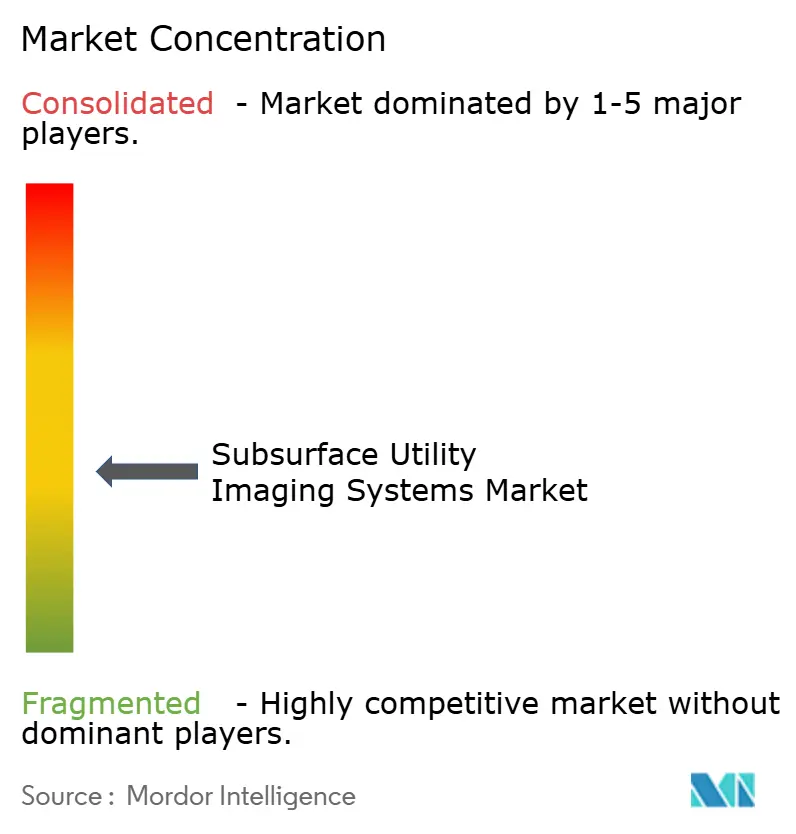
The Subsurface utility imaging systems market is moderately fragmented. Hexagon AB, through IDS GeoRadar, Leica Geosystems, and Xwatch Safety Solutions, has broad detection and spatial workflow coverage, while GSSI, Radiodetection, and Trimble also hold broad portfolios. No provider holds a dominant share, and the top 4 vendors collectively held a mid-30% share. Regional specialists compete through focused technology packages and local regulatory knowledge.
Competition in the Subsurface utility imaging systems market spans hardware, software, and service delivery. Hardware providers compete on sensor performance and integration, while software suppliers focus on durable records and open-standard interoperability. Service providers differentiate through local coverage and certified technician capacity. In March 2026, Topcon and GSSI announced a collaboration that paired GSSI ground-penetrating radar with Topcon's HiPer XR GNSS receiver and Collage Web software. The workflow connects detection data with precise spatial context from field collection through analysis.
Trimble also announced the integration of GSSI's PaveScan RS sensor with its Roadworks paving control platform in 2026. This places ground-penetrating radar within a wider construction-management workflow. Bentley Systems and ProStar Holdings compete for enterprise utility-record work through digital modeling, data schemas, and precision mapping. Hexagon's AiMaps platform applies cloud-based deep-learning utility tomography through HxDR infrastructure. PHMSA rules and ASCE 38-22 documentation requirements can increase pressure on smaller locators that cannot provide audit-ready records.
Subsurface Utility Imaging Systems Industry Leaders
Hexagon AB
Leica Geosystems AG
Geophysical Survey Systems, Inc.
Radiodetection Ltd.
Vivax-Metrotech Corp.
- *Disclaimer: Major Players sorted in no particular order



Global Subsurface Utility Imaging Systems Market Report Scope
Subsurface Utility Imaging Systems Market refers to technologies and services that detect, locate, and map buried utilities (water, gas, electric, telecom, sewer, storm) and other underground infrastructure using non-destructive geophysical and imaging methods. The market includes ground-penetrating radar (GPR) systems, electromagnetic locators, multi-sensor utility carts, 3D GPR arrays, sonar for submerged lines, and supporting software for data fusion, GIS integration, and deliverables aligned with Subsurface Utility Engineering (SUE) quality levels.
The Subsurface Utility Imaging Systems Market Report is Segmented by Offering (Hardware, Software, and Services), Technology (Electromagnetic and Radio-Frequency Location, Ground-Penetrating Radar, Acoustic and Ultrasonic Detection, Ferromagnetic and Traceable Rodder Systems, Multi-Sensor and Integrated Detection Platforms, and Other Technologies), Utility Type (Electric Power and Transmission, Telecommunications and Fiber Optics, Drinking Water and Sewer Networks, Gas and Oil Pipelines, Stormwater, Drainage, and Irrigation, and District Heating, Cooling, and Industrial Utilities), Application (Excavation Damage Prevention, Utility Conflict Mitigation and Design, Asset Inventory and Governance, Capital Project Delivery, Directional Drilling and Cross-Bore Prevention, Environmental Due Diligence and UST Detection, and Other Applications), End-User Industry (Engineering and Construction Firms, Utility Providers, Oil and Gas, Telecommunications, Government and Municipal Agencies, Transportation and Infrastructure, Operators, Industrial and Commercial Asset Owners, Environmental and Geotechnical Service Providers, and Other End-User Industries), and Geography (North America, South America, Europe, Asia-Pacific, Middle East, and Africa). The Market Forecasts are Provided in Terms of Value (USD).
| Hardware |
| Software |
| Services |
| Electromagnetic and Radio-Frequency Location |
| Ground-Penetrating Radar |
| Acoustic and Ultrasonic Detection |
| Ferromagnetic and Traceable Rodder Systems |
| Multi-Sensor and Integrated Detection Platforms |
| Other Technologies |
| Electric Power and Transmission |
| Telecommunications and Fiber Optics |
| Drinking Water and Sewer Networks |
| Gas and Oil Pipelines |
| Stormwater, Drainage, and Irrigation |
| District Heating, Cooling, and Industrial Utilities |
| Excavation Damage Prevention |
| Utility Conflict Mitigation and Design |
| Asset Inventory and Governance |
| Capital Project Delivery |
| Directional Drilling and Cross-Bore Prevention |
| Environmental Due Diligence and UST Detection |
| Other Applications |
| Engineering and Construction Firms |
| Utility Providers |
| Oil and Gas |
| Telecommunications |
| Government and Municipal Agencies |
| Transportation and Infrastructure Operators |
| Industrial and Commercial Asset Owners |
| Environmental and Geotechnical Service Providers |
| Other End-User Industries |
| North America | United States |
| Canada | |
| Mexico | |
| South America | Brazil |
| Argentina | |
| Rest of South America | |
| Europe | Germany |
| United Kingdom | |
| France | |
| Italy | |
| Spain | |
| Rest of Europe | |
| Asia-Pacific | China |
| Japan | |
| India | |
| South Korea | |
| ASEAN | |
| Rest of Asia-Pacific | |
| Middle East | Saudi Arabia |
| United Arab Emirates | |
| Turkey | |
| Rest of the Middle East | |
| Africa | South Africa |
| Nigeria | |
| Rest of Africa |
| By Offering | Hardware | |
| Software | ||
| Services | ||
| By Technology | Electromagnetic and Radio-Frequency Location | |
| Ground-Penetrating Radar | ||
| Acoustic and Ultrasonic Detection | ||
| Ferromagnetic and Traceable Rodder Systems | ||
| Multi-Sensor and Integrated Detection Platforms | ||
| Other Technologies | ||
| By Utility Type | Electric Power and Transmission | |
| Telecommunications and Fiber Optics | ||
| Drinking Water and Sewer Networks | ||
| Gas and Oil Pipelines | ||
| Stormwater, Drainage, and Irrigation | ||
| District Heating, Cooling, and Industrial Utilities | ||
| By Application | Excavation Damage Prevention | |
| Utility Conflict Mitigation and Design | ||
| Asset Inventory and Governance | ||
| Capital Project Delivery | ||
| Directional Drilling and Cross-Bore Prevention | ||
| Environmental Due Diligence and UST Detection | ||
| Other Applications | ||
| By End-User Industry | Engineering and Construction Firms | |
| Utility Providers | ||
| Oil and Gas | ||
| Telecommunications | ||
| Government and Municipal Agencies | ||
| Transportation and Infrastructure Operators | ||
| Industrial and Commercial Asset Owners | ||
| Environmental and Geotechnical Service Providers | ||
| Other End-User Industries | ||
| By Geography | North America | United States |
| Canada | ||
| Mexico | ||
| South America | Brazil | |
| Argentina | ||
| Rest of South America | ||
| Europe | Germany | |
| United Kingdom | ||
| France | ||
| Italy | ||
| Spain | ||
| Rest of Europe | ||
| Asia-Pacific | China | |
| Japan | ||
| India | ||
| South Korea | ||
| ASEAN | ||
| Rest of Asia-Pacific | ||
| Middle East | Saudi Arabia | |
| United Arab Emirates | ||
| Turkey | ||
| Rest of the Middle East | ||
| Africa | South Africa | |
| Nigeria | ||
| Rest of Africa | ||


Key Questions Answered in the Report
What is the Subsurface utility imaging systems market size?
The Subsurface utility imaging systems market size was USD 1.62 billion in 2025 and is forecast to reach USD 2.44 billion by 2031 at a 7.37% CAGR during 2026-2031.
What is driving demand for subsurface utility imaging systems?
Infrastructure renewal, excavation-damage prevention, fiber deployment, digital twins, and grid undergrounding are increasing demand in the Subsurface utility imaging systems market for reliable underground asset information.
Which offering type leads spending on subsurface utility imaging systems?
Hardware held 43.27% share in 2025, reflecting the investment needed for radar arrays, locators, and multi-sensor field platforms.
Which technology has the largest role in utility imaging?
Ground-penetrating radar held 40.21% share in 2025 because it can identify metallic and non-metallic utilities in one survey pass.
Which region is advancing most quickly in utility imaging?
Asia-Pacific is projected to expand at an 8.21% CAGR through 2031, supported by rail, highway, fiber, and smart-city activity.
Why are managed locate services gaining adoption?
Services are projected to expand at a 7.82% CAGR through 2031 as clients seek specialist interpretation and predictable per-survey costs without owning equipment.
Page last updated on:





