
Substation Market Size and Share
Market Overview
| Study Period | 2022 - 2032 |
|---|---|
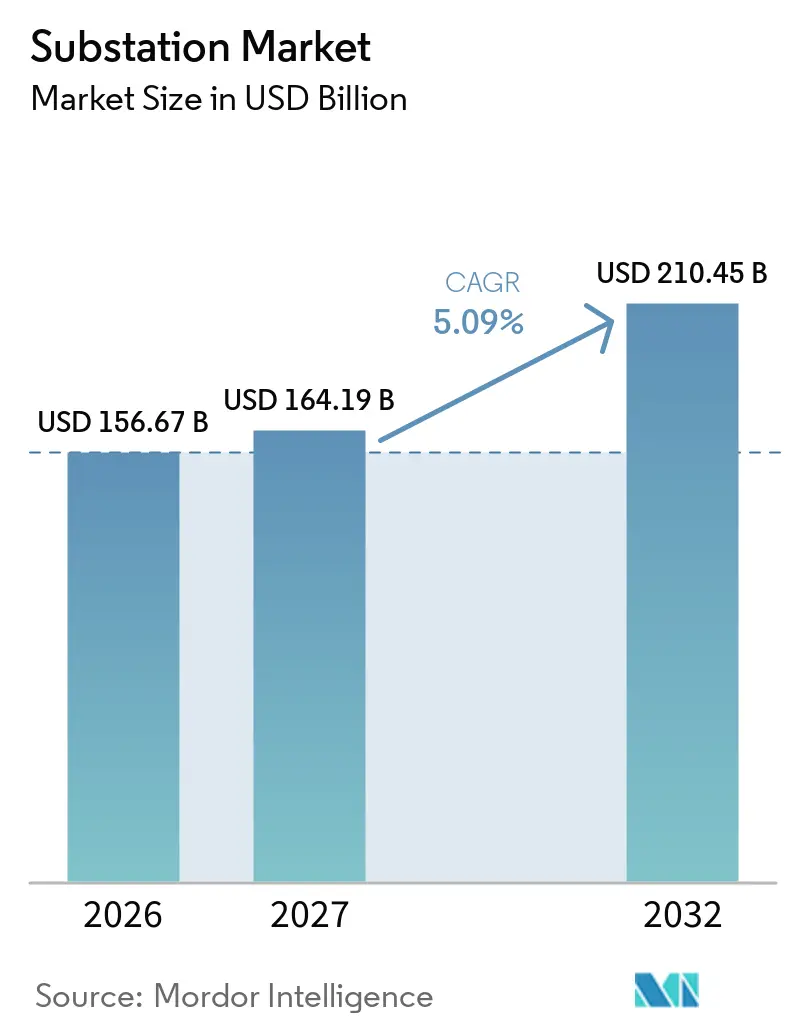
| Market Size (2027) | USD 164.19 Billion |
| Market Size (2032) | USD 210.45 Billion |
| Growth Rate (2027 - 2032) | 5.09 % |
| Fastest Growing Market | Middle East and Africa |
| Largest Market | Asia-Pacific |
| Market Concentration | Medium |
Major Players *Disclaimer: Major Players sorted in no particular order Image © Mordor Intelligence. Reuse requires attribution under CC BY 4.0. | |
Substation Market Analysis by Mordor Intelligence
The Substation Market size was valued at USD 156.67 billion in 2026 and is estimated to grow from USD 164.19 billion in 2027 to reach USD 210.45 billion by 2032, at a CAGR of 5.09% during the forecast period (2027-2032). Grid renewal, renewable generation connections, and large data-center loads are expanding the need for new electrical substations market assets and equipment. Utilities face a larger scope of work because aging assets often need complete substation reconstruction instead of isolated equipment replacement. Long transformer lead times and limited manufacturing capacity make delivery reliability an important factor in electrical substations market procurement. The electrical substations market also benefits from higher demand for automation, gas-insulated designs, and high-voltage systems where land, network resilience, or renewable integration require them.
Key Report Takeaways
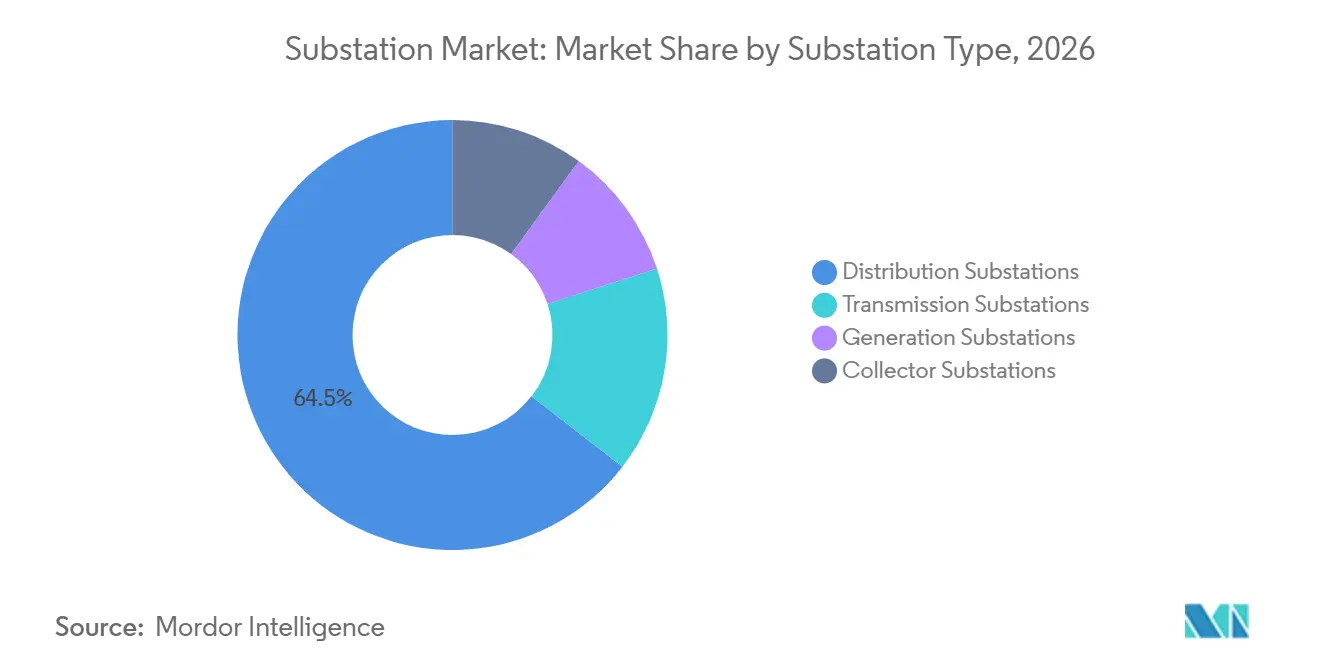
- By substation type, distribution substations held 64.5% of the electrical substations market share in 2026, while collector substations are projected to grow at a 5.9% CAGR through 2032.
- By technology, air-insulated substations held 53.1% of the electrical substations market share in 2026, while gas-insulated substations are projected to grow at an 8.1% CAGR through 2032.
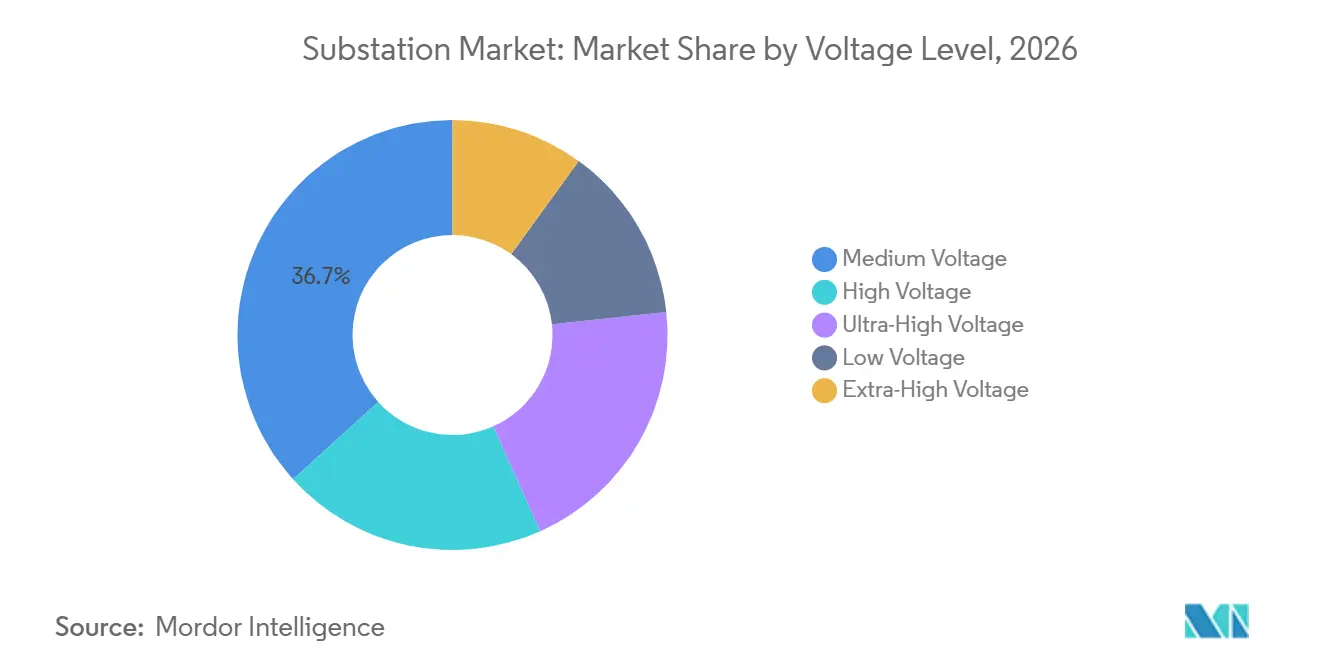
- By voltage level, medium-voltage substations held 36.7% of the electrical substations market in 2026, while ultra-high-voltage substations are projected to grow at a 6.1% CAGR through 2032.
- By component, power transformers held 25.8% of the electrical substations market in 2026, while substation automation systems are projected to grow at a 6.3% CAGR through 2032.
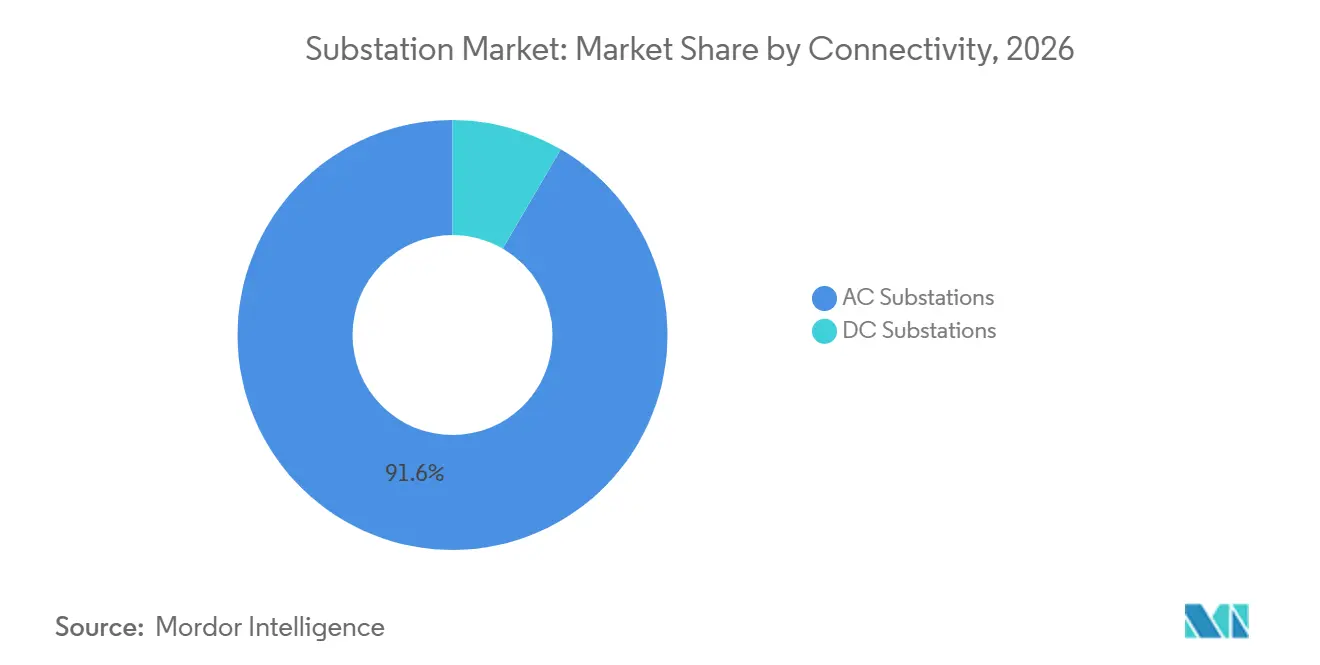
- By connectivity, AC substations held 91.6% of the electrical substations market in 2026, while DC substations are projected to grow at a 6.8% CAGR through 2032.
- By end user, electric utilities held 75.3% of the electrical substations market in 2026, while data centers are projected to grow at a 7.2% CAGR through 2032.
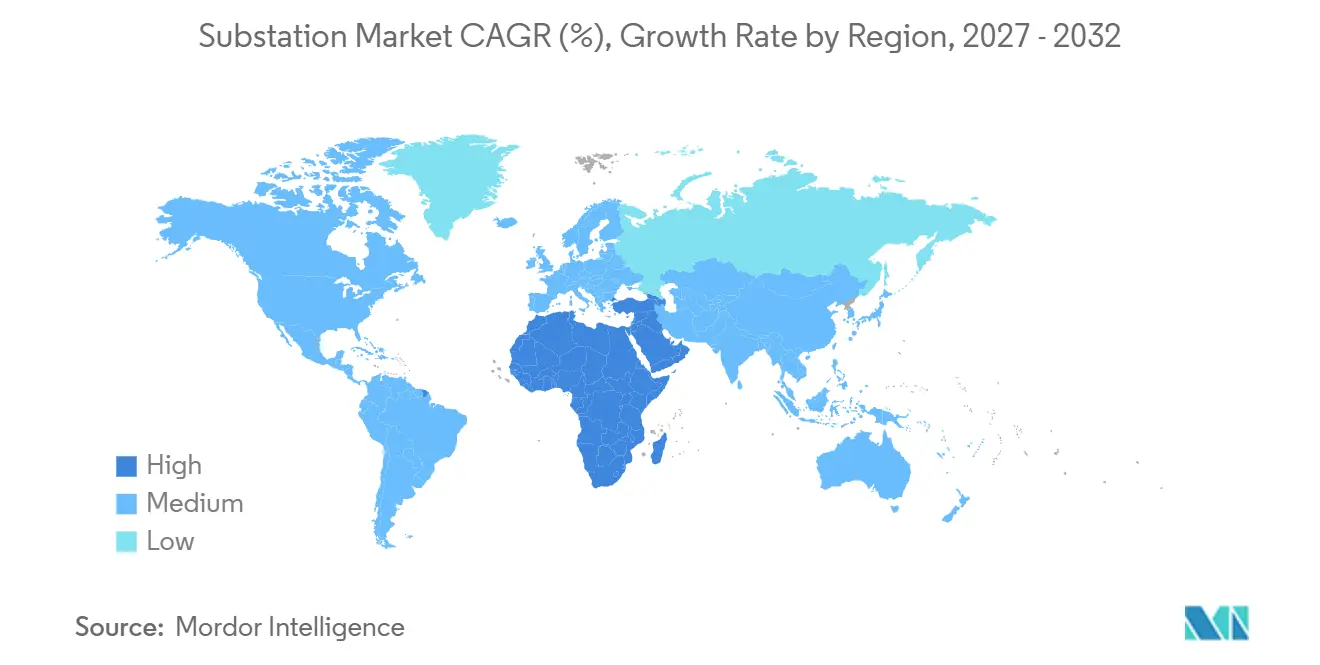
- By geography, Asia-Pacific held 42.2% of the electrical substations market in 2026, while the Middle East and Africa are projected to grow at a 7.8% CAGR through 2032.
Note: Market numbers in this report are based on Mordor Intelligence's proprietary estimation framework, which combines nine months of actuals with Q4 projections for base year 2026.
Market Trends and Insights
Drivers Impact Analysis of Substation Market*
| Driver | (~) % Impact on CAGR Forecast | Geographic Relevance | Impact Timeline |
|---|---|---|---|
| Grid Modernization and Aging-Asset Replacement | +1.4% | Global, with high intensity in North America and Europe | Medium term (2-4 years) |
| Renewable Energy Integration and Bidirectional Power Flows | +1.2% | Global, concentrated in Asia-Pacific, the Middle East and Africa, and Europe | Long term (≥ 4 years) |
| Data Center and AI Infrastructure Load Growth | +1.0% | North America, Europe, Asia-Pacific, with spillover to the Middle East and Africa | Short term (≤ 2 years) |
| Electrification of Transport, Buildings, and Industry | +0.7% | Global, with early gains in North America, Europe, and East Asia | Medium term (2-4 years) |
| Substation Digitalization, Automation, and Predictive Maintenance | +0.5% | Global, strongest in OECD markets | Medium term (2-4 years) |
| Concentrated Load Interconnection and Capacity Bottlenecks | +0.5% | North America and Europe, emerging in Asia-Pacific urban centers | Short term (≤ 2 years) |
| Source: Mordor Intelligence | |||
Grid Modernization and Aging-Asset Replacement
Aging grid assets in North America and Europe support sustained electrical substations market demand because much of the installed base dates from the 1960s through the 1980s. The U.S. Department of Energy announced the SPARK initiative in September 2026, covering USD 5.3 billion in total project value across 31 projects in 26 states and targeting more than 23 GW of added grid capacity.[1] PECO’s approved Reliability and Resiliency 2030 Plan commits USD 2 billion over 5 years to grid infrastructure.[2] These programs extend beyond routine maintenance because old sites can require rebuild protection, control, transformer, and switching systems. Full rebuilding raise project value and create demand across multiple equipment categories. The replacement cycle also gives utilities a practical point to introduce digital monitoring and designs that suit future load growth.
Renewable Energy Integration and Bidirectional Power Flows
Renewable projects require collector substations that raise generation voltage before power enters transmission networks. EDF Renewables commissioned South Africa’s first independent power producer-built main transmission substation in April 2025, connecting 1.5 GW of renewable capacity through the Koruson 400/132 kV facility.[3] Colombia’s Colectora project is scheduled for commissioning in August 2026 and is intended to connect more than 1,000 MW from wind and solar parks in La Guajira.[4] Renewable-heavy networks must manage both export and import flows at substation sites. That requirement changes the protection and control design used for older one-way network configurations. The electrical substations market therefore gains demand from generation connections as well as from upgrades to existing grid nodes.
Data Center and AI Infrastructure Load Growth
Data centers are creating concentrated connection requests that can exceed the capacity of existing local networks. The U.S. Department of Energy reports a mismatch between 12-to-18-month data center development schedules and 3-to-5-year utility procurement cycles. This timing gap sustains backlogs for established electrical substations market suppliers that can provide equipment and engineering capacity. It also encourages dedicated high-voltage substation projects for very large campuses. Data center owners increasingly need reliability, compact layouts, and rapid installation at the same location. These requirements favor manufacturers with proven delivery records and integrated equipment portfolios.
Electrification of Transport, Buildings, and Industry
Transport electrification adds incremental demand to distribution substations and local feeder networks. A peer-reviewed study of Southeast Queensland found that 78% to 93% of the assessed assets could support complete electric-vehicle fleet adoption under normal conditions, while the remainder needed reinforcement or replacement. The finding shows that grid capacity is uneven, even within developed distribution systems. New charging patterns can change the timing and location of load, creating capacity and power-quality requirements. Industrial electrification and building loads add similar pressures where networks were designed for a different demand profile. Electrical substations market opportunities consequently extend from major transmission sites to a wide range of distribution upgrades.
Restraints Impact Analysis of Substation Market*
| Restraint | (~) % Impact on CAGR Forecast | Geographic Relevance | Impact Timeline |
|---|---|---|---|
| High Capital Costs and Long Utility Procurement Cycles | -0.8% | Global; most acute in North America and emerging markets | Medium term (2-4 years) |
| Transformer, Electrical Steel and Specialized Equipment Shortages | -0.6% | Global; especially North America and Europe | Short term (≤ 2 years) |
| Legacy-System Integration and Skilled-Labor Constraints | -0.5% | Global; most acute in North America, Europe, and advanced APAC markets | Long term (≥ 4 years) |
| Cybersecurity, Interoperability and Digital Lifecycle Liability | -0.4% | Global; highest concern in North America, EU, and digitally advanced APAC markets | Medium term (2-4 years) |
| Source: Mordor Intelligence | |||
High Capital Costs and Long Utility Procurement Cycles
New high-voltage substations can take 3 to 7 years to move from planning approval to energization. Regulated utilities often need rate-case approval before they can recover investment costs, while public power cooperatives need governing-board approval for major commitments. This process does not move at the same speed as new data center, charging, or industrial demand. Projects can therefore remain in development even where the system need is clear. The delay restrains near-term electrical substations market installations but builds a longer order pipeline. Equipment vendors must manage this uneven project timing while reserving capacity for approved work.
Transformer, Electrical Steel, and Specialized Equipment Shortages
Transformer availability remains a key constraint for substation construction schedules. A U.S. coalition letter to the Department of Commerce identified grain-oriented electrical steel as a critical supply concern and noted that Cleveland-Cliffs was the country’s sole domestic producer. Hitachi Energy committed an additional USD 250 million in March 2025 to expand transformer component production by 2027. New manufacturing lines need several years to reach full output, so added investment does not remove immediate supply constraints. Long delivery schedules can defer energization, even after utilities complete civil work and approvals. These conditions make manufacturing capacity and access to specialist materials material competitive strengths.
*Our forecasts treat driver/restraint impacts as directional, not additive. The impact forecasts reflect baseline growth, mix effects, and variable interactions.
Substation Market Segment Analysis
By Substation Type:
Distribution Assets Support the Largest Installed BaseDistribution substations held 64.5% of the electrical substations market share in 2026, reflecting the large number of assets required to serve local networks. They connect higher-voltage systems with end-use distribution networks and support daily electricity supply to homes, commercial sites, and industrial facilities. Their installed base is broad because every expanding or ageing distribution system needs repeated points of voltage transformation and protection. Replacement activity in mature networks increases demand for rebuilt distribution sites rather than limited component repairs. These facilities also become more important as transport and building electrification raises local demand. The electrical substations market size attached to distribution equipment is therefore supported by asset count as well as renewal needs.
Transmission substations serve backbone interconnections and usually carry higher contract values because they operate at elevated voltage levels. Generation substations connect power plants to the wider network and remain relevant as utilities replace or add generation capacity. Collector substations are projected to expand at a 5.9% CAGR through 2032 as utility-scale wind and solar projects need dedicated grid connections. SSEN Transmission placed initial orders for standardized modular substations with Hitachi Energy and GE Vernova in August 2026 to connect more than 1 GW of renewable generation. Standardized modular designs can reduce delivery time by using repeatable engineering and lifecycle approaches. This model is suited to renewable programs that require multiple comparable facilities. It also aligns supplier planning with the larger pipeline of generation connections.
By Technology:
AIS Remains Widely Used While GIS Grows FasterAir-insulated substations held 53.1% of the electrical substations market share in 2026 because open-air equipment remains widely used where land is available. Technology is established across transmission projects and supports broad access to conventional equipment and maintenance practices. Its continued scale reflects the existing global network architecture. Air-insulated designs remain suitable for many locations where footprint constraints are limited. They also support utility programs that use familiar, proven engineering standards. This installed base ensures that air-insulated equipment remains central to the electrical substations market.
Gas-insulated substations are projected to grow at an 8.1% CAGR through 2032 because they reduce space needs and support high reliability requirements. Urban locations and data centers can favor compact indoor GIS designs where land access is limited. European requirements affecting sulfur hexafluoride in new medium-voltage equipment add a compliance reason to replace existing approaches. ABB partnered with E. ON to supply SF6-free SafeRing and SafePlus Air switchgear ahead of the 2026 requirement. GE Vernova secured contracts for 2 SF6-free 110 kV Gas Insulated Switchgear (GIS) substations in Berlin during July 2026. The projects use g3 technology and are intended to reduce global warming potential relative to conventional SF6 equipment. These examples show that technical requirements now influence procurement alongside space and reliability needs.
By Voltage Level:
Medium Voltage Provides Scale and Ultra-High-Voltage (UHV) Supports Grid CorridorsMedium-voltage substations represented 36.7% of the electrical substations market in 2026 because distribution applications are numerous across national power systems. They provide a link between higher-voltage networks and local electricity delivery. This voltage range is widely used in urban, commercial, and industrial systems. The segment benefits from the ongoing replacement of aging distribution assets. It also benefits when electric-vehicle charging and new commercial loads require stronger local networks. Medium voltage consequently provides a stable base for the electrical substations market.
Ultra-high-voltage substations are forecast to grow at a 6.1% CAGR through 2032, led by China’s large AC and DC backbone projects. These systems move power from western generation areas to eastern demand centers across long distances. Hitachi Energy announced its first 1,100 kV GIS order in October 2025 for the 1,000 kV Nanchang UHV substation in Jiangxi Province. The order indicates that high-voltage GIS designs are moving further into commercial deployment. UHV projects require specialized equipment, engineering, and testing capability. They therefore create opportunities for suppliers with advanced manufacturing capacity. Their complexity also limits the number of firms that can qualify for major contracts.
By Component:
Transformers Hold the Largest Value PositionPower transformers held 25.8% of the electrical substations market in 2026 and remain the highest-value single item in a typical substation bill of materials. They perform the voltage conversion required for transmission and distribution systems. Switchgear and circuit breakers also have essential roles in control, protection, and fault isolation. Disconnectors, busbars, surge arresters, and capacitor banks remain established equipment categories. Competition in these categories can be more price focused than in large transformer projects. Transformer availability therefore influences both equipment revenue and the timing of complete site delivery.
Substation automation systems are forecast to grow at a 6.3% CAGR through 2032 as utilities add International Electrotechnical Commission (IEC) 61850-based digital functions. Software-defined capabilities can replace parts of traditional hardwired secondary equipment. Schneider Electric introduced software-defined medium-voltage switchgear in October 2026 and tested the design with Equinix in a live data center. The company stated that the design uses 87% less control wiring and 91% fewer terminals than conventional designs. Digital architecture can simplify some site wiring while expanding the role of software, communications, and cybersecurity. Automation growth adds a higher-value systems layer to the electrical substations market. It also raises the importance of suppliers that can combine electrical equipment with digital expertise.
By Connectivity:
AC Retains the Existing Grid BaseAC substations held 91.6% of the electrical substations market in 2026 because the existing global grid uses AC architecture almost universally. AC systems underpin most transmission and distribution networks. The large installed base creates continuing demand for AC equipment, extensions, modernization, and maintenance. Utilities also retain established operating experience and standards for AC substations. This position makes AC infrastructure the core volume segment for suppliers. It will remain the central format for most grid investments during the forecast period.
DC substations are forecast to grow at a 6.8% CAGR through 2032 as high-voltage direct-current corridors support long-distance renewable transmission and offshore wind connections. They are also used for back-to-back links between asynchronous AC systems. Iberdrola installed the marine converter station for its East Anglia THREE offshore wind project, which is the group’s first HVDC wind project and carries a total EUR 5 billion investment. Converter stations have a specialized role in offshore and long-distance transmission projects. These projects require complex control systems and high-capacity equipment. Their expansion creates a structural build phase for the DC portion of the electrical substations market. The segment’s growth reflects new network needs rather than replacement of the broader AC base.
By End User:
Utilities Remain the Primary BuyersElectric utilities held 75.3% of the electrical substations market share in 2026 because they own and operate most transmission and distribution infrastructure. They procure new and replacement equipment through formal capital plans and long approval processes. Their spending covers backbone transmission, distribution modernization, renewable connections, and resilience work. Utility demand is distributed across many asset types and voltage classes. Their role makes public policy, rate recovery, and equipment lead times important to the electrical substations market. Utility procurement also favors suppliers that can provide certified equipment, project engineering, and reliable delivery.
Data centers are forecast to grow at a 7.2% CAGR through 2032, the fastest end-user rate in the supplied analysis. Large campuses increasingly need dedicated high-voltage connection assets rather than marginal additions to existing networks. Siemens Energy signed a contract in March 2026 to provide a 300 MW GIS substation and 2 × 150 Mega Volt-Ampere (MVA) transformers for Terranova’s hyperscale campuses in Campinas, Brazil. Industrial and commercial facilities remain an important secondary group with dedicated connection needs. Renewable energy developers also need collector and point-of-interconnection facilities for each major project. Data-center demand changes procurement patterns by bringing some owners directly to equipment manufacturers. This increases the value of compact design, delivery speed, and integrated project capability.
Geography Analysis
APAC Substation Market
Asia-Pacific held 42.2% of the electrical substations market share in 2026, making it the largest regional contributor. China remains central to regional spending because it is building high-voltage transmission capacity and supporting renewable integration. India’s Central Electricity Authority plans 827,600 MVA of new substation capacity between FY27 and FY36, supporting more than 900 GW of non-fossil generation. China’s Nanchang Ultra High Voltage (UHV) GIS order also shows the region’s role at the high-voltage technology frontier. Japan, South Korea, and Australia are adding GIS capacity to address urban density and resilience needs. Southeast Asian systems are expanding as electricity access and demand increase.
North America and Europe Substation Market
North America and Europe are major developed electrical substations market regions because both need aging assets replaced and new loads connected. The U.S. Department of Energy’s SPARK projects reflect policy-backed investment in increased grid capacity. PECO’s plan adds a utility example of funded replacement and resilience work. Large data-center developments create local connection pressure in Northern Virginia, Central Ohio, and West Texas. Europe also faces demand for equipment that meets SF6-related requirements. ABB’s E.ON deployment and GE Vernova’s Berlin orders demonstrate the shift toward SF6-free technologies. The United Kingdom’s grid upgrades also include GIS work intended to support data-center growth.
MEA and South America Substation Market
The Middle East and Africa are projected to grow at a 7.8% CAGR through 2032, the fastest regional rate in the supplied electrical substations market outlook. Dubai Electricity and Water Authority (DEWA) stated in August 2025 that its electricity transmission investments exceeded AED 7.6 billion and covered 49 new 132 kV substations under construction. European Bank for Reconstruction and Development (EBRD) financing in Egypt includes support for grid upgrades and a 500 kV substation in Cairo. The European Investment Bank (EIB) and European Union announced a EUR 690 million clean-energy grid investment program in Egypt in June 2026. Saudi and UAE projects support new capacity for renewable targets and economic development plans. South America is also advancing as renewable projects and data-center campuses require connection infrastructure. Brazil and Colombia illustrate this demand through High-Voltage Direct Current (HVDC), renewable, and collector-substation programs.
Competitive Landscape
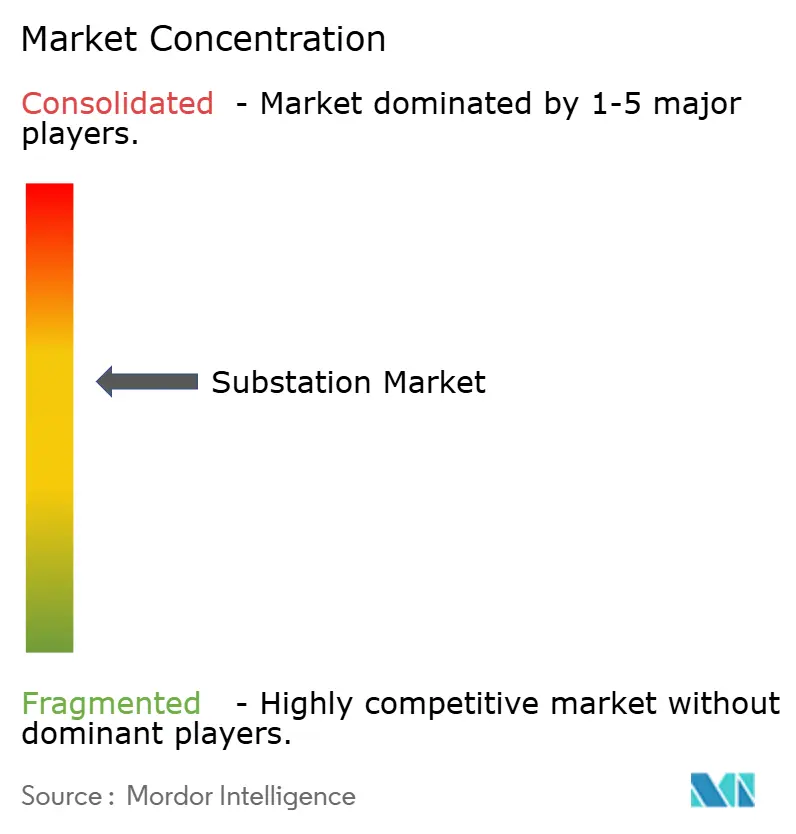
The electrical substations market is moderately concentrated among global equipment suppliers, while competition remains fragmented across regional manufacturers, engineering firms, and specialist automation providers. ABB, Hitachi Energy, Siemens Energy, GE Vernova, and Schneider Electric shape major equipment standards and compete across global projects. Manufacturing capacity and delivery certainly now influence selection as strongly as equipment specifications. Long lead times for transformers and related equipment strengthen the position of suppliers with available capacity. Chinese firms, including TBEA and NARI Technology, compete in Middle Eastern and African projects through equipment supply and engineering, procurement, and construction capability. Cybersecurity requirements for digital substation communications also raise the qualification threshold for smaller suppliers.
Hitachi Energy is expanding capacity while pursuing large grid contracts. Its USD 250 million March 2025 transformer component investment supplements a broader effort to address supply constraints. The company also signed an agreement worth up to USD 700 million with E.ON for transformers supporting Germany’s energy grid. ABB’s SF6-free switchgear work with E.ON responds directly to technology and regulatory needs in Europe. GE Vernova’s Berlin GIS contracts show a similar response through SF6-free equipment. These moves show that investment, technical compliance, and project execution are mutually reinforcing competitive factors.
Digitalization is an active competitive area because utilities and large private users want more controllable, monitored, and compact systems. Schneider Electric’s software-defined medium-voltage switchgear example shows how suppliers are reducing hardwired control equipment in data-center applications. GE Vernova introduced its SX Pantograph Disconnector portfolio at CIGRE (International Council on Large Electric Systems) 2026, with ratings up to 550 kV, 5,000 A, and 80 kA. The design combines a smaller physical footprint with digital condition-monitoring capability. Suppliers that combine high-voltage equipment, digital controls, and dependable production capacity have a stronger position in large projects. Regional competitors can remain relevant through price, local delivery, or focused engineering expertise. The overall field remains competitive despite the influence of the largest global vendors.
Substation Industry Leaders
-
Hitachi Energy Ltd.
-
Siemens Energy AG
-
Schneider Electric SE
-
GE Vernova Inc.
-
ABB Ltd.
- *Disclaimer: Major Players sorted in no particular order
Substation Market Companies Covered in this Report
- ABB Ltd.
- Bharat Heavy Electricals Limited (BHEL)
- CG Power and Industrial Solutions Limited
- Eaton Corporation plc
- Fuji Electric Co., Ltd.
- GE Vernova Inc.
- Hitachi Energy Ltd.
- Hyosung Heavy Industries Corporation
- Hyundai Electric & Energy Systems Co., Ltd.
- Larsen & Toubro Limited
- Lucy Electric Limited
- Mitsubishi Electric Corporation
- NARI Technology Co., Ltd.
- NR Electric Co., Ltd.
- Powell Industries, Inc.
- S&C Electric Company
- Schneider Electric SE
- Siemens Energy AG
- TBEA Co., Ltd.
- Toshiba Energy Systems & Solutions Corporation
Recent Industry Developments in Substation Market
- August 2026: GE Vernova unveiled the latest SX Pantograph Disconnector portfolio rated up to 550 kV, 5,000 A, and 80 kA at CIGRE Paris 2026. The design is smaller, lighter, and digitally native, reducing substation footprint while enabling real-time asset condition monitoring at the switching equipment level.
- August 2026: SSEN Transmission placed its first orders for standardized modular substations in northern Scotland with Hitachi Energy and GE Vernova, connecting more than 1 GW of renewable generation, compressing delivery timelines through a standardized asset lifecycle approach.
- July 2026: GE Vernova secured 2 contracts from Stromnetz Berlin to design, supply, and install new 110 kV SF6-free Gas Insulated Switchgear (GIS) substations in Wittenau and Neukölln using g3 technology, reducing global warming potential by 99% versus SF6. The Wittenau project is scheduled for completion by March 2031.
- March 2026: Siemens Energy signed a contract worth more than BRL 100 million, USD 18.6 million, with Terranova to supply a 300 MW GIS substation and 2 × 150 MVA power transformers for hyperscale data center campuses in Campinas, Brazil, with delivery scheduled for 2027.
Global Substation Market Report Scope
An electrical substation is a critical node in an electric power system that connects generation plants, transmission networks, and distribution grids. It uses transformers, circuit breakers, and switches to perform key operations.
The global substation market is segmented by substation type, technology, voltage level, component, connectivity, end user, and geography. By substation type, the market is segmented into transmission substations, distribution substations, generation substations, and collector substations. By technology, the market is segmented into air-insulated substations (AIS), gas-insulated substations (GIS), hybrid substations, and other technologies. By voltage level, the market is segmented into low-voltage, medium-voltage, high-voltage, extra-high-voltage, and ultra-high-voltage substations. By component, the market is segmented into power transformers, switchgear, circuit breakers, disconnectors and isolators, busbars, instrument transformers, protection and control systems, substation automation systems, surge arresters, capacitor banks and reactors, and other components. By connectivity, the market is segmented into AC and DC substations. By end user, the market is segmented into electric utilities, industrial facilities, commercial facilities, renewable energy developers, data centers, transportation and infrastructure, and other end users. The report also covers the market size and forecasts for the global substation market across 29 countries in key regions. For each segment, the market sizing and forecasts have been provided on the basis of value (USD).
Segmentation Overview
| Transmission Substations |
| Distribution Substations |
| Generation Substations |
| Collector Substations |
| Air-Insulated Substations (AIS) |
| Gas-Insulated Substations (GIS) |
| Hybrid Substations |
| Others |
| Low Voltage |
| Medium Voltage |
| High Voltage |
| Extra-High Voltage |
| Ultra-High Voltage |
| Power Transformers |
| Switchgear |
| Circuit Breakers |
| Disconnectors and Isolators |
| Busbars |
| Instrument Transformers |
| Protection and Control Systems |
| Substation Automation Systems |
| Surge Arresters |
| Capacitor Banks and Reactors |
| Other Components |
| AC Substations |
| DC Substations |
| Electric Utilities |
| Industrial Facilities |
| Commercial Facilities |
| Renewable Energy Developers |
| Data Centers |
| Transportation and Infrastructure |
| Other End Users |
| North America | United States |
| Canada | |
| Mexico | |
| Europe | Germany |
| France | |
| Italy | |
| Spain | |
| United Kingdom | |
| Poland | |
| Netherlands | |
| Russia | |
| Rest of Europe | |
| Asia-Pacific | China |
| India | |
| Japan | |
| South Korea | |
| Australia | |
| Indonesia | |
| Malaysia | |
| Thailand | |
| Philippines | |
| Rest of Asia-Pacific | |
| South America | Brazil |
| Argentina | |
| Colombia | |
| Rest of South America | |
| Middle East and Africa | Saudi Arabia |
| United Arab Emirates | |
| South Africa | |
| Kenya | |
| Egypt | |
| Nigeria | |
| Rest of Middle East and Africa |
| By Substation Type | Transmission Substations | |
| Distribution Substations | ||
| Generation Substations | ||
| Collector Substations | ||
| By Technology | Air-Insulated Substations (AIS) | |
| Gas-Insulated Substations (GIS) | ||
| Hybrid Substations | ||
| Others | ||
| By Voltage Level | Low Voltage | |
| Medium Voltage | ||
| High Voltage | ||
| Extra-High Voltage | ||
| Ultra-High Voltage | ||
| By Component | Power Transformers | |
| Switchgear | ||
| Circuit Breakers | ||
| Disconnectors and Isolators | ||
| Busbars | ||
| Instrument Transformers | ||
| Protection and Control Systems | ||
| Substation Automation Systems | ||
| Surge Arresters | ||
| Capacitor Banks and Reactors | ||
| Other Components | ||
| By Connectivity | AC Substations | |
| DC Substations | ||
| By End User | Electric Utilities | |
| Industrial Facilities | ||
| Commercial Facilities | ||
| Renewable Energy Developers | ||
| Data Centers | ||
| Transportation and Infrastructure | ||
| Other End Users | ||
| By Geography | North America | United States |
| Canada | ||
| Mexico | ||
| Europe | Germany | |
| France | ||
| Italy | ||
| Spain | ||
| United Kingdom | ||
| Poland | ||
| Netherlands | ||
| Russia | ||
| Rest of Europe | ||
| Asia-Pacific | China | |
| India | ||
| Japan | ||
| South Korea | ||
| Australia | ||
| Indonesia | ||
| Malaysia | ||
| Thailand | ||
| Philippines | ||
| Rest of Asia-Pacific | ||
| South America | Brazil | |
| Argentina | ||
| Colombia | ||
| Rest of South America | ||
| Middle East and Africa | Saudi Arabia | |
| United Arab Emirates | ||
| South Africa | ||
| Kenya | ||
| Egypt | ||
| Nigeria | ||
| Rest of Middle East and Africa | ||
Key Questions Answered in the Report
What is the 2026 value of the electrical substations market?
The electrical substations market is valued at USD 156.67 billion in 2026 and is forecast to reach USD 210.45 billion by 2032.
What is driving electrical substation demand?
Grid replacement, renewable connections, data-center loads, and electrification are the principal demand factors in the supplied analysis.
Which substation technology is growing fastest?
Gas-insulated substations are projected to grow at an 8.1% CAGR through 2032, supported by land constraints, reliability needs, and SF6-related requirements.
Which end user has the strongest projected growth?
Data centers have the highest projected end-user CAGR at 7.2% through 2032, as large campuses increasingly need dedicated high-voltage assets.
Which region has the largest electrical substations market share?
Asia-Pacific accounts for 42.2% of demand in 2026, supported by Chinese and Indian grid expansion programs.
Which region is projected to grow fastest?
The Middle East and Africa are projected to grow at a 7.8% CAGR through 2032, supported by transmission and renewable-energy programs.