
STATCOM Market Size and Share
Market Overview
| Study Period | 2021 - 2032 |
|---|---|
| Market Size (2027) | USD 2.48 Billion |
| Market Size (2032) | USD 3.79 Billion |
| Growth Rate (2027 - 2032) | 8.85 % |
| Fastest Growing Market | Asia-Pacific |
| Largest Market | North America |
| Market Concentration | Medium |
Major Players *Disclaimer: Major Players sorted in no particular order Image © Mordor Intelligence. Reuse requires attribution under CC BY 4.0. | |
STATCOM Market Analysis by Mordor Intelligence
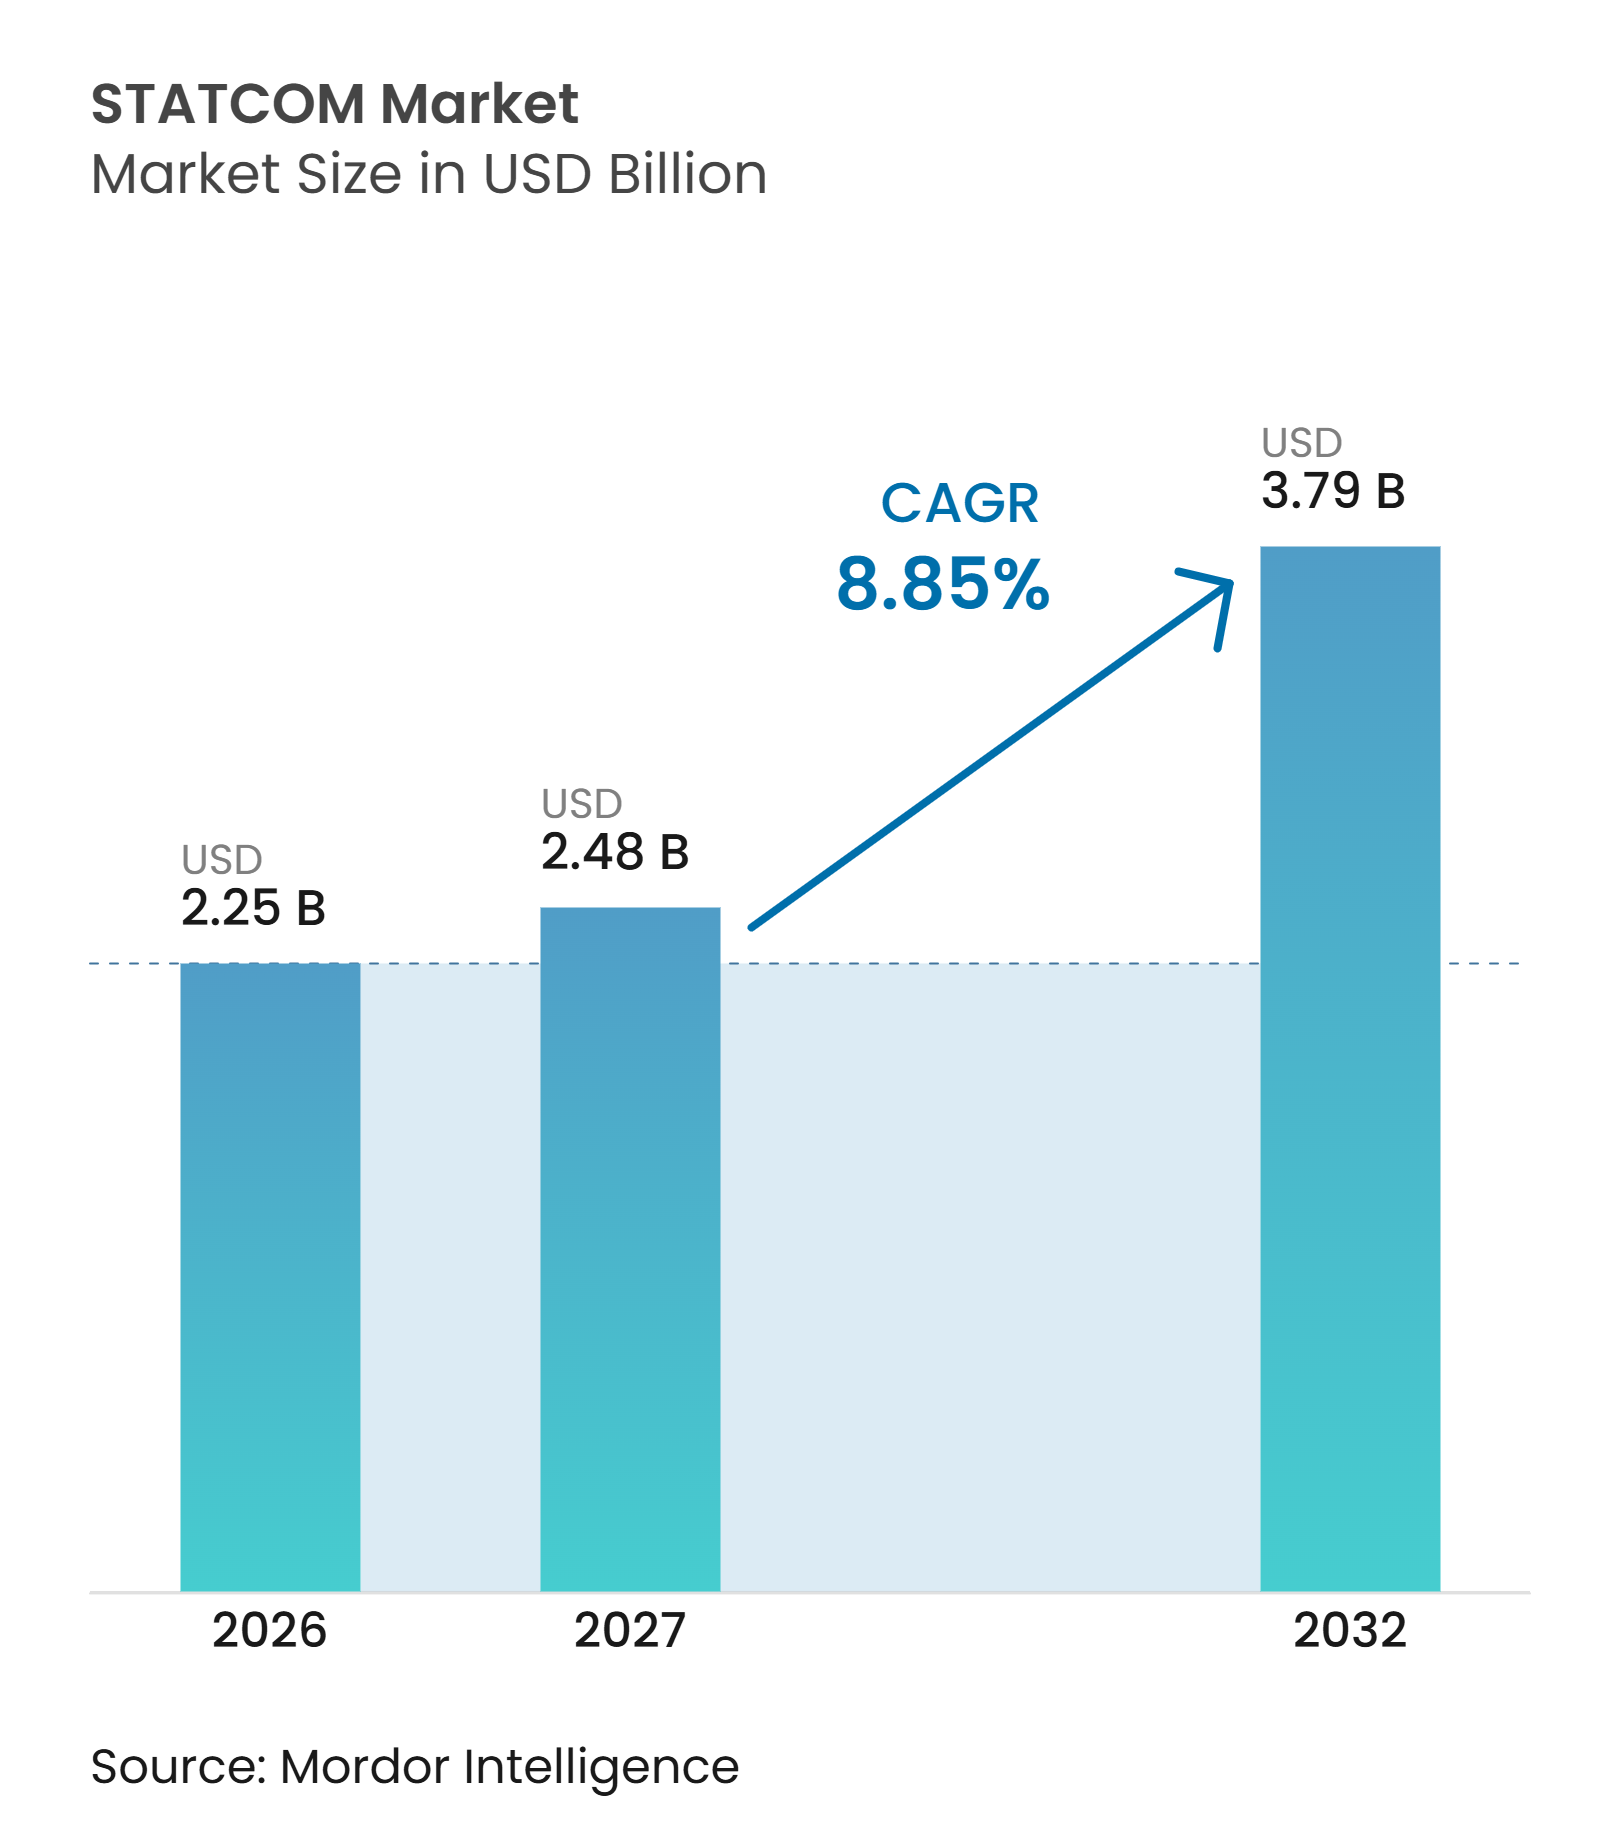
The STATCOM market size was valued at USD 2.25 billion in 2026 and is estimated to grow to USD 3.79 billion by 2032, at a CAGR of 8.85% during the forecast period (2027-2032). The STATCOM market is being supported by grid codes that require renewable projects to provide dynamic voltage and reactive-power support as conventional plants retire. Inverter-based wind and solar resources can supply electricity efficiently, but they do not provide the natural reactive-power response or rotational inertia that were once provided by coal and nuclear generation. Transmission operators are therefore increasing their use of dedicated power-electronics equipment at grid nodes and renewable interconnection points. Germany’s identified requirement for 70 units across its 4 transmission system operators illustrates the scale of replacement demand that can emerge when synchronous generation is removed. Suppliers are responding through modular multilevel converter platforms, grid-forming controls, semiconductor improvements, and systems that combine reactive-power support with fast active-power response.
Key Report Takeaways
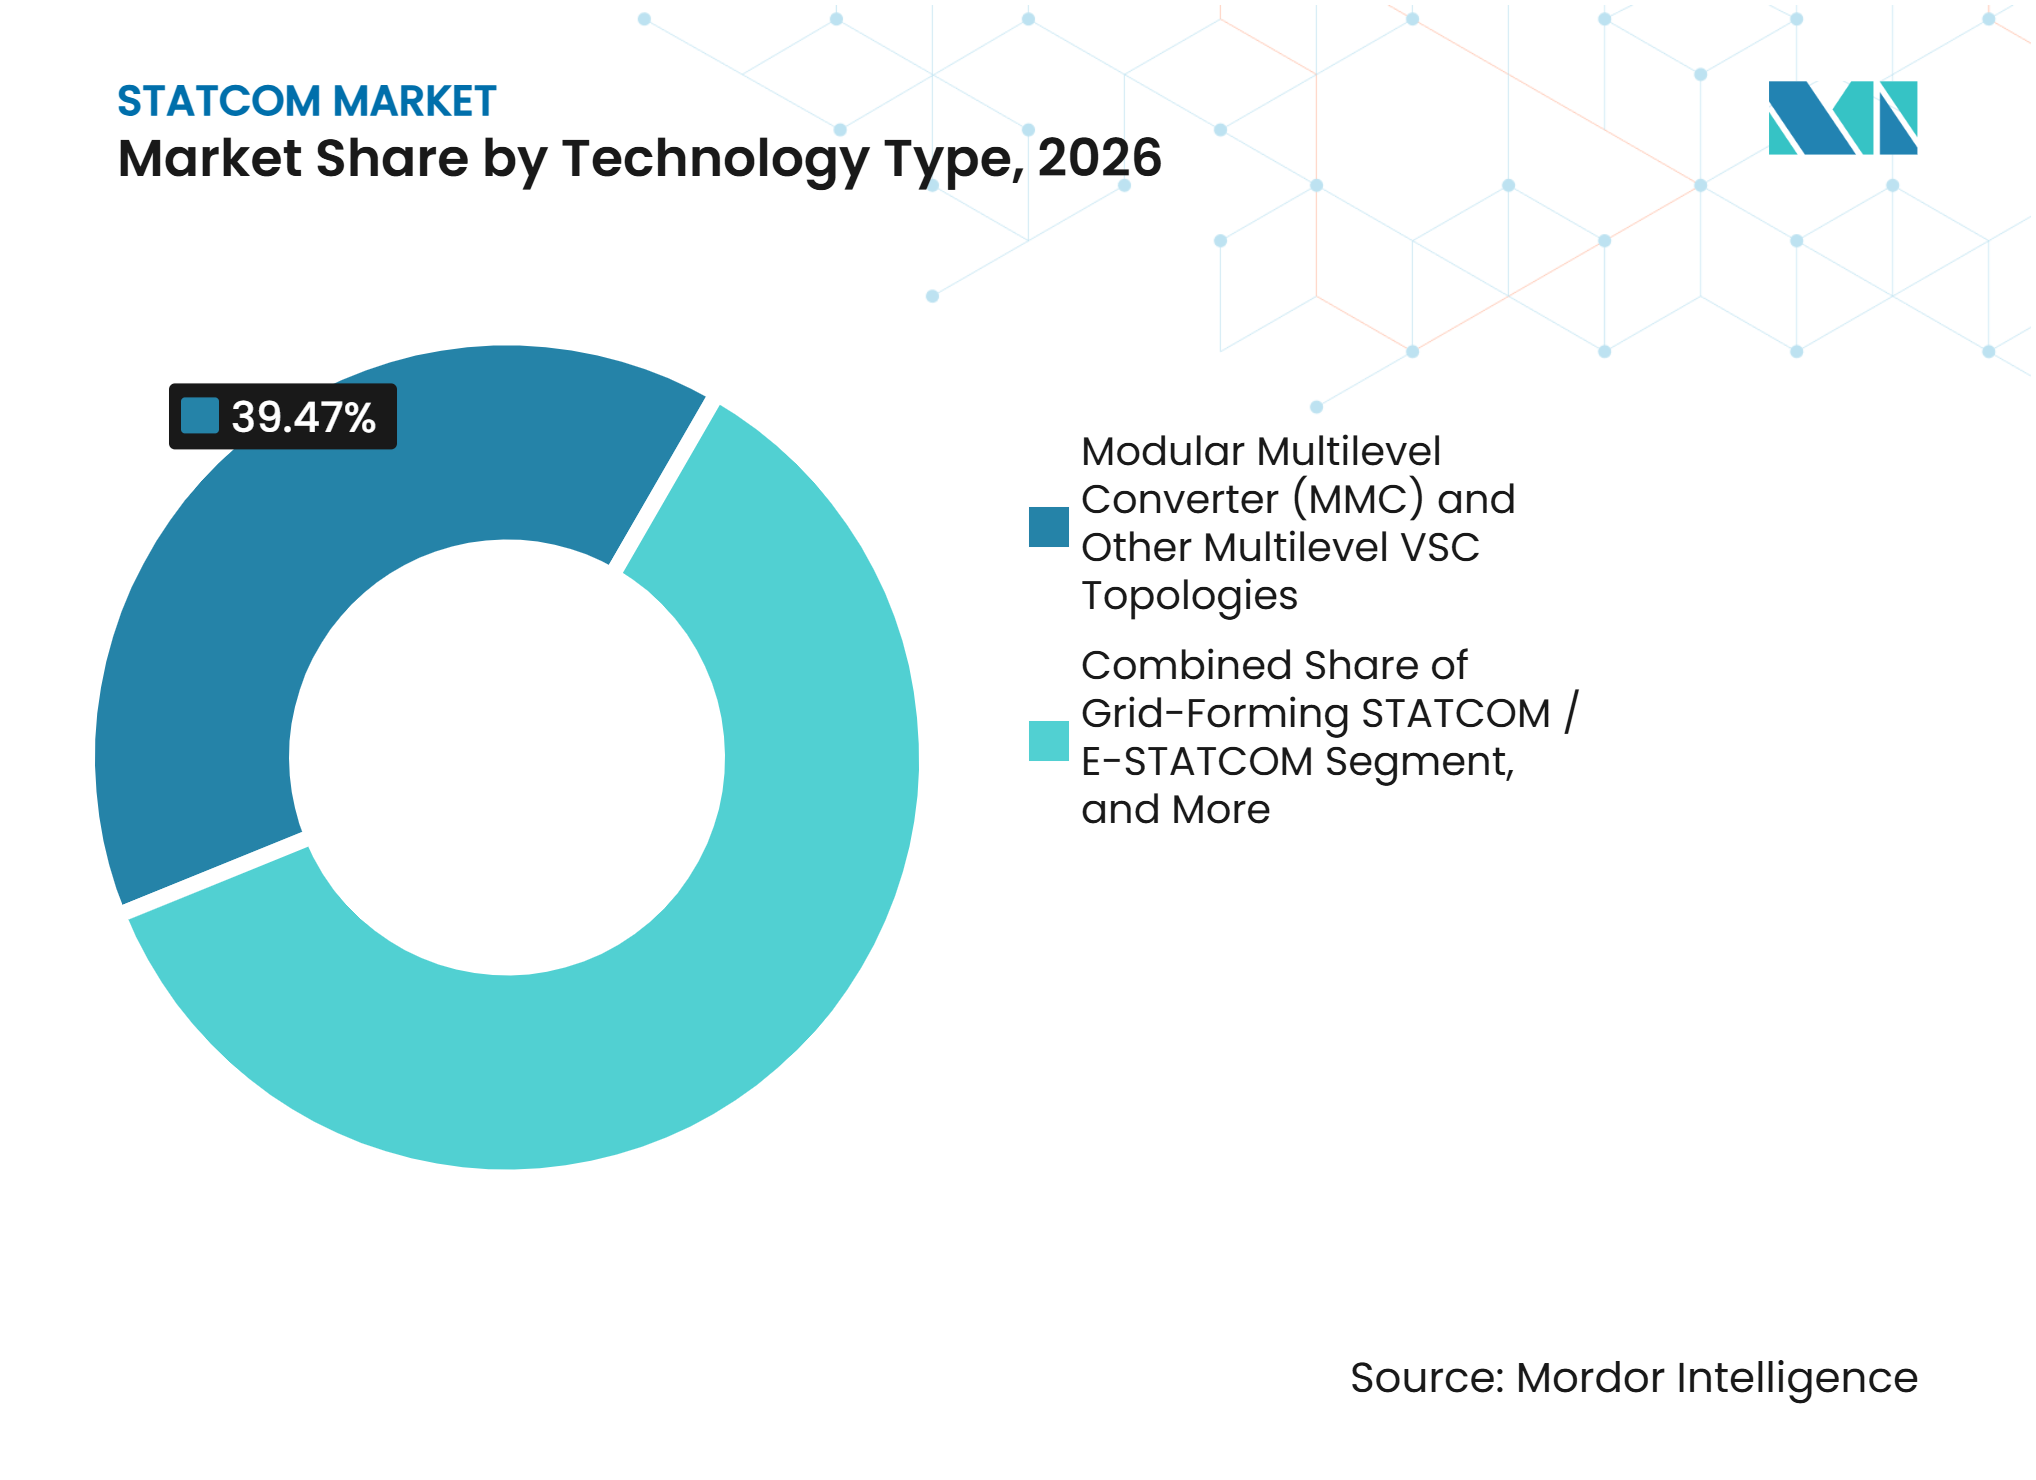
- By technology type, MMC and other multilevel VSC topologies held 39.47% of the STATCOM market share in 2026, while Grid-Forming STATCOM and E-STATCOM are projected to expand at a 9.47% CAGR through 2032.
- By reactive power rating, Large-Scale Transmission STATCOM held 46.83% of the STATCOM market share in 2026, while Small-Scale Distribution and Industrial STATCOM is projected to expand at a 9.38% CAGR through 2032.
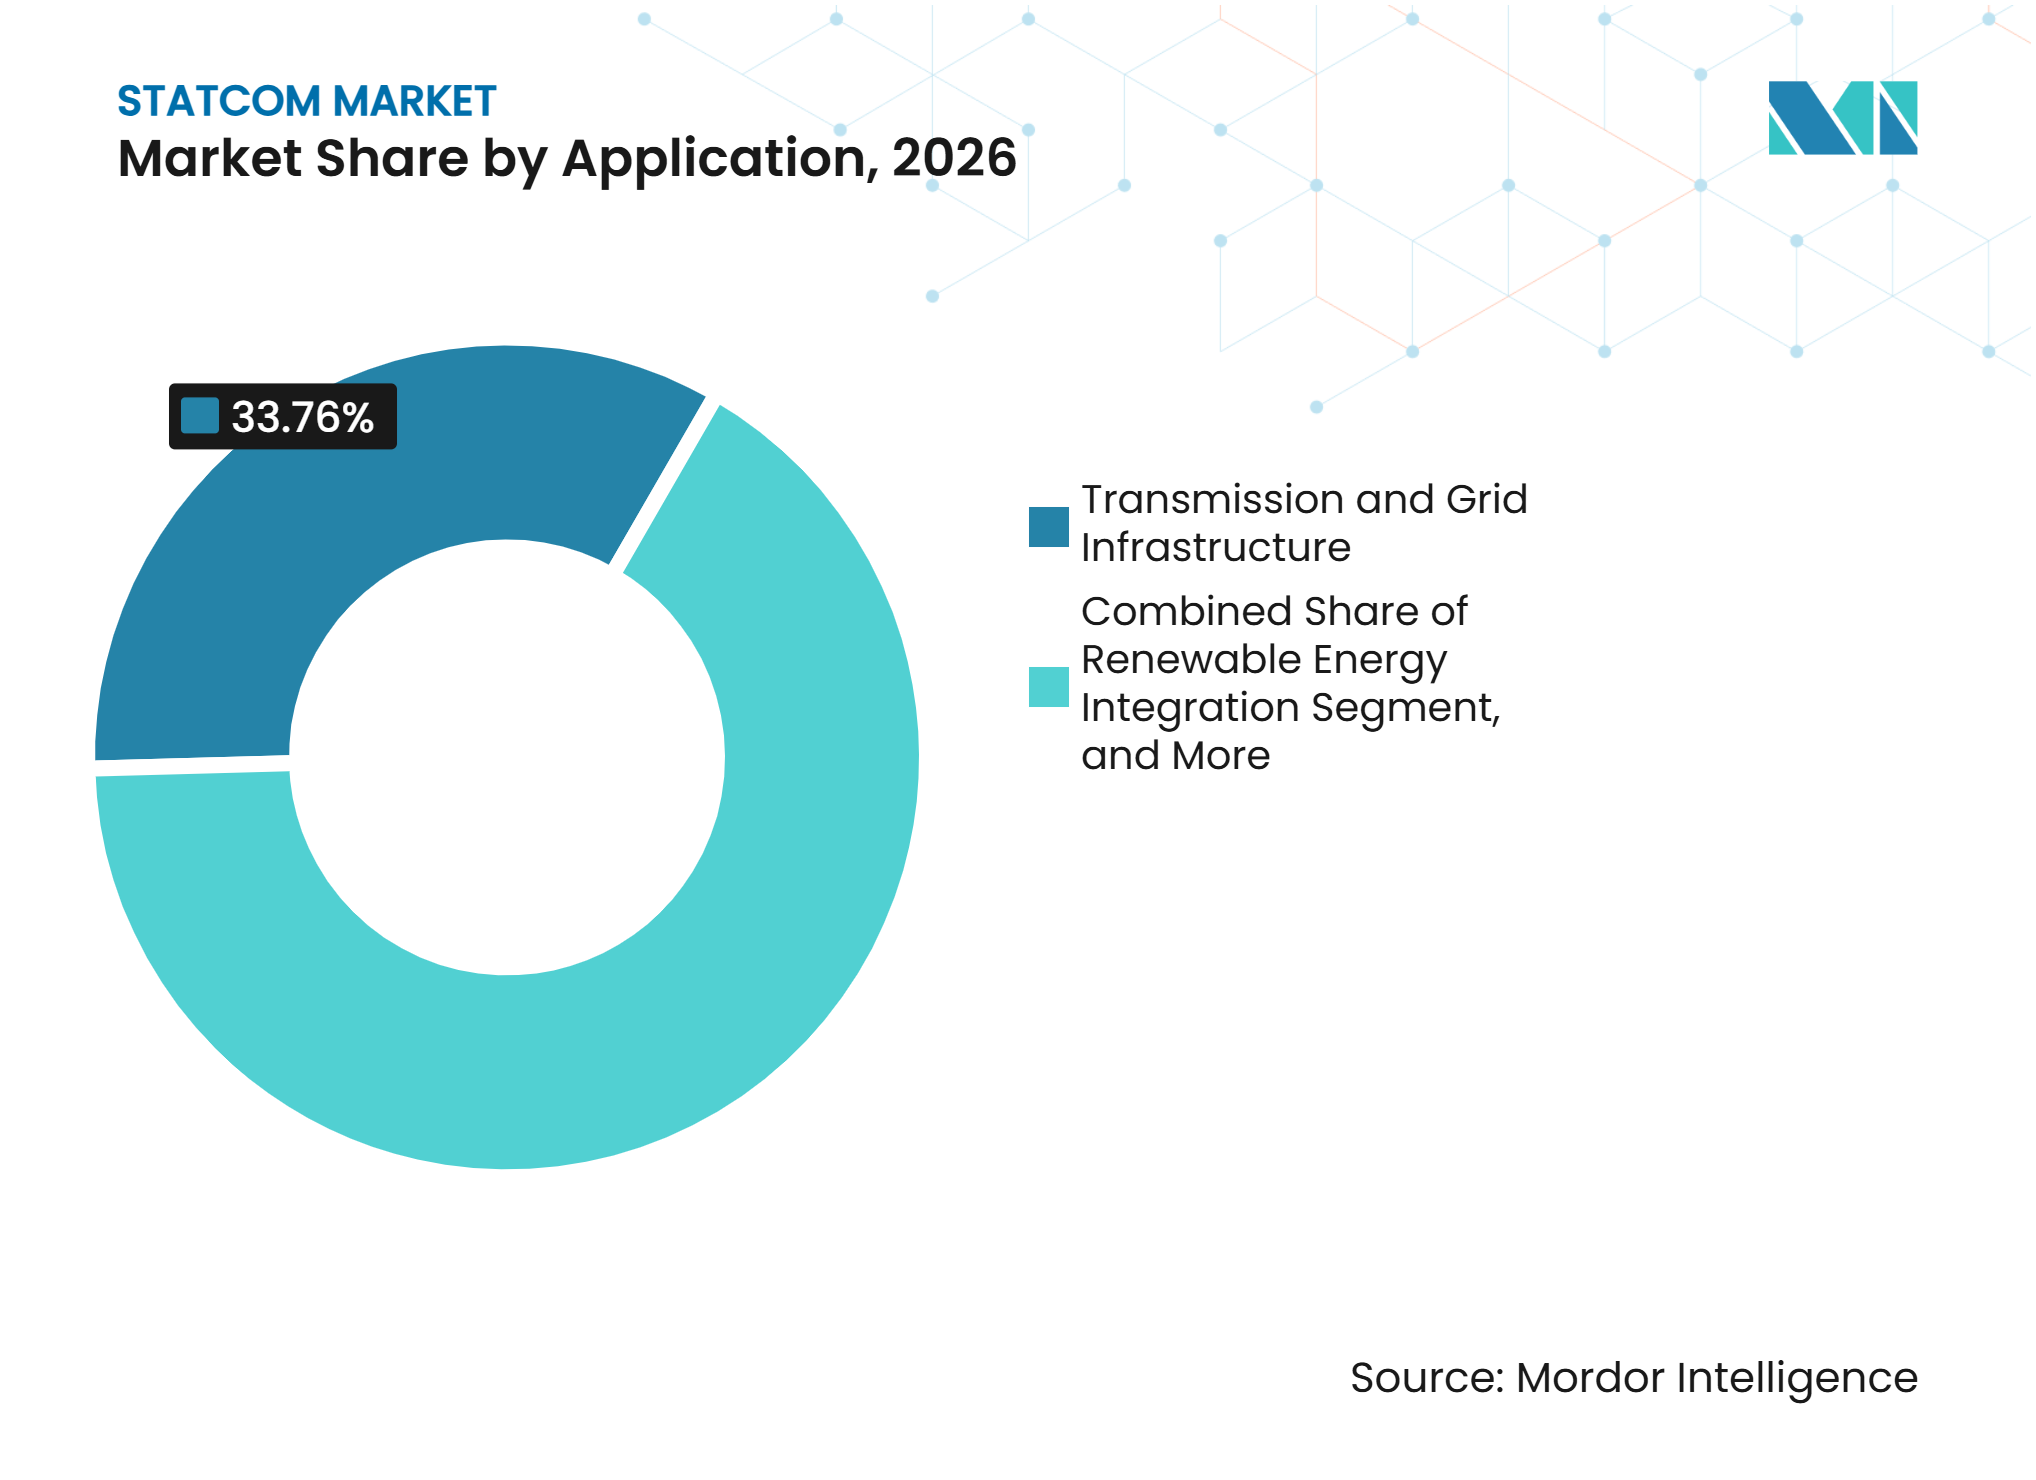
- By application, Transmission and Grid Infrastructure accounted for 33.76% of the STATCOM market size in 2026, while Data Centers and Commercial Infrastructure are projected to expand at a 9.54% CAGR through 2032.
- By component, Power Electronic Converter Valves accounted for 36.58% of the STATCOM market in 2026, while Control, Protection, and Monitoring Systems are projected to expand at a 9.41% CAGR through 2032.
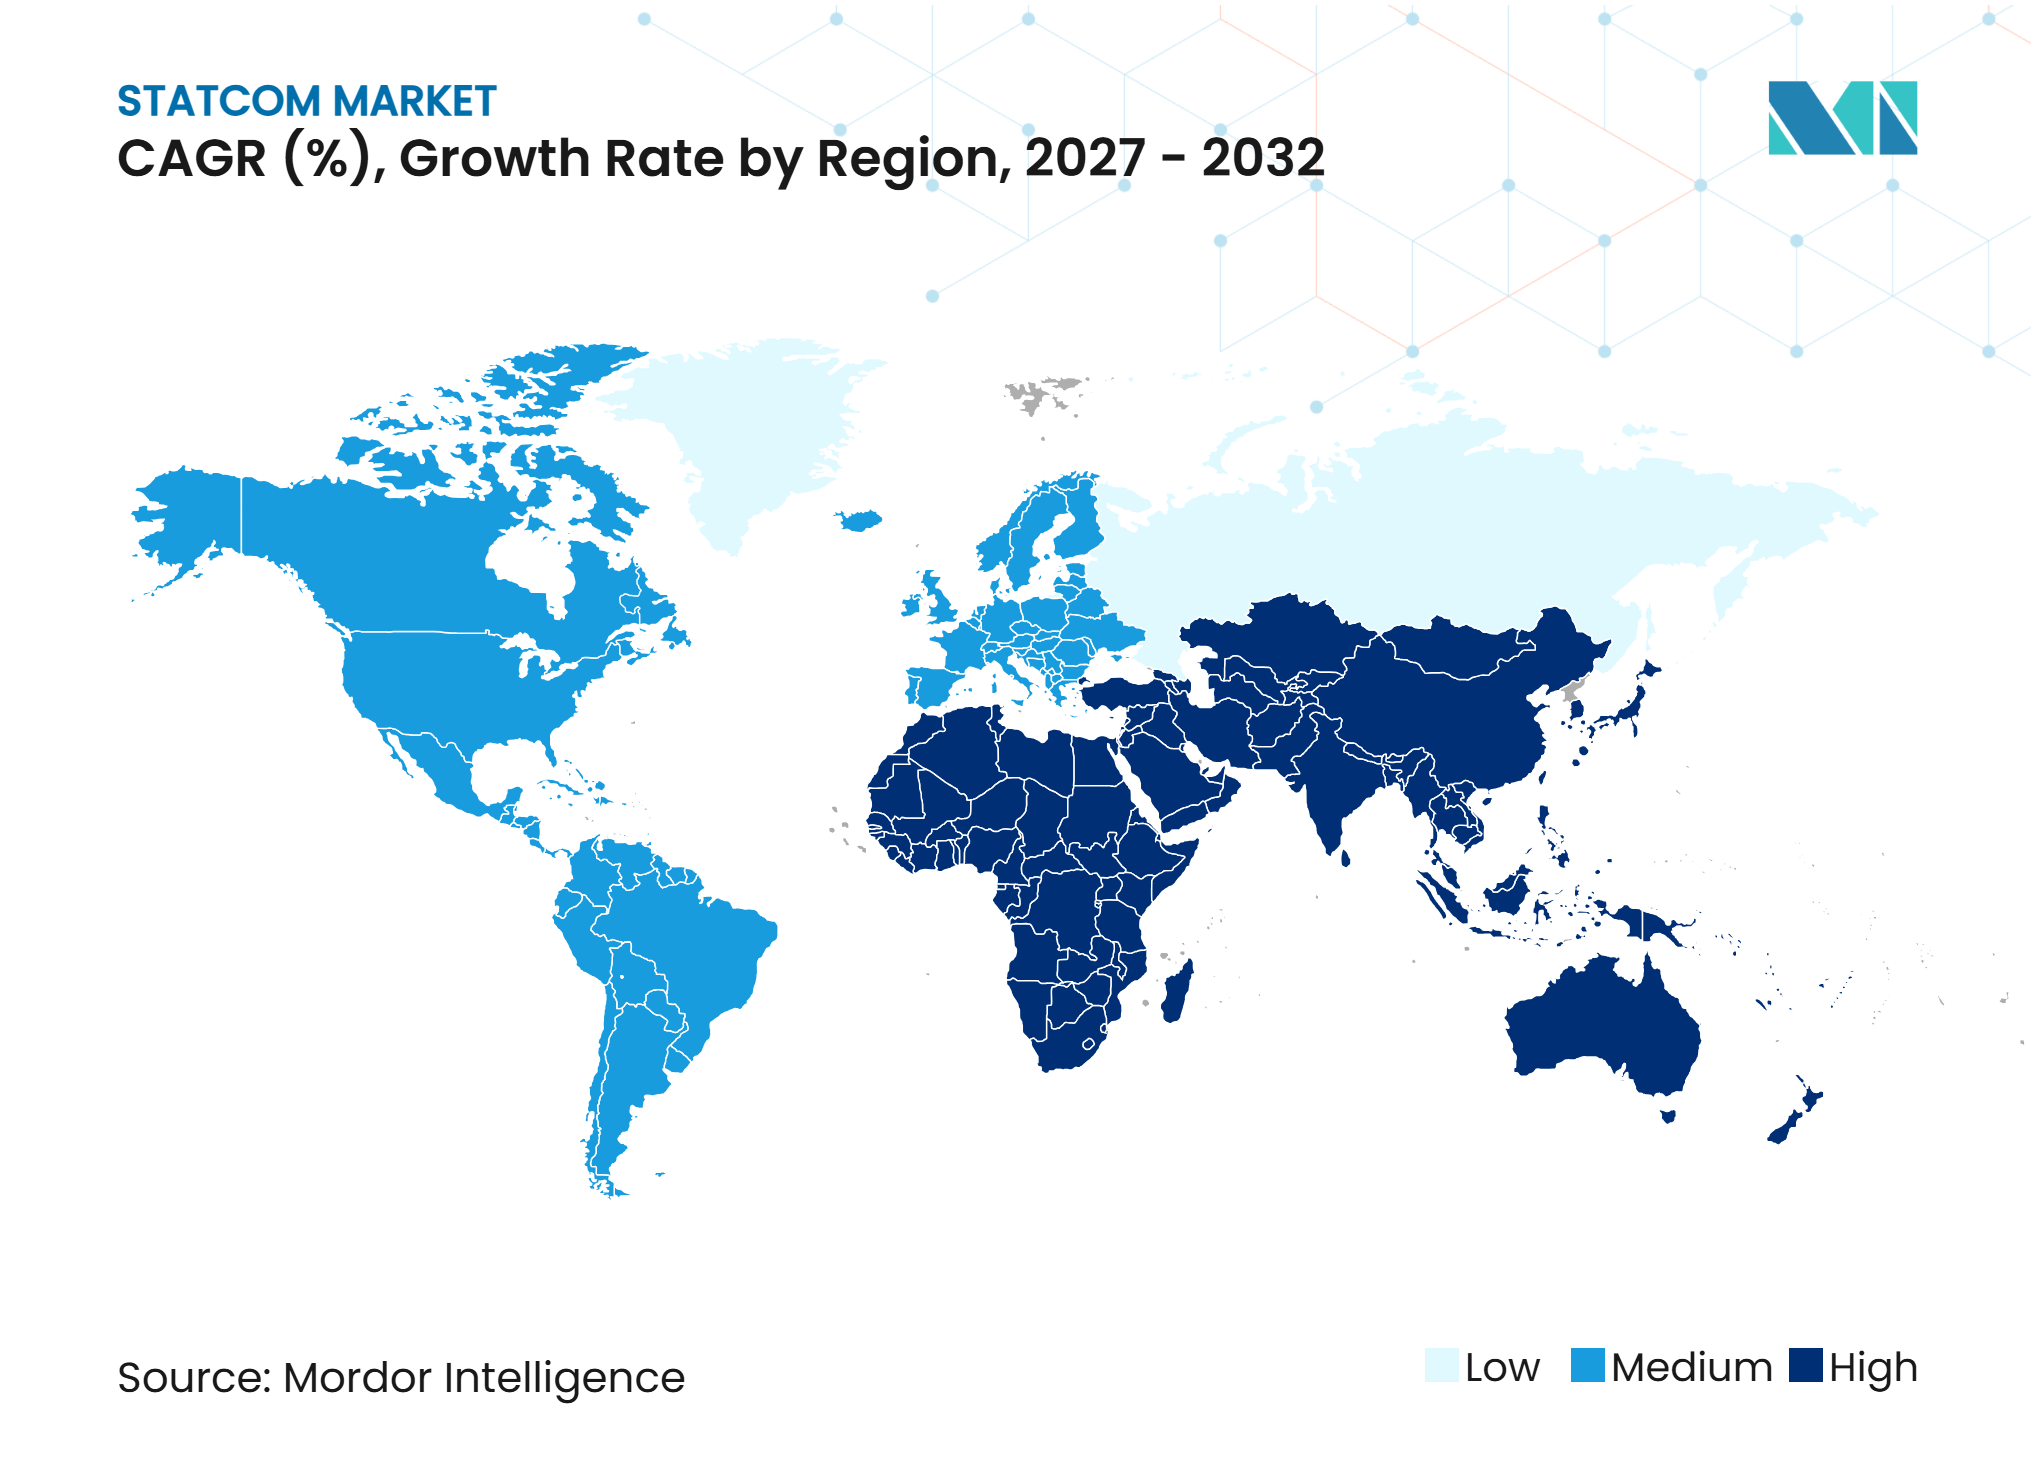
- By geography, North America held 37.24% of global revenue in 2026, while Asia-Pacific is projected to expand at a 9.52% CAGR through 2032.
Note: Market numbers in this report are based on Mordor Intelligence's proprietary estimation framework, which combines nine months of actuals with Q4 projections for base year 2026.
Market Trends and Insights
Drivers Impact Analysis of STATCOM Market*
| Driver | (~) % Impact on CAGR Forecast | Geographic Relevance | Impact Timeline |
|---|---|---|---|
| Renewable Energy Integration | +2.3% | Global | Medium term (2-4 years) |
| Grid Modernization and Transmission Expansion | +1.8% | North America and Europe | Medium term (2-4 years) |
| Increasing Demand for Grid Stability Solutions | +1.5% | Global | Short term (≤ 2 years) |
| Expansion of Cross-Border Power Transmission | +0.9% | Europe and Asia-Pacific | Long term (≥ 4 years) |
| Rising Power Quality Requirements | +0.6% | North America and Asia-Pacific | Short term (≤ 2 years) |
| Offshore Wind and Renewable Energy Expansion | +0.5% | Europe and Asia-Pacific | Medium term (2-4 years) |
| Source: Mordor Intelligence | |||
Renewable Energy Integration Accelerates Reactive Power Demand
The STATCOM market is seeing increased demand driven by renewable additions, which can create voltage management needs along long transmission corridors. China added 349.8 GW of photovoltaic capacity in 2025, bringing its cumulative capacity to 1,463.5 GW, while India added 55.9 GW, bringing its cumulative capacity to 180.5 GW. Many of these projects are centralized installations located far from major load centers, which increases the need for voltage control at substations and along transmission lines. FERC Order No. 2023 requires new U.S. generation projects to demonstrate dynamic reactive-power capability, placing voltage-support requirements within the interconnection process.[1] A 2025 IEEE study at a 400-kV pooling substation found that STATCOM technology responded more effectively than static VAR compensators under high levels of renewable penetration. This requirement changes the role of reactive-power equipment from an optional grid upgrade to a defined part of renewable project development.
Grid Modernization and Transmission Expansion Drive STATCOM Investment
The STATCOM market benefits when utilities replace aging transmission assets and expand connections for renewable generation. Power Grid Corporation of India maintained a fiscal year 2026 capital expenditure target of INR 28,000 crore to INR 30,000 crore (USD 333 million to USD 357 million) at the cited fiscal-year conversion rate. The program includes reactive-power compensation as part of broader grid upgrades. In the United States, FERC Order No. 2023 continues to create interconnection obligations that can increase demand for dynamic voltage support from 2027 onward. GE Vernova reported that its electrification-equipment backlog more than tripled during fiscal year 2025, driven by demand for transformers, switchgear, and FACTS technologies. The backlog indicates that utility spending is outpacing available manufacturing capacity for major grid equipment.
Increasing Demand for Grid Stability Solutions Intensifies as Synchronous Generation Retires
The retirement of coal and nuclear plants removes rotating equipment that historically supported voltage regulation and system inertia. The STATCOM market serves this gap because conventional synchronous generation cannot be replaced by inverter-based resources without new forms of grid support. TenneT has identified a requirement for 70 STATCOM units across Germany’s 4 transmission system operators during the coming decade. Research presented at the CIGRE 2025 International Symposium found that grid-forming E-STATCOM systems outperformed synchronous condensers in damping sub-synchronous resonance, controlling transient overvoltage, and improving response speed in wind-farm settings. Grid-forming equipment can therefore address voltage stability and fast power response within the same operating framework. This capability is likely to influence future tender specifications, where operators need support under both normal operating conditions and grid disturbances.
Cross-Border Power Transmission Expansion Creates New Procurement Cycles
The STATCOM market gains opportunities when cross-border links require converter stations and long transmission routes to manage voltage. Hitachi Energy received a EUR 770 million contract, equal to USD 832 million at the cited mid-2026 conversion rate, from Terna and STEG for the ELMED HVDC converter stations between Italy and Tunisia. The project represents the first direct-current electricity interconnection between Europe and North Africa. Thailand’s EGAT signed a July 2026 contract for a STATCOM at Khlong Ngae Substation that is linked to future power trading with Malaysia. The ASEAN Power Grid is creating a similar requirement for reactive-power equipment at connection points across Southeast Asia. These projects extend procurement beyond domestic renewable interconnections and place voltage control within the design of international power corridors.
Restraints Impact Analysis of STATCOM Market*
| Restraint | (~) % Impact on CAGR Forecast | Geographic Relevance | Impact Timeline |
|---|---|---|---|
| High Capital and Installation Costs | -1.9% | Global | Short term (≤ 2 years) |
| Complex Grid Integration Requirements | -1.2% | Global | Medium term (2-4 years) |
| Power Electronics Supply Chain Constraints | -0.8% | North America and Europe | Short term (≤ 2 years) |
| Lengthy Procurement and Qualification Cycles | -0.5% | Global | Medium term (2-4 years) |
| Source: Mordor Intelligence | |||
High Capital and Installation Costs Limit Deployment Velocity
High capital and installation costs can delay deployment in the STATCOM market, particularly for smaller distribution utilities and operators in emerging economies. Standalone transmission-scale units involve substantial costs per kVAr, while hybrid E-STATCOM systems carry a 30% to 50% premium. A 300 MVAr installation was estimated at USD 20 million to USD 30 million before site preparation, civil works, and grid integration studies. These costs can place reactive-power investments outside annual utility budgets even when the underlying network requirement is clear. The cited outlook expects silicon-carbide adoption to reduce system-level pricing by 10% to 15% in real terms by 2032. Near-term financial pressure is more likely to postpone procurement than remove the need for voltage-support equipment.
Complex Grid Integration Requirements Extend Project Timelines
Grid integration can extend the time required to bring STATCOM projects into service. Commissioning requires harmonic impedance analysis, protection relay coordination, and control system tuning before energization. IEEE Standard 519-2022 sets a total harmonic distortion voltage limit of 1.5% above 161 kV, which requires harmonic filter sizing and validation under different grid conditions. The cited analysis states that compliance testing can add 2 to 3 months, while wider network studies can extend the pre-energization period by 6 to 12 months after contract signing. Grid-forming controls also need to operate correctly with existing transmission-operator energy-management and protection systems during both normal operation and faults. This engineering work can slow installations even when equipment, funding, and grid need are already in place.
*Our forecasts treat driver/restraint impacts as directional, not additive. The impact forecasts reflect baseline growth, mix effects, and variable interactions.
STATCOM Market Segment Analysis
By Technology Type:
MMC Topologies Lead as Grid-Forming Variants ExpandMMC and other multilevel VSC topologies held 39.47% of revenue in 2026. Their position reflects an ability to provide near-sinusoidal waveforms without external harmonic filters and to scale across a broad range of reactive-power ratings. The modular arrangement allows suppliers to configure systems for large transmission substations as well as lower-rated applications. This flexibility is important where transmission operators need equipment that can fit established site designs and support different grid conditions. MMC platforms also form the base architecture for newer systems that add fast active-power support. Their established operating record gives them a strong position in projects where control quality and delivery confidence carry substantial weight.
Grid-Forming STATCOM and E-STATCOM are projected to grow at a 9.47% CAGR from 2027 to 2032. These systems combine an MMC converter core with supercapacitor banks that can inject or absorb active power within milliseconds. The arrangement addresses the shortage of synthetic inertia in grids with increasing inverter-based generation. A 2025 IEEE NAPS study also described how supercapacitors on the direct-current bus of a double-wye MMC can provide reactive and active power buffering on a single platform. Conventional VSC-based STATCOM and medium-voltage distribution equipment remain relevant where grid-forming capability is not a contractual requirement.



By Reactive Power Rating:
Transmission Scale Anchors Value While Distribution Demand RisesLarge-Scale Transmission STATCOM held 46.83% of revenue in 2026. The STATCOM market segment benefits from high contract values at transmission nodes where retiring conventional generators leave gaps in voltage support. Individual projects include equipment, engineering, network studies, and commissioning, which can create values in the tens of millions of U.S. dollars. Transmission operators also need dedicated compensation at locations where renewable power enters the network or where power flows cross large distances. Germany’s requirement for 70 units across its 4 transmission operators shows the structured need that can develop at this scale. Medium-scale installations serve wind and solar interconnections in the 20 MVAr to 100 MVAr range and face competition from a wider group of suppliers.
Small-Scale Distribution and Industrial STATCOM is projected to grow at a 9.38% CAGR from 2027 to 2032. Data centers, electric-vehicle fast-charging hubs, and variable-speed industrial drives can introduce harmonics and reactive-power swings into distribution networks. These networks were not designed to absorb such fluctuating loads at the emerging scale. EPRI identified enhanced STATCOM systems as a tiered mitigation option for data centers that generate inter-harmonics capable of triggering sub-synchronous oscillations at nearby generation plants. This evaluation shifts the discussion from isolated engineering cases to a recognized response to commercial load-related power-quality concerns. The STATCOM market segment can therefore draw demand from commercial facilities as well as traditional industrial and utility buyers.
By Application:
Data Centers Become a Faster-Growing End UseTransmission and Grid Infrastructure accounted for 33.76% of revenue in 2026. The STATCOM market segment leads by value because a single transmission installation can require substantial investment before associated site and integration work. Large projects support renewable interconnections, stabilize critical grid nodes, and replace voltage regulation previously provided by conventional generation. Their scale creates high equipment and engineering content for each award. Renewable Energy Integration and Industrial and Manufacturing provide additional demand across utilities and process industries. Railway Electrification and other applications also benefit from rail expansion programs in Europe and Asia-Pacific.
Data Centers and Commercial Infrastructure are projected to grow at a 9.54% CAGR from 2027 to 2032. Artificial-intelligence training loads create sharp changes in power demand as graphics-processing workloads rise and fall. This pattern can create power-quality conditions that standard uninterruptible-power systems do not address at the grid interconnection point. E-STATCOM systems can provide sub-millisecond active and reactive power response, making them relevant to these load changes. EPRI formally evaluated enhanced STATCOM systems for data-center load-fluctuation mitigation in October 2026. The assessment supports the movement of this application from early technical discussion toward procurement consideration by commercial operators.

By Component:
Digital Control Systems Gain Importance Alongside Converter ValvesPower Electronic Converter Valves held 36.58% of revenue in 2026. The STATCOM market segment reflects the cost and technical importance of custom IGBT and silicon-carbide valve assemblies used across STATCOM configurations. These assemblies determine the system’s ability to switch power rapidly and control reactive output under changing grid conditions. Their supply depends on specialized semiconductor manufacturing capacity, which can constrain equipment availability. This bottleneck can extend delivery schedules in major markets and affect the broader STATCOM industry. Converter transformers, reactors, capacitors, and harmonic filters are increasingly standardized, while cooling and auxiliary systems are becoming more modular.
Control, Protection, and Monitoring Systems are projected to grow at a 9.41% CAGR from 2027 to 2032. Grid-forming control, predictive condition monitoring, and AI-integrated diagnostics increase the value of software and digital hardware within each installation. GE Vernova announced a new engineering and test laboratory in Noida in May 2025 to validate control systems for VSC STATCOM valves.[2] The investment shows that suppliers are treating control performance as a product differentiator, rather than a supporting feature. Digital service platforms can also provide remote monitoring and recurring aftermarket activity through the operating life of equipment. This raises the relative importance of controls and monitoring compared with passive hardware.
Geography Analysis
North America
North America accounted for 37.24% of revenue in 2026. The region has a large renewable pipeline and a regulatory setting that places dynamic reactive-power capability within the generation-interconnection process. FERC Order No. 2023 requires that capability for new U.S. generation projects. The input cited more than 1,200 GW of proposed renewable capacity in U.S. interconnection queues, with 30% to 40% requiring dedicated reactive-power compensation. LS Power Grid California energized North America’s largest STATCOM installation at Orchard Substation in March 2025, creating a reference point for CAISO grid operations. Hitachi Energy invested USD 10 million in a Power Electronics Center in Cary, North Carolina, in April 2026 to expand engineering, testing, and system integration capacity. Canada’s wind-heavy provincial grids and Mexico’s expanding renewable capacity can add related demand as voltage-support procurement is incorporated into renewable project budgets.
Asia-Pacific
Asia-Pacific is projected to grow at a 9.52% CAGR from 2027 to 2032. China’s SGCC planned RMB 4 trillion (USD 575.5 billion) in fixed-asset investment under the 15th Five-Year Plan. The plan represents a 40% increase from the preceding five-year period and prioritizes ultra-high-voltage corridors and cross-provincial power transfer. China added 349.8 GW of photovoltaic capacity in 2025, while India added 55.9 GW, underscoring the need for voltage support at connection substations. Hyosung Heavy Industries’ 1 GVar MMC STATCOM order for KEPCO in South Korea shows that demand extends beyond China and India to established regional grid systems. Large transmission programs and rapid additions of renewable capacity give the Asia-Pacific STATCOM market a broad base of utility-led demand.
Diverging Grid Ambitions Across Remaining Markets
Europe’s pipeline is shaped by retirements of coal and nuclear capacity in Germany, France, the United Kingdom, and Italy. TenneT’s stated requirement for 70 units across Germany’s 4 transmission operators gives unusual visibility into the scale of European demand. Siemens Energy commissioned a ±600 Mvar grid-forming STATCOM at Amprion’s Rheinau substation in January 2026.[3] In Thailand, EGAT’s Khlong Ngae project supports voltage stability and planned cross-border trading with Malaysia through the ASEAN Power Grid. Middle East, Africa, and South America markets are moving toward more structured procurement as transmission investment grows. L&T secured SCADA and STATCOM orders in India, the UAE, and Oman worth up to USD 570 million during September 2025. The ELMED HVDC link between Italy and Tunisia can create related reactive-power needs at its converter stations.
Competitive Landscape
Market Concentration
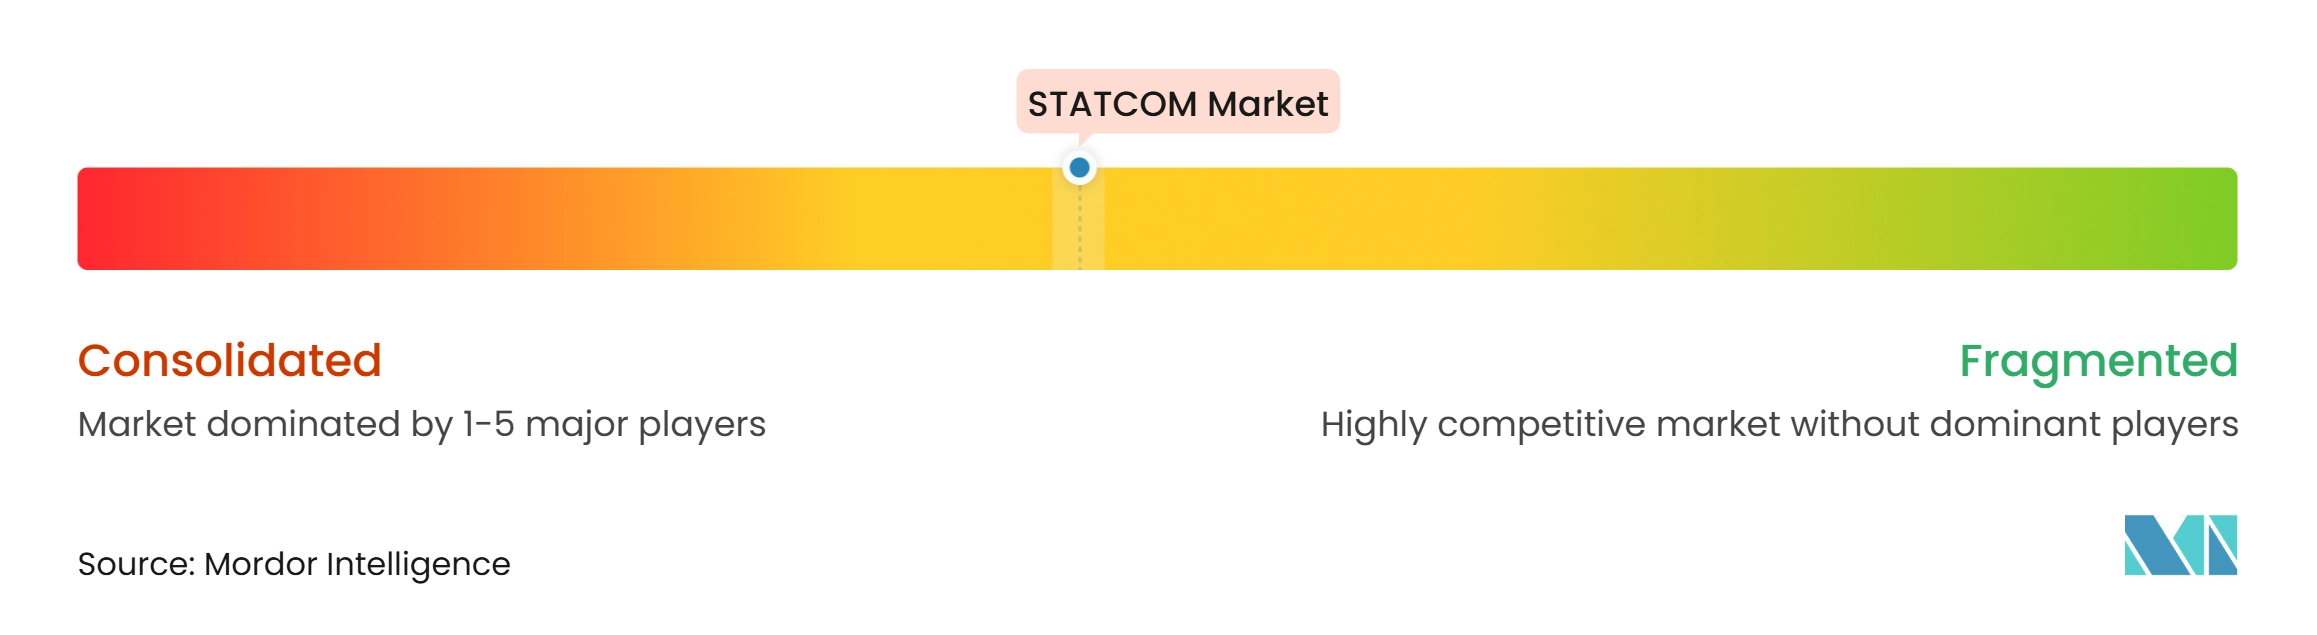
The STATCOM market is moderately consolidated on the transmission scale. Hitachi Energy, Siemens Energy, GE Vernova, and ABB compete for the largest awards by leveraging proprietary MMC control platforms, vertically integrated manufacturing, and established relationships with transmission operators. Their offers commonly cover network studies, harmonic filter design, civil works supervision, commissioning, and the power electronics equipment itself. This full-scope approach matters where operators require a supplier to take responsibility for system performance from design through energization. Siemens Energy’s January 2026 commissioning of the ±600 Mvar grid-forming installation at Rheinau demonstrates the ability of major suppliers to deliver advanced compensation systems for transmission customers.
Hyosung Heavy Industries emerged as a transmission-scale challenger after securing a 1 GVar MMC STATCOM order from KEPCO for the Shinokcheon substation in March 2026. The project was described as the world’s largest single STATCOM unit and indicates that regional manufacturers with strong MMC capabilities can compete for very large contracts. The company also signed a January 2026 memorandum of understanding with Skeleton Technologies and Marubeni to develop e-STATCOM technology for commercialization by 2027. GE Vernova announced a USD 16 million investment in a VSC STATCOM valve line in Chennai and a Noida engineering and test laboratory during May 2025. These moves show competition within the STATCOM market centered on manufacturing capacity, testing capability, and grid-forming technology.
Distribution and industrial applications are more fragmented than transmission projects. Sieyuan Electric, NR Electric, Merus Power, Ingeteam, and TBEA compete where domestic-content requirements and cost sensitivity can weaken the position of global suppliers. An important opening in the STATCOM market is grid-forming E-STATCOM equipment for AI data centers and smaller units at electric-vehicle fast-charging hubs. A 2025 U.S. patent describes a medium-voltage data-center STATCOM architecture that can provide active and reactive power without a conventional transformer stage.
STATCOM Industry Leaders
-
Hitachi Energy Ltd.
-
Siemens Energy AG
-
GE Vernova Inc.
-
ABB Ltd.
-
Mitsubishi Electric Corporation
- *Disclaimer: Major Players sorted in no particular order
STATCOM Market Companies Covered in this Report
- Hitachi Energy Ltd.
- Siemens Energy AG
- GE Vernova Inc.
- ABB Ltd.
- Mitsubishi Electric Corporation
- Toshiba Energy Systems & Solutions Corporation
- Hyosung Heavy Industries Corporation
- American Superconductor Corporation (AMSC)
- NR Electric Co., Ltd.
- Sieyuan Electric Co., Ltd.
- Ingeteam S.A.
- JEMA Energy S.A.
- Nidec Conversion
- TBEA Co., Ltd.
- Merus Power Plc
Recent Industry Developments in STATCOM Market
- July 2026: The Electricity Generating Authority of Thailand, EGAT, signed a procurement and construction contract with Sinohydro Thailand Co., Ltd. for a STATCOM at Khlong Ngae Substation, Songkhla Province, scheduled for completion in 2028. The installation will stabilize voltage across western and southern Thailand, accommodate fluctuations in large-scale renewable energy, and facilitate cross-border electricity trading with Malaysia via the ASEAN Power Grid.
- June 2026: Hitachi Energy received a contract worth EUR 770 million (USD 832 million) at the cited mid-2026 conversion rate from Italy’s Terna and Tunisia’s STEG for the ELMED HVDC converter stations. The project is the first direct-current electricity interconnection between Europe and North Africa, with 600 MW of transmission capacity over 220 km of mostly submarine cable.
- April 2026: Hitachi Energy invested USD 10 million to establish a Power Electronics Centre in Cary, North Carolina, bringing engineering, testing, and system-integration capabilities on-site for major energy projects across North America. The facility targets shorter delivery timelines for STATCOM, HVDC, and related grid infrastructure equipment in a region where FERC-driven interconnection reform is generating multi-year procurement backlogs.
- March 2026: Hyosung Heavy Industries secured a contract from Korea Electric Power Corporation, KEPCO, for a 1 GVar MMC STATCOM at Shinokcheon substation in South Korea. The unit can control the power used simultaneously by 300,000 households and stabilize transmission between the Honam region and the Seoul metropolitan area as renewable capacity expands.
Global STATCOM Market Report Scope
The STATCOM market comprises the production, supply, and deployment of static synchronous compensators (STATCOMs), which are power electronic devices used to regulate voltage and improve power quality in electrical transmission and distribution networks. STATCOM systems provide dynamic reactive power compensation, enhance grid stability, and support the integration of renewable energy sources.
The STATCOM Market Report is Segmented by Technology Type (Modular Multilevel Converter (MMC) and Other Multilevel VSC Topologies, Conventional Voltage Source Converter (VSC)-Based STATCOM, Grid-Forming STATCOM / E-STATCOM, and Medium-Voltage and Distribution STATCOM), Reactive Power Rating (Large-Scale Transmission STATCOM, Medium-Scale STATCOM, and Small-Scale Distribution and Industrial STATCOM), Application (Transmission and Grid Infrastructure, Renewable Energy Integration, Industrial and Manufacturing, Data Centers and Commercial Infrastructure, and Railway Electrification and Other Applications), Component (Power Electronic Converter Valves, Converter Transformers and Reactors, Capacitors and Harmonic Filters, Control, Protection, and Monitoring Systems, and Cooling Systems and Auxiliary Components), and Geography (North America, Europe, Asia-Pacific, and Rest of the World). The Market Forecasts are Provided in Terms of Value (USD).
Segmentation Overview
| Modular Multilevel Converter (MMC) and Other Multilevel VSC Topologies |
| Conventional Voltage Source Converter (VSC)-Based STATCOM |
| Grid-Forming STATCOM / E-STATCOM |
| Medium-Voltage and Distribution STATCOM |
| Large-Scale Transmission STATCOM |
| Medium-Scale STATCOM |
| Small-Scale Distribution and Industrial STATCOM |
| Transmission and Grid Infrastructure |
| Renewable Energy Integration |
| Industrial and Manufacturing |
| Data Centers and Commercial Infrastructure |
| Railway Electrification and Other Applications |
| Power Electronic Converter Valves |
| Converter Transformers and Reactors |
| Capacitors and Harmonic Filters |
| Control, Protection, and Monitoring Systems |
| Cooling Systems and Auxiliary Components |
| North America | United States |
| Canada | |
| Mexico | |
| Europe | Germany |
| United Kingdom | |
| France | |
| Italy | |
| Rest of Europe | |
| Asia-Pacific | China |
| Japan | |
| South Korea | |
| Taiwan | |
| India | |
| Rest of Asia-Pacific | |
| Rest of the World |
| By Technology Type | Modular Multilevel Converter (MMC) and Other Multilevel VSC Topologies | |
| Conventional Voltage Source Converter (VSC)-Based STATCOM | ||
| Grid-Forming STATCOM / E-STATCOM | ||
| Medium-Voltage and Distribution STATCOM | ||
| By Reactive Power Rating | Large-Scale Transmission STATCOM | |
| Medium-Scale STATCOM | ||
| Small-Scale Distribution and Industrial STATCOM | ||
| By Application | Transmission and Grid Infrastructure | |
| Renewable Energy Integration | ||
| Industrial and Manufacturing | ||
| Data Centers and Commercial Infrastructure | ||
| Railway Electrification and Other Applications | ||
| By Component | Power Electronic Converter Valves | |
| Converter Transformers and Reactors | ||
| Capacitors and Harmonic Filters | ||
| Control, Protection, and Monitoring Systems | ||
| Cooling Systems and Auxiliary Components | ||
| By Geography | North America | United States |
| Canada | ||
| Mexico | ||
| Europe | Germany | |
| United Kingdom | ||
| France | ||
| Italy | ||
| Rest of Europe | ||
| Asia-Pacific | China | |
| Japan | ||
| South Korea | ||
| Taiwan | ||
| India | ||
| Rest of Asia-Pacific | ||
| Rest of the World | ||
Key Questions Answered in the Report
What is the size of the STATCOM market?
The STATCOM market was valued at USD 2.25 billion in 2026 and is estimated to reach USD 3.79 billion by 2032, at an 8.85% CAGR from 2027 to 2032.
What is driving demand for STATCOM systems?
Renewable integration, grid modernization, the retirement of synchronous generation, and cross-border power links are increasing the need for dynamic voltage and reactive power support.
Which STATCOM technology is growing fastest?
Grid-Forming STATCOM and E-STATCOM are projected to grow at a 9.47% CAGR through 2032 because they can provide reactive power control and fast active power response.
Which application is expanding fastest for STATCOM equipment?
Data Centers and Commercial Infrastructure is projected to grow at a 9.54% CAGR through 2032 as fluctuating computing loads create power-quality requirements.
Which region is expected to grow fastest?
Asia-Pacific is projected to expand at a 9.52% CAGR through 2032, supported by transmission investment and major additions in renewable capacity.
What limits faster deployment of STATCOM systems?
High equipment and installation costs, complex integration work, constrained power-electronics supply, and long qualification cycles can delay projects.