
Sports Facilities Market Size and Share
Market Overview
| Study Period | 2020 - 2031 |
|---|---|
| Market Size (2026) | USD 208.38 Billion |
| Market Size (2031) | USD 581.53 Billion |
| Growth Rate (2026 - 2031) | 22.78 % |
| Fastest Growing Market | Middle East |
| Largest Market | North America |
| Market Concentration | Medium |
Major Players *Disclaimer: Major Players sorted in no particular order Image © Mordor Intelligence. Reuse requires attribution under CC BY 4.0. | |
Sports Facilities Market Analysis by Mordor Intelligence
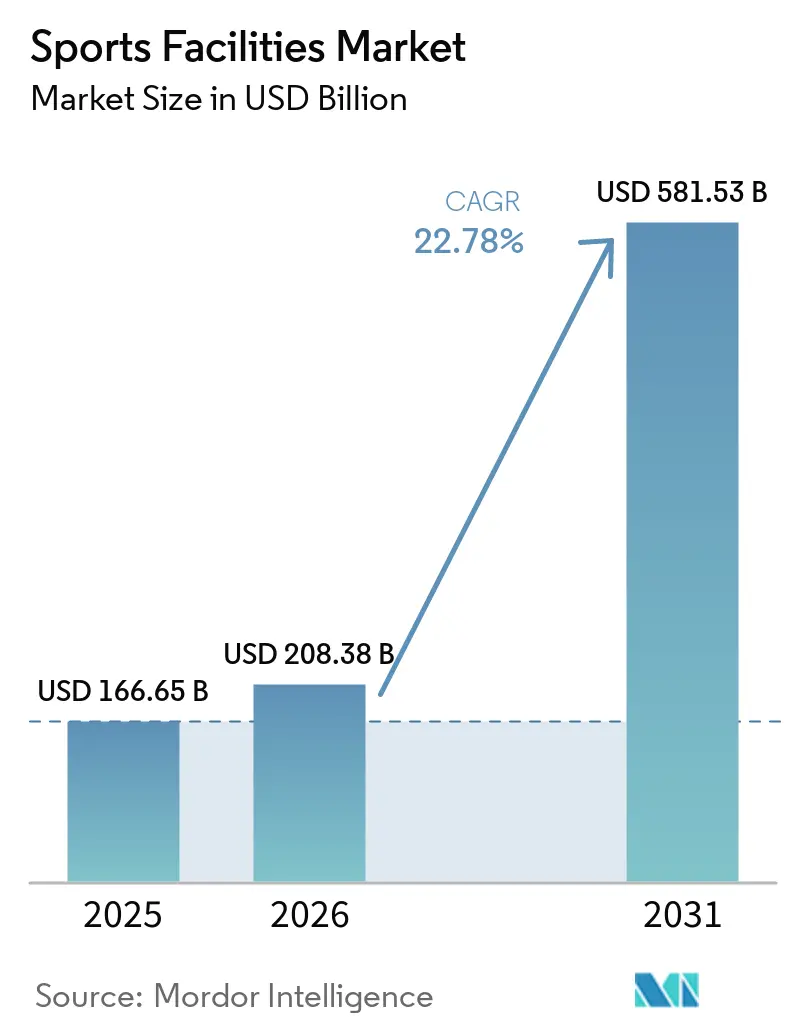
The sports facilities market size was valued at USD 166.65 billion in 2025 and estimated to expand from USD 208.38 billion in 2026 to reach USD 581.53 billion by 2031, at a CAGR of 22.78% during the forecast period (2026-2031). Major event pipelines, public investment programs, and stronger participation are increasing demand for new venues and upgrades. Governments increasingly treat facilities as long-term urban, tourism, and economic infrastructure. Deferred reinvestment by professional leagues is adding to this demand. Synthetic and hybrid surfaces are changing project specifications across professional and community venues. Financing conditions, construction costs, regulations, and tight delivery schedules will shape which planned projects reach completion.
Key Report Takeaways
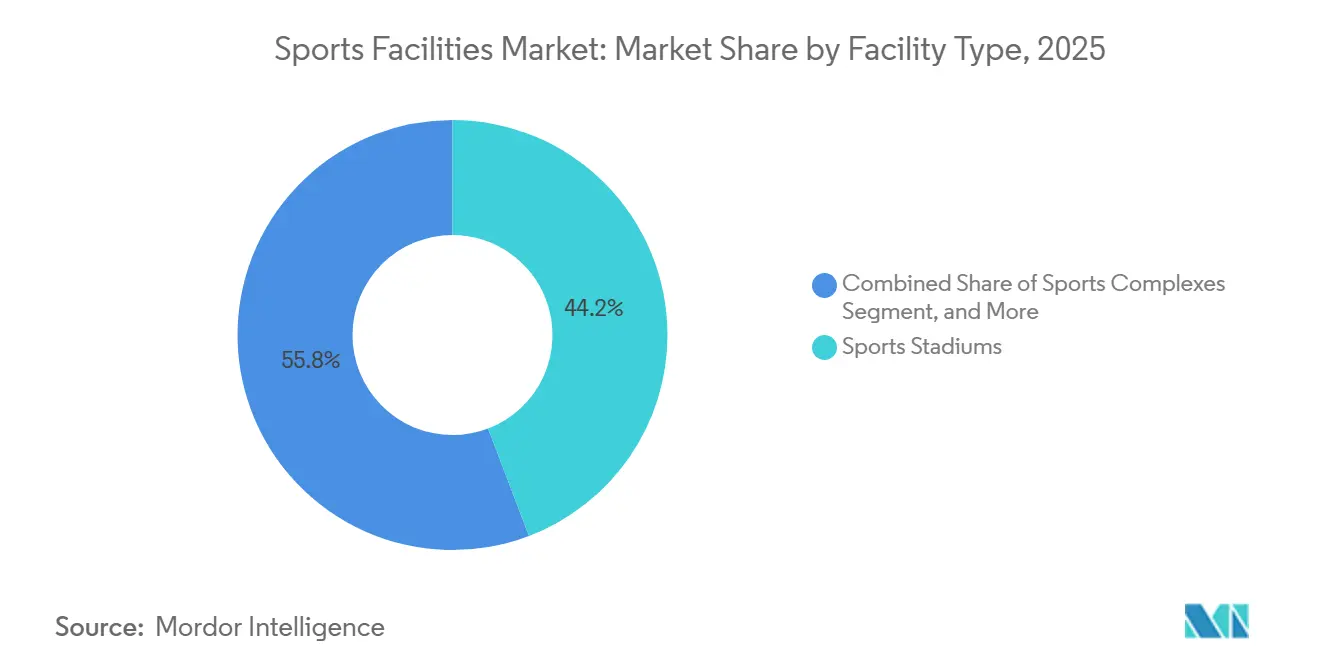
- By facility type, sports stadiums held 44.21% of the global sports facilities market share in 2025, while hybrid turf is projected to expand at a 23.38% CAGR through 2031.
- By sport type, football and soccer accounted for 37.29% of the sports facilities market in 2025, while cricket is projected to expand at a 23.97% CAGR through 2031.
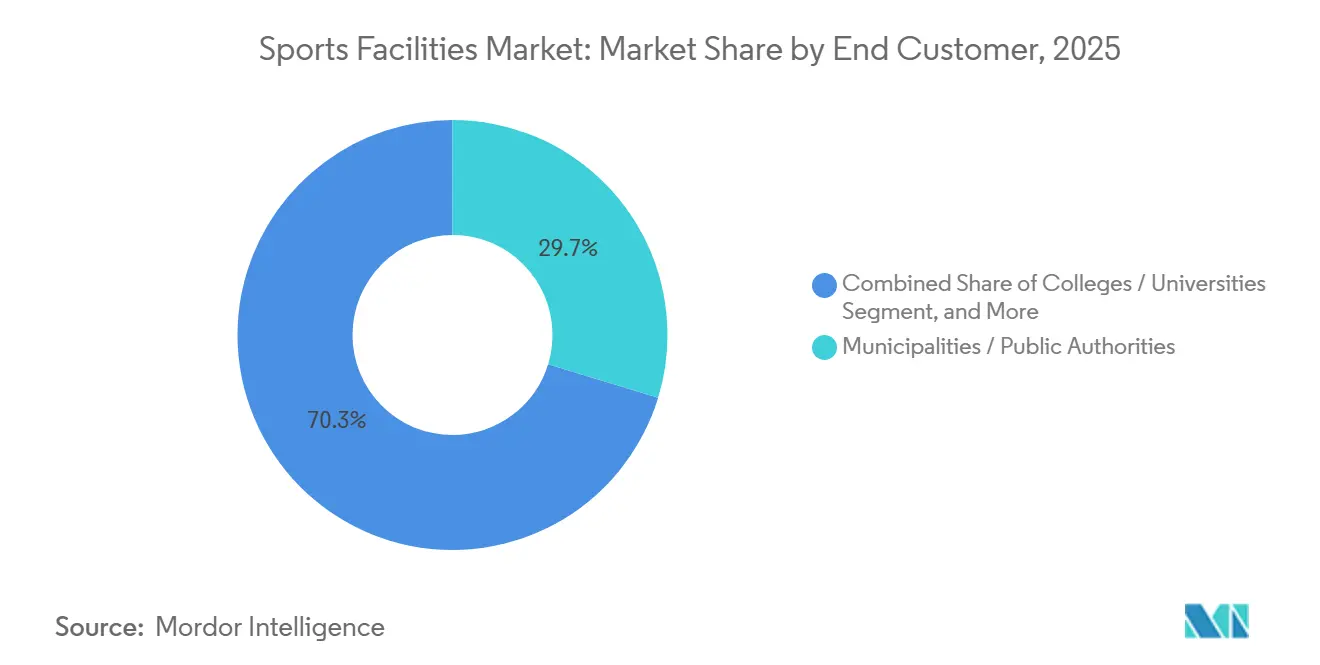
- By the end of 2025, municipalities and public authorities held 29.71% of the sports facilities market, while clubs are projected to expand at a 23.76% CAGR through 2031.
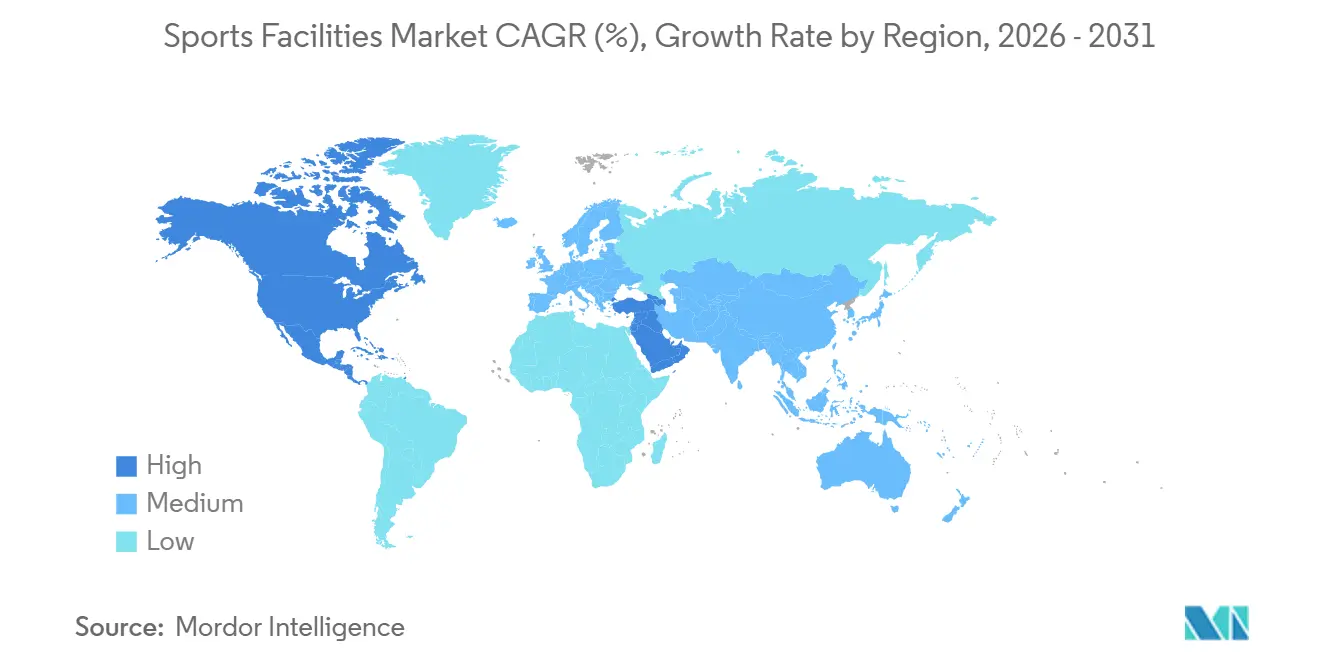
- By geography, North America held 49.71% of the global sports facilities market in 2025, while the Middle East is projected to expand at a 23.64% CAGR through 2031.
Note: Market size and forecast figures in this report are generated using Mordor Intelligence’s proprietary estimation framework, updated with the latest available data and insights as of January 2026.
Global Sports Facilities Market Trends and Insights
Drivers Impact Analysis*
| Driver | (~) % Impact on CAGR Forecast | Geographic Relevance | Impact Timeline |
|---|---|---|---|
| Sports Participation and Organized Sports | +6.5% | Global | Short term (≤ 2 years) |
| Government and Private Sports Infrastructure Investment | +5.8% | Global, concentrated in the Middle East and North America | Medium term (2-4 years) |
| Professional and Elite Sports Facility Expansion | +4.2% | North America, Europe, and the Middle East | Medium term (2-4 years) |
| Educational and Community Sports Infrastructure Development | +3.5% | North America and Europe | Medium term (2-4 years) |
| Synthetic and Hybrid Playing Surface Adoption | +2.8% | Global, led by Europe and North America | Short term (≤ 2 years) |
| Aging Sports Surface Replacement and Upgrades | +2.2% | North America and Europe | Short term (≤ 2 years) |
| Source: Mordor Intelligence | |||
Growth in Sports Participation and Organized Sports
Participation is creating demand for facilities that are less dependent on single events or league construction cycles. In 2024, 247.1 million Americans took part in at least 1 sport or fitness activity. That figure represented 80% of the tracked population and the highest rate recorded by the Sports and Fitness Industry Association. Active participants increased by 25.4 million from 2019. Youth participation also remained important because 65% of Americans aged 6-17 played sports at least once in 2024. The sports facilities market, therefore, needs more accessible courts, pitches, training space, and multipurpose venues as organized participation spreads.[1]Sports and Fitness Industry Association, “SFIA’s Topline Participation Report Shows 247.1 Million Americans Were Active in 2024,” SFIA, sfia.org
Government and Private Investment in Sports Infrastructure
Government-backed capital is driving several large-scale projects in the sports facilities market. Saudi Arabia is actively expanding its sports sector and has identified priority investment opportunities to support the development of stadiums, training centers, and related sports infrastructure. The country’s preparations for the FIFA World Cup include the construction of new stadiums in multiple host cities, along with broader investments in venue modernization and supporting infrastructure. These initiatives reflect Saudi Arabia’s commitment to strengthening its position as a global sports destination and supporting the long-term growth of its sports economy. In addition, FIFA and the Saudi Fund for Development have agreed to provide concessional financing for the construction and renovation of sports facilities in developing countries, thereby further supporting international sports infrastructure development.
Expansion of Professional and Elite Sports Facilities
Professional sports teams are consolidating previously deferred venue investments into a shorter development and construction cycle. Across the United States and Canada, a substantial pipeline of sports facility projects is scheduled for completion in the near term, reflecting increased investment in modern stadiums, multipurpose venues, and supporting infrastructure. Major-league stadium developments represent a significant share of this spending, including new facilities planned for the Buffalo Bills and Inter Miami CF. Preparations for the upcoming FIFA World Cup are also driving additional investment in venue upgrades, operational infrastructure, and tournament-specific improvements. At the same time, elite venue specifications are expanding beyond major professional stadiums to include MLS, college, and high school facilities. For example, TenCate’s Hellas Construction completed synthetic turf perimeter systems at SoFi Stadium and AT&T Stadium to support tournament requirements. These developments highlight the broader adoption of high-performance facility standards across multiple levels of sports infrastructure.
Development of Educational and Community Sports Infrastructure
Universities and communities are making facility decisions that are separate from professional sports cycles. University College Dublin began an EUR 87 million (USD 94 million) expansion at its Belfield campus in July 2025. Cornell University broke ground on the USD 68.7 million Meinig Fieldhouse in October 2024. The University of Maine committed USD 170 million to its Athletics Facilities Master Plan. Greenville County Schools approved USD 24 million to convert 15 high-school football fields to artificial turf. These projects show how enrollment, student experience, weather resilience, and public health goals support demand in the sports facilities market.
Restraints Impact Analysis*
| Restraint | (~) % Impact on CAGR Forecast | Geographic Relevance | Impact Timleine |
|---|---|---|---|
| High Installation and Maintenance Costs | -1.6% | Global, most acute in community and grassroots segments | Short term (≤ 2 years) |
| Land and Infrastructure Constraints | -1.2% | Asia-Pacific, with spillover to urban North America and Europe | Medium term (2-4 years) |
| Surface Lifecycle and Replacement Costs | -0.9% | North America and Europe | Short term (≤ 2 years) |
| Fragmented Facility-Level Data Availability | -0.5% | Global | Long term (≥ 4 years) |
| Source: Mordor Intelligence | |||
High Installation and Maintenance Costs
Upfront funding constrains artificial and hybrid turf projects, particularly for schools, community organizations, and local sports facilities with limited capital budgets. Synthetic turf requires a higher initial investment than natural grass, creating a barrier for organizations focused on short-term affordability. Although artificial turf reduces routine maintenance needs, project sponsors must account for periodic resurfacing and replacement costs. Natural grass fields require lower initial capital expenditure but involve higher ongoing costs for irrigation, mowing, fertilization, repairs, and field management. These cost differences complicate investment decisions when available funding cannot support the initial capital required for synthetic or hybrid surfaces. As a result, planned field upgrades, community sports developments, and school facility projects may be delayed.
Land and Infrastructure Constraints
Site availability limits the development of new sports facilities in dense cities and developing markets. Land acquisition can equal or exceed construction costs in high-density locations. Developers then favor retrofits and multipurpose renovations instead of new builds. In developing markets, drainage, power, and transport gaps increase budgets and extend delivery schedules. Community concerns about PFAS exposure and urban heat effects can lengthen permitting for synthetic turf projects. These issues leave a gap between stated demand and completed projects across the sports facilities market.
*Our forecasts treat driver/restraint impacts as directional, not additive. The impact forecasts reflect baseline growth, mix effects, and variable interactions.
Segment Analysis
By Facility Type: Stadiums Anchor Revenue and Hybrid Surfaces Change the Mix
Sports stadiums held 44.21% of the global sports facilities market in 2025. The position reflected the high capital requirements of professional venues and major public projects. Hybrid turf is projected to expand at a 23.38% CAGR from 2026 to 2031. Stadium operators are selecting these surfaces to support athlete performance under heavy use. They also need to host concerts, exhibitions, and other non-sport events. SIS Pitches reported a 44% year-over-year increase in hybrid pitch installations, led by Premier League demand. BMO Field installed a SIS Grass Hybrid shallow-stitch system in 2025 for MLS, CFL, and 2026 FIFA World Cup matches.
Sports complexes serve training academies, multi-sport institutions, and sports-city projects. Saudi developments in Jeddah and Makkah are supporting demand for multipurpose facilities. The others category includes indoor courts, athletics tracks, golf courses, and aquatic centers. Each of those assets follows its own sport-specific investment cycle. The USTA’s self-funded USD 800 million renovation of the Billie Jean King National Tennis Center shows the value within this category. The project is the organization’s largest single investment. It also shows that lower-volume categories can still contain large, specialized projects.



By Sport Type: Football and Soccer Lead While Cricket Broadens Its Footprint
Football and soccer represented 37.29% of the sports facilities market in 2025. Grassroots pitch volumes and investment in elite venues supported that leading position. FIFA Forward approved more than 1,600 projects in its first 6 years; around 1/3 of those projects involved football infrastructure. The projects included technical centers and stadiums. This spending has supported venues across football-focused markets in Europe, North America, and the Middle East, while keeping the sports facilities market linked to federation-led technical centers, competition venues, and local participation facilities. It also strengthens the pipeline for facilities that comply with established federation standards.[2]Fédération Internationale de Football Association, “FIFA Forward Report,” FIFA, fifa.com
Cricket is projected to expand at a 23.97% CAGR from 2026 to 2031. The ICC’s expansion approach is creating new facility needs in markets such as the United States, Japan, and Germany. The ICC reported a USD 543 million surplus in 2025, compared with USD 474 million in 2024. It designated funds for a Strategic Investment Fund that supports infrastructure among associate members. Ireland is developing a permanent stadium at Abbottstown before the 2030 Men’s T20 World Cup. Rugby upgrades are linked to the upcoming Lions and Rugby World Cup schedules. Golf course retrofits are drawing attention as operators consider drought-resistant, lower-maintenance turf systems.
By End Customer: Public Authorities Lead While Clubs Expand
Municipalities and public authorities accounted for 29.71% of the sports facilities market in 2025. They fund public complexes, school fields, parks with multipurpose pitches, and athletics tracks. Policy mandates often connect this spending to health, well-being, and economic objectives. Saudi Arabia’s Quality of Life Program treats sports infrastructure as part of citizen well-being and economic diversification. This model is informing public-sector frameworks in other Gulf Cooperation Council states. Public procurement, therefore, remains important to the near-term project pipeline.
Clubs are projected to expand at a 23.76% CAGR from 2026 to 2031. Professional and semi-professional teams are investing in their own training facilities. These sites combine hybrid surfaces, sports science resources, and connected field monitoring. Ownership reduces reliance on rented municipal venues and supports year-round player development. Colleges and universities remain a high-value institutional customer group. Community organizations and academies favor cost-optimized installations of synthetic and natural grass. Budget constraints make their projects dependent on grants, bond financing, and philanthropic support.
Geography Analysis
North America held 49.71% of the global sports facilities market share in 2025. The region combines a high concentration of professional leagues, college athletics, and public-private financing for major venues. Sports facility projects scheduled for completion in the United States and Canada represent substantial investment, with major-league stadium openings accounting for a notable portion of the total. The longer-term project pipeline also remains extensive. Hybrid surfaces are increasingly being adopted in MLS training and match environments.
Europe’s facility pipeline is shaped by Premier League surface innovation and ongoing football maintenance needs. Belgium and the Netherlands co-hosted the FIH Hockey World Cup 2026. Polytan installed Poligras turf at Wagener Stadium in Amsterdam and Belfius Hockey Arena in Wavre. The FIH renewed all 11 Preferred Turf Suppliers for the 2026-2028 cycle. Polytan and Igoid-UCLM completed a FIFA-certified sustainable artificial turf pitch in Toledo, Spain. Ireland is also developing a permanent cricket stadium for the 2030 T20 World Cup.[3]International Hockey Federation, “All FIH Preferred Turf and Field Suppliers Renewed for Another 3-Year Cycle,” International Hockey Federation, fih.hockey
The Middle East is projected to expand at a 23.64% CAGR from 2026 to 2031, placing the sports facilities market there among the most active regional construction programs during the forecast period. Saudi Arabia is the region’s primary source of stadium demand. Its World Cup plan includes several new stadiums and renovated venues, supported by substantial stadium-related investment. The Ministry of Sport opened major sports cities to private investors under renewable contracts during the study period. Other Gulf states are adding sports complexes, academies, and event-related upgrades.

Competitive Landscape
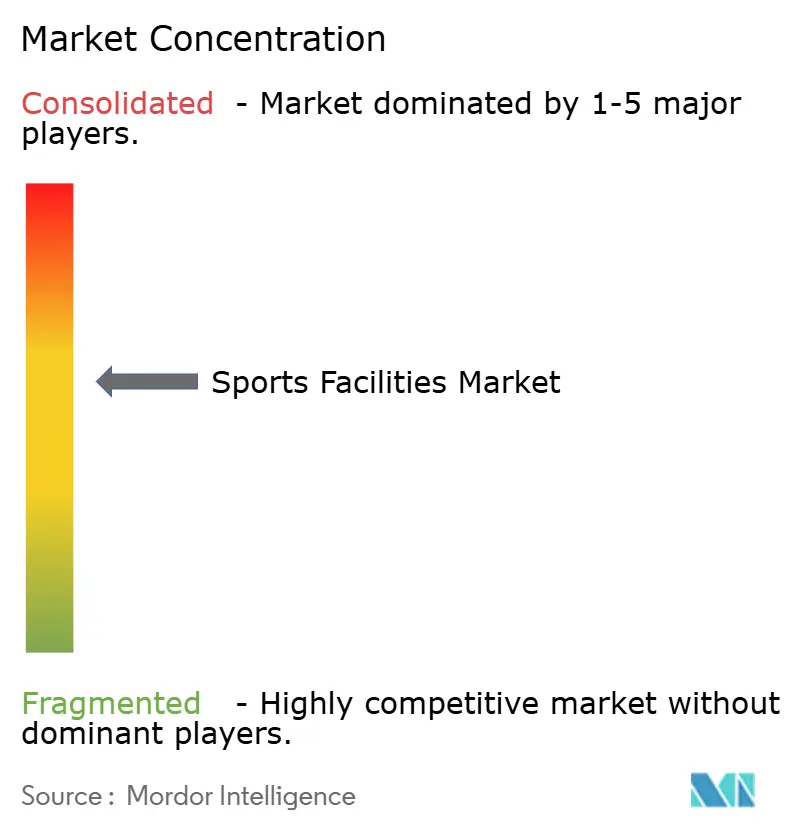
The sports facilities market is moderately concentrated in synthetic and hybrid turf technology, manufacturing, and certification. TenCate Grass Group, Sport Group, and Tarkett Sports hold leading positions in FIFA and FIH-certified installations. TenCate reported more than 24,500 synthetic fields installed worldwide in 2026. The company also reported more than 600 FIFA-certified installations across 100 countries. Regional installers and construction firms remain fragmented and compete on pricing, location, and procurement relationships. This split makes project delivery less concentrated than surface technology and manufacturing.
Vertical integration has become a key competitive strategy in the sports facilities market, particularly when suppliers can manage surface selection, installation quality, and scheduled maintenance under a single operating model. Tarkett Sports acquired 5 United States construction businesses in March 2025. The acquisitions added design, installation, and maintenance capacity. TenCate Grass acquired shares in Sports and Leisure Group from Sun Capital Partners in June 2025. Polytan entered a Spanish partnership with Compograss in May 2026. These moves strengthen manufacturing reach, field installation capacity, and long-term maintenance services.[4]Polytan, “Polytan and Compograss Launch Partnership in Spain,” Polytan, polytan.com
Non-infill and bio-based systems are creating room for differentiated offerings. TenCate’s Pure PT system became the first non-infill artificial turf to receive FIFA certification in July 2026. The system was installed at training facilities used by Arsenal FC, Manchester City FC, and Olympique Marseille. FIFA and FIH standards continue to favor suppliers with established certification capabilities. Act Global Americas completed a synthetic turf project at Purdue University in July 2026. TenCate is also using movement data from more than 1,000 college and professional athletes in Pivot Performance Turf development.
Sports Facilities Industry Leaders
TenCate Grass Group B.V.
FieldTurf USA, Inc.
Polytan GmbH
Limonta Sport S.p.A.
Hellas Construction, Inc.
- *Disclaimer: Major Players sorted in no particular order

Recent Industry Developments
- July 2026: enCate's Pure PT™ system became the first non-infill artificial turf to achieve FIFA certification under the FIFA Quality Programme for Football Turf, enabling pitches to be used up to step 3 of the FA National League System in the UK and advancing the adoption of PFAS-free, infill-free surface solutions globally. The system has been installed at training facilities of Arsenal FC, Manchester City FC, Olympique Marseille, Real Valladolid, and PSV.
- July 2026: Act Global Americas completed the installation of 85,000 sq ft of synthetic turf at Purdue University's Mollenkopf Athletic Center, delivered on an accelerated timeline. The project marked Act Global's 2nd synthetic turf installation at Purdue and strengthened its collegiate reference portfolio in North America.
- June 2026: TenCate's Hellas Construction division completed synthetic turf run-off and perimeter systems at SoFi Stadium in Los Angeles and AT&T Stadium in Arlington, Texas for the FIFA World Cup 2026, demonstrating TenCate's vertically integrated manufacturing-to-installation model at the event.
- May 2026: Hellas Construction installed 282,500 sq ft of zero-infill Pivot Performance Turf across 5 new fields at the New Territory Sports Complex in Fort Bend County, Texas, serving soccer, lacrosse, flag football, and multi-sport use.


Global Sports Facilities Market Report Scope
The sports facilities market refers to the market for the development, construction, ownership, operation, maintenance, renovation, and upgrading of dedicated physical infrastructure used for organized, recreational, educational, and community-based sports activities. It encompasses facilities designed to host sporting events, provide training and practice environments, and support participation in both professional and amateur sports.
The Sports Facilities Market Report is Segmented by Facility Type (Sports Stadiums, Sports Complexes, and Others), Sport Type (Football/Soccer, Cricket, Rugby, Tennis, Golf, and Other Sports), End Customer (Colleges/Universities, Municipalities/Public Authorities, Grassroots/Community Sports, Sports Academies and Training Centers, and Clubs), and Geography (North America, Europe, Middle East, and Other Regions). The Market Forecasts are Provided in Terms of Value (USD).
| Sports Stadiums | Natural Grass |
| Synthetic / Artificial Turf | |
| Hybrid Turf | |
| Sports Complexes | |
| Other Facilities |
| Football / Soccer |
| Cricket |
| Rugby |
| Tennis |
| Golf |
| Other Sports |
| Colleges / Universities |
| Municipalities / Public Authorities |
| Grassroots / Community Sports |
| Sports Academies and Training Centers |
| Clubs |
| North America | United States |
| Europe | United Kingdom |
| Middle East | Saudi Arabia |
| United Arab Emirates | |
| Qatar | |
| Other GCC Countries | |
| Other Regions |
| By Facility Type | Sports Stadiums | Natural Grass |
| Synthetic / Artificial Turf | ||
| Hybrid Turf | ||
| Sports Complexes | ||
| Other Facilities | ||
| By Sport Type | Football / Soccer | |
| Cricket | ||
| Rugby | ||
| Tennis | ||
| Golf | ||
| Other Sports | ||
| By End Customer | Colleges / Universities | |
| Municipalities / Public Authorities | ||
| Grassroots / Community Sports | ||
| Sports Academies and Training Centers | ||
| Clubs | ||
| By Geography | North America | United States |
| Europe | United Kingdom | |
| Middle East | Saudi Arabia | |
| United Arab Emirates | ||
| Qatar | ||
| Other GCC Countries | ||
| Other Regions | ||


Key Questions Answered in the Report
What is the sports facilities market size?
The sports facilities market size is estimated at USD 208.38 billion in 2026 and is forecast to reach USD 581.53 billion by 2031, at a 22.78% CAGR.
Which facility type leads global spending?
Sports stadiums led with 44.21% of global revenue in 2025. Hybrid turf is projected to expand at a 23.38% CAGR through 2031.
Which sport creates the strongest facility demand?
Football and soccer led with 37.29% of 2025 revenue, while cricket is projected to expand at a 23.97% CAGR through 2031.
Which customer group spends most on sports facilities?
Municipalities and public authorities accounted for 29.71% of 2025 revenue. Clubs are projected to expand at a 23.76% CAGR through 2031.
Which region leads sports facility investment?
North America held 49.71% of the global total in 2025. The Middle East is projected to expand at a 23.64% CAGR through 2031.
What factors can delay sports facility projects?
High upfront costs, replacement costs, limited land, enabling infrastructure gaps, and longer permitting can delay projects.
Page last updated on:





