
Spinal Non-Fusion Devices Market Size and Share
Market Overview
| Study Period | 2020 - 2031 |
|---|---|
| Market Size (2026) | USD 4.03 Billion |
| Market Size (2031) | USD 5.03 Billion |
| Growth Rate (2026 - 2031) | 4.58 % |
| Fastest Growing Market | Asia Pacific |
| Largest Market | North America |
| Market Concentration | Medium |
Major Players *Disclaimer: Major Players sorted in no particular order Image © Mordor Intelligence. Reuse requires attribution under CC BY 4.0. | |
Spinal Non-Fusion Devices Market Analysis by Mordor Intelligence
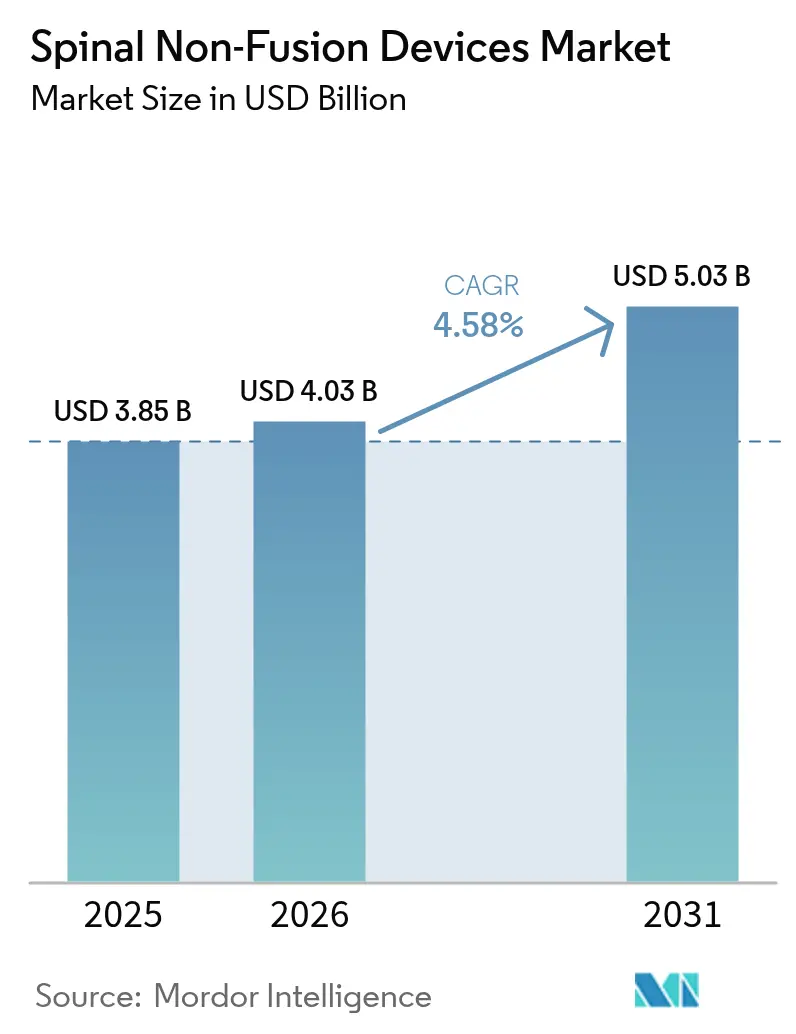
The spinal non-fusion devices market size in 2026 is estimated at USD 4.03 billion, growing from 2025 value of USD 3.85 billion with 2031 projections showing USD 5.03 billion, growing at 4.58% CAGR over 2026-2031. This measured trajectory reflects a decisive transition from experimental implants to validated motion-preservation technologies that address the long-term limitations of conventional fusion. Artificial intelligence now optimizes patient-specific implant geometry, streamlining pre-operative planning and cutting operating-room time, a shift that amplifies surgeon confidence in the spinal non-fusion devices market. North America currently anchors revenue, yet multi-layer policy reforms and infrastructure investment across Asia-Pacific are positioning that region as the next growth engine for the spinal non-fusion devices market. Hospitals remain the dominant purchasers, but ambulatory surgical centers (ASCs) are rapidly expanding demand as reimbursement policies move spine surgery to outpatient settings, reshaping procurement priorities throughout the spinal non-fusion devices market. Intensifying consolidation—illustrated by the Globus–NuVasive merger—confers scale advantages that accelerate development of AI-enabled surgical ecosystems, further redefining competitive dynamics within the spinal non-fusion devices market.
Key Report Takeaways
- By product category, artificial cervical discs held 34.62% of the spinal non-fusion devices market share in 2025, while nucleus and annulus repair implants are projected to expand at a 6.39% CAGR to 2031.
- By surgery type, minimally invasive procedures captured 64.77% of the spinal non-fusion devices market size in 2025 and are advancing at a 5.92% CAGR through 2031.
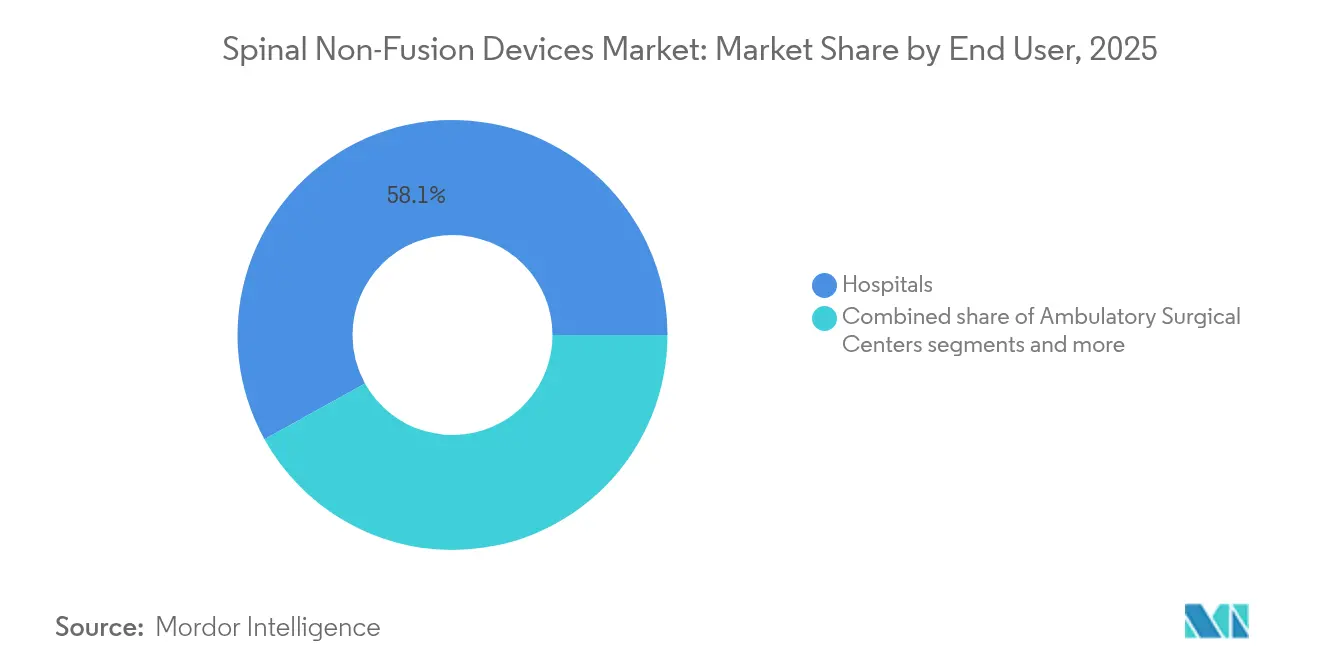
- By end user, hospitals controlled 58.05% revenue share in 2025, whereas ASCs posted the highest projected growth at 10.21% CAGR to 2031.
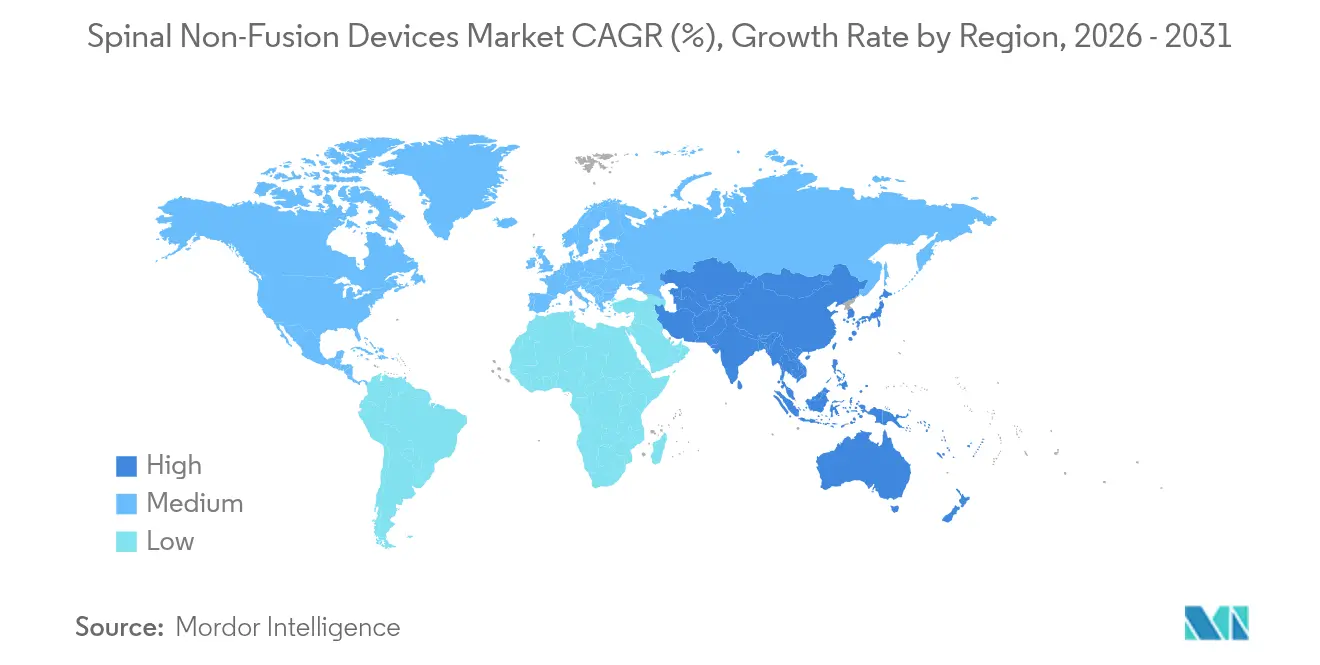
- By geography, North America led with 41.74% revenue in 2025; Asia-Pacific is set to grow at a 5.68% CAGR between 2026 and 2031.
Note: Market size and forecast figures in this report are generated using Mordor Intelligence’s proprietary estimation framework, updated with the latest available data and insights as of 2026.
Market Trends and Insights
Drivers Impact Analysis of Spinal Non-Fusion Devices Market*
| Driver | (~) % Impact on CAGR Forecast | Geographic Relevance | Impact Timeline |
|---|---|---|---|
| Shift toward motion-preserving spinal surgeries | +1.2% | Global, with North America & Europe leading adoption | Medium term (2-4 years) |
| Rising prevalence of degenerative disc diseases | +0.8% | Global, with aging populations in developed markets | Long term (≥ 4 years) |
| Rapid adoption of minimally-invasive dynamic stabilizers | +1.0% | North America & APAC core, spill-over to Europe | Short term (≤ 2 years) |
| Reimbursement expansion for artificial disc replacement | +0.6% | North America & Europe, with selective APAC coverage | Medium term (2-4 years) |
| Growing venture funding for nucleus & annulus repair start-ups | +0.4% | North America & Europe innovation hubs | Long term (≥ 4 years) |
| AI-guided patient-specific implant design breakthroughs | +0.8% | Global, with early adoption in developed markets | Medium term (2-4 years) |
| Source: Mordor Intelligence | |||
Shift toward motion-preserving spinal surgeries
Clinical practice is moving decisively from fusion-first protocols to motion-preservation pathways. Prospective evidence shows anterior cervical hybrid constructs preserve 16.3° of segmental motion versus 4.7° in multilevel fusion, a functional edge that correlates with lower revision rates. Facet arthroplasty devices such as TOPS reported 93% patient satisfaction in FDA trials, reinforcing economic value despite higher up-front cost. Surgeon preference for physiologic kinematics is therefore translating into robust purchasing momentum across the spinal non-fusion devices market.
Rising prevalence of degenerative disc diseases
An aging global population is driving sustained procedural volume, with Medicare data predicting significant expansion in spinal instrumentation demand through 2050. Earlier imaging-driven diagnosis favors motion-preserving interventions before irreversible damage, enlarging the spinal non-fusion devices market. Younger cohorts also value implants that minimize the need for later revision, intensifying long-run demand.
Rapid adoption of minimally invasive dynamic stabilizers
Robotics-guided navigation achieves 96.99% pedicle-screw accuracy, cutting peri-operative risk and lowering learning curves for dynamic stabilization[1]Source: Oh B-K et al., “Robotic-Assisted Spine Surgery Accuracy,” e-neurospine.org . Nitinol spring rods deliver a 16.9% adjacent segment disease rate over 13 years, outperforming rigid fixation and bolstering uptake in the spinal non-fusion devices market. The synergy of robotics and flexible hardware supports premium pricing and broader surgeon adoption.
Reimbursement expansion for artificial disc replacement
Medicare and private payors are broadening coverage for cervical disc replacement, with local coverage determinations reclassifying the procedure from experimental to medically necessary for defined indications[2]Source: Centers for Medicare & Medicaid Services, “LCD – Cervical Fusion,” cms.gov . Cost-effectiveness models show lower cumulative expenditure versus fusion, which accelerates adoption across the motion preservation devices market. Lumbar coverage lags but is trending upward as additional trial data become available.
Restraints Impact Analysis of Spinal Non-Fusion Devices Market*
| Restraint | (~) % Impact on CAGR Forecast | Geographic Relevance | Impact Timeline |
|---|---|---|---|
| High device cost & limited hospital budgets | -1.8% | Global, with acute pressure in emerging markets | Short term (≤ 2 years) |
| Stringent multi-region regulatory approval timelines | -0.9% | Global, with varying regional complexity | Medium term (2-4 years) |
| Payer reluctance toward lumbar disc replacement reimbursement | -0.7% | North America & Europe primarily | Medium term (2-4 years) |
| Supply-chain dependence on specialty Nitinol alloys | -0.6% | Global manufacturing networks | Short term (≤ 2 years) |
| Source: Mordor Intelligence | |||
High device cost & limited hospital budgets
Hospitals face 20% jumps in shipping, labor and raw-material expenses, leading to tighter capital allocation that slows premium implant adoption. France’s reimbursement cuts for orthopedic hardware underscore mounting price pressure, dampening near-term volume in the spinal non-fusion devices market.
Stringent multi-region regulatory approval timelines
Regulators require expansive trial evidence across diverse cohorts. The HYDRAFIL pivotal study exemplifies the multi-year pathway facing novel regenerative implants, delaying market entry for small innovators . Prolonged timelines elevate development expense, curbing agility in the spinal non-fusion devices market.
*Our forecasts treat driver/restraint impacts as directional, not additive. The impact forecasts reflect baseline growth, mix effects, and variable interactions.
Spinal Non-Fusion Devices Market Segment Analysis
By Product:
Cervical Dominance Meets Regenerative InnovationArtificial cervical discs captured 34.62% revenue in 2025 and remain the anchor of the spinal non-fusion devices market. Long-term data on Mobi-C show lower adjacent-segment pathology compared with fusion, reinforcing surgeon preference. The spinal non-fusion devices market size for artificial cervical discs stood at USD 1.33 billion in 2025 and is expanding steadily at a mid-single-digit rate.
Nucleus and annulus repair implants are on track for a 6.39% CAGR through 2031, reflecting regenerative-medicine traction and growing funding. Their share of the spinal non-fusion devices market size is set to rise as clinical trials confirm sustained disc-height restoration. Dynamic stabilization systems hold notable share through biomechanical superiority, whereas interspinous spacers lag amid mixed coverage decisions. Facet joint replacements and other emerging devices contribute incrementally but hold long-run upside as evidence builds.




By Surgery Type:
Minimally Invasive Procedures AccelerateMinimally invasive surgery held 64.77% of the spinal non-fusion devices market size in 2025 and is forecast at a 5.92% CAGR owing to robotics-guided workflows that minimize collateral tissue damage. Navigation systems that cut radiation exposure reinforce the safety narrative and boost surgeon comfort, catalyzing broader use across routine cases.
Open procedures retain importance for complex deformity corrections but will continue ceding share. Device makers are redesigning implants for faster placement and same-day discharge, capabilities now essential for winning in the spinal non-fusion devices market.
By End User:
ASC Growth Reshapes Delivery ModelsHospitals controlled 58.05% of 2025 revenue because they handle multi-level pathologies and trauma requiring hybrid constructs. Their volume guarantees baseline demand across the spinal non-fusion devices market.
ASCs, however, are growing at a 10.21% CAGR as payors shift appropriate procedures to outpatient settings, boosting throughput for motion-preserving implants. Specialized spine clinics embedded in the ASC channel are turning into preference centers for premium non-fusion devices, influencing future product development and marketing strategies.
Geography Analysis
North America Spinal Non-Fusion Devices Market
North America delivered 41.74% revenue in 2025 on the back of mature reimbursement and high surgeon training density. FDA clearances, such as the VELYS Spine platform, highlight continual integration of implants with navigation and robotics ecosystems. Coverage refinements around cervical disc replacement further secure volume growth, keeping the spinal non-fusion devices market buoyant.
APAC Spinal Non-Fusion Devices Market
Asia-Pacific is poised for the fastest regional CAGR of 5.68% through 2031, propelled by demographic aging and infrastructure upgrades. China’s streamlined device-registration catalogue accelerates time-to-market, enlarging the spinal non-fusion devices market in a nation where hospital build-outs remain strong. Japan’s adoption of advanced robotics and its super-aged society create robust demand, though clinical-evidence expectations remain rigorous.
EMEA and South America Spinal Non-Fusion Devices Market
Europe faces intensified cost-containment but continues to drive steady, evidence-based uptake. CE pathways for regenerative implants demonstrate regulatory openness, yet national budget caps may slow early-stage adoption. South America and Middle East & Africa present long-term opportunities as private hospital chains invest in advanced spine suites, although current volumes remain modest due to affordability and workforce constraints.

Regulatory Landscape
In the United States, spinal motion-preservation and dynamic stabilization technologies are governed primarily through FDA pathways that emphasize robust preclinical performance testing and well-defined indications, with the agency maintaining specific guidance for Spinal System 510(k)s and for the preparation of IDEs for spinal systems. This framework keeps clinical evidence requirements and labeling scrutiny high for novel non-fusion concepts, while allowing incremental iterations of established device classes to move through more standardized submissions.
In Europe, EU MDR classification and evidence requirements continue to be a decisive gate for implantable spine technologies. In March 2026, the European Commission adopted delegated regulations C(2026) 1798 and C(2026) 1809 expanding the list of Well-Established Technologies (WET) to include certain spinal posterior fixation systems, which can reduce documentation burden for mature device categories. In April 2026, MDCG guidance updates clarified Rule 8 concepts such as what constitutes "spinal column contact" and reinforced classification treatment for specific components (for example, spinal rod hooks as Class IIb implantable devices), reducing ambiguity that previously complicated conformity assessment planning. Across regions, baseline test and quality expectations are still anchored by standards such as ISO 12189:2008 for fatigue testing of spinal implant assemblies, which also underpins verification work for motion-preservation constructs.
Value Chain Analysis
The value chain starts with specialized raw materials and precision components (for example, specialty alloys and polymers) and moves into design and engineering, verification testing, and regulated manufacturing under quality systems suitable for implantable devices. Differentiation often depends on access to specialized capabilities such as proprietary surface modification and advanced manufacturing, with supply agreements supporting these inputs (for example, PcoMed-type surface technology arrangements used by spine OEMs). Because motion-preservation implants must demonstrate durability under cyclic loading, preclinical testing and documentation form a critical midstream step that affects time-to-market and cost.
Commercialization typically relies on direct sales forces, distributor networks, and hospital and ASC contracting, with surgeon training and procedure-support infrastructure as key adoption enablers. Consolidation and portfolio acquisition have become a practical route to scale in established non-fusion categories, illustrated by Companion Spine LLCs July 2025 definitive agreement to acquire Paradigm Spine GmbH and the Coflex interlaminar stabilization and CoFix product lines from Xtant Medical Holdings. Distribution models are also shifting toward partner-led commercialization to broaden coverage and reduce operating burden, including April 2026 when SpineGuard completed a U.S. asset transfer and entered an exclusive distribution arrangement with Omnia Medical for the PediGuard line, separating design and manufacturing responsibilities from U.S. commercial operations.
Competitive Landscape
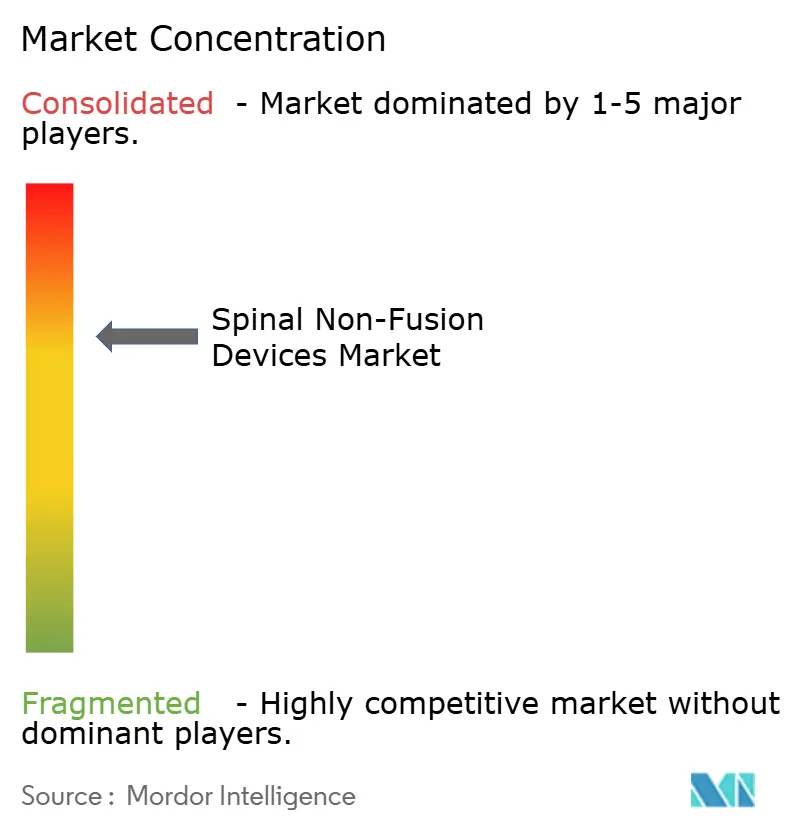
The spinal non-fusion devices market is moderately consolidated. Globus Medical’s post-merger revenue surge to USD 606.7 million in Q1 2024 underscores how scale unlocks synergies between implants, navigation and robotics. Stryker’s strategic exit from its legacy spine-implant business while retaining digital-surgery assets shows a pivot toward high-value platforms.
Incumbents are investing in nitinol supply chain control and AI-enhanced design, erecting high entry barriers. Venture-backed disruptors such as DiscGenics leverage regenerative-cell therapies and FDA RMAT designation to carve niches without direct hardware competition. Supply-chain volatility favors vertically integrated entities, and further mergers are anticipated as smaller firms struggle with rising regulatory-compliance costs.
Competitive strategy now centers on full-stack ecosystems that bundle implants, software, and robotic execution. Companies unable to assemble integrated offerings risk relegation to commodity tiers, narrowing margin headroom across the spinal non-fusion devices market.
Spinal Non-Fusion Devices Industry Leaders
Stryker Corporation
Zimmer Holdings Inc.
Johnson & Johnson
Medtronic PLC
B Braun Melsungen
- *Disclaimer: Major Players sorted in no particular order
Spinal Non-Fusion Devices Market Companies Covered in this Report
- Medtronic
- Stryker
- Johnson & Johnson
- NuVasive
- Globus Medical
- Centinel Spine
- B. Braun (Aesculap)
- Spineart
- RTI Surgical
- Exactech
- Stryker
- Orthofix
- Zimmer Biomet
- Alphatec Spine
- Boston Scientific

Market Opportunities and Future Outlook
Near-term whitespace is concentrated in expanding the breadth of clinically validated, reimbursable motion-preservation options beyond mature cervical disc arthroplasty, particularly for posterior and lumbar indications where payer scrutiny and long-term outcomes have historically limited routine adoption. The U.S. PMA pathway has already driven portfolio expansion: Companion Spine received FDA PMA for the DIAM Spinal Stabilization System in January 2026, and Synergy Spine Solutions received FDA PMA for the Synergy Disc in February 2026 for 1-level indications at C3-C7, with commercialization initiated in Spring 2026. With these approvals and the long-running evidence base for legacy cervical discs, hospitals and ambulatory settings can broaden procedural offerings when patient selection and coverage criteria are met.
Clinical evidence generation and ecosystem integration continue to shape purchasing behavior and competitive positioning. In June 2026, three-year results from the TOPS IDE study comparing lumbar facet arthroplasty to fusion for spondylolisthesis were published in the Journal of Neurosurgery: Spine, adding durability and comparative outcomes data that supports committee-level evaluation and protocol development. New trials also indicate where manufacturers are building evidence for unmet need, including Cousin Biotechs registration of a long-term assessment study for the BDyn dynamic stabilization device (NCT07580664) in April 2026 and Spinal Stabilization Technologies feasibility work for the PerQdisc (NCT06860867) initiated in January 2025. Alongside these programs, there is ongoing demand for workflow technologies that reduce operative time and variability for minimally invasive motion-preservation procedures, reinforcing the value of implants designed to integrate with the navigation and robotics platforms used in outpatient-capable spine pathways.
Recent Industry Developments in Spinal Non-Fusion Devices Market
- April 2026: Medtronic received CE mark in Europe for the Stealth AXiS surgical system for spine and cranial procedures. The approval expands Medtronics installed base opportunity for an integrated planning, navigation, and robotics workflow, supporting hospitals that are standardizing on platform-based spine surgery ecosystems.
- March 2026: Medtronic entered into a distribution agreement with Merit Medical Systems to offer the FDA-cleared ViaVerte system for basivertebral nerve ablation in chronic vertebrogenic lower-back pain. The distribution expands Medtronics procedural suite around spine care beyond implants, supporting its ability to bundle technologies across the patient pathway.
- November 2024: Globus Medical launched the ExcelsiusHub Navigation System to enhance surgical precision in spinal procedures. The navigation expansion reinforced Globus Medicals post-merger strategy of pairing implants with enabling technologies, raising the competitive bar for integrated motion-preservation and stabilization workflows.


Spinal Non-Fusion Devices Market Report Scope and Research Methodology
Market Definition and Coverage
For this study, the spinal non-fusion devices market covers revenue earned from motion-preserving spinal implants and related non-fusion systems used to stabilize or treat spine conditions without creating a permanent bony fusion.
Scope exclusions: We exclude spinal fusion implants and fixation hardware used primarily to fuse vertebrae, along with general surgical tools and hospital services.
Segments Covered in This Report
- By Product Type
- Artificial Cervical Disc
- Artificial Lumbar Disc
- Dynamic Stabilization Devices (Pedicle Screw/Rod)
- Interspinous Process Spacers
- Facet Joint Replacement
- Nucleus & Annulus Repair Implants
- Other Motion-Preservation Devices
- By End User
- Hospitals
- Ambulatory Surgical Centers
- Specialty Spine Clinics
- By Surgery Type
- Open Spine Surgery
- Minimally-Invasive Surgery
- By Geography
- North America
- United States
- Canada
- Mexico
- Europe
- Germany
- United Kingdom
- France
- Italy
- Spain
- Rest of Europe
- Asia-Pacific
- China
- India
- Japan
- South Korea
- Australia
- Rest of Asia-Pacific
- South America
- Brazil
- Argentina
- Rest of South America
- Middle East and Africa
- GCC
- South Africa
- Rest of Middle East and Africa
- North America
Data Sources, Market Sizing, and Validation
Desk Research
Desk work started with building a clear picture of procedure volumes, patient demand, and regulatory flow for motion-preserving spine care. We referred to public sources such as CDC/NCHS health statistics, OECD health data, Medicare coverage and payment rules, FDA device databases and safety notices, and clinical evidence published in peer-reviewed orthopedic and spine journals.
To translate those signals into a revenue model, we also reviewed company annual reports, investor presentations, earnings call remarks, and reputable medical press coverage around product launches and label expansions. When needed, we checked paid subscription sources for company financials and monitored news reporting through screening tools, and used a paid patent database to understand which device concepts are moving toward commercialization. These desk sources are illustrative, and many other public references were used for data collection, cross-checking, and clarifying open questions.
Primary Interviews and Surveys
Primary discussions were run with a mix of spine surgeons, hospital and ASC procurement teams, and device-side commercial and clinical experts, so that utilization, pricing, and adoption barriers could be validated in plain terms. For a global market like this, we also checked inputs across major regions, since reimbursement rules, procedure settings, and product mix differ by geography.
Distribution of primary research fieldwork respondents
| Company type | Respondent position | Region |
|---|---|---|
| Top tier: 36% | CXOs: 14% | APAC: 42% |
| Mid tier: 49% | Functional/Unit leaders: 30% | EMEA: 34% |
| Smaller Players: 15% | Managers: 56% | Americas: 24% |
Market-Sizing & Forecasting
The core sizing was built using a top-down approach where procedure volumes and treatable patient pools were reconstructed by region, then filtered through non-fusion adoption rates to arrive at device demand. Once that demand pool was in place, revenue was derived using average selling price bands that reflect product mix differences across cervical and lumbar use, and across hospital versus ASC settings.
To keep the totals realistic, we corroborated the outputs with selective bottom-up approximations such as sampled ASP times implied unit volumes from surgeon utilization patterns, channel checks on tender and contract behavior, and supplier roll-ups in markets where public reporting is clearer. Inputs that mattered most included spine surgery and degenerative disc disease caseload trends, age profile shifts, reimbursement direction for motion-preserving procedures, outpatient migration to ASCs, and observed replacement cycles for key implant categories. Forecasts were produced using scenario analysis tied to these drivers, then refined using expert consensus on adoption speed and pricing pressure, particularly in markets with tighter payer scrutiny. When data gaps showed up in smaller countries, we used proxy indicators like regional procedure benchmarks and population-adjusted prevalence, and re-tested those assumptions during interviews.
Data Validation & Update Cycle
Estimates were checked through multiple passes so that any outliers were spotted early, and the main assumptions stayed consistent with real-world clinical practice. We compared model outputs against independent signals like procedure growth rates, reimbursement updates, regulatory clearances, and disclosed revenue direction from publicly listed device players.
If large variances appeared, we isolated the drivers, volume, adoption, or ASP, then revisited and re-confirmed the relevant assumptions through follow-up calls. Before sign-off, another analyst review is completed to confirm calculations, currency conversions, and year mapping. The report is refreshed annually, and interim updates are made when material events occur, followed by a final review pass close to delivery so clients receive the most current view.
Mordor Intelligence's Spinal Non Fusion Devices Market Size Compared With Other Published Estimates
Published market values for spinal non-fusion devices can look different because the scope boundary is not identical across sources, and because pricing and adoption assumptions are updated at different times. We also see differences when one study anchors on procedures and treated cohorts, and another anchors on product category lists that may unintentionally mix in fusion-related items.
Procedure volume signals and motion-preservation adoption checks, supported by reimbursement pathways and product-mix pricing bands, are the evidence that keeps Mordor Intelligence aligned to a repeatable demand pool for non-fusion implants rather than broader spine hardware.
Benchmark comparison
| Source | Market Size | Gaps in Research Methodology |
|---|---|---|
| Mordor Intelligence | USD 4.03 B (2026) | |
| Global Consultancy A | USD 4.08 B (2024) | Uses an earlier base year and a different period structure, and its type list is narrower in places, which can shift the implied ASP and mix when compared to a 2026-aligned model. |
| Industry Publisher B | USD 4.20 B (2024) | Shows inconsistent year labeling across the narrative, and the segmentation framing can blur product boundaries, which increases the risk of scope drift and faster assumed growth. |
The benchmark spread is mostly explained by year alignment, product boundary choices, and how each source treats pricing and mix over time. By tying the value build to observable procedure demand and then pressure-testing adoption and ASP assumptions, the final number stays traceable to inputs that can be rechecked and updated in a consistent way.


Key Questions Answered in the Report
What is the current size and growth rate of the spinal non-fusion devices market?
The market stands at USD 4.03 billion in 2026 and is forecast to reach USD 5.03 billion by 2031, expanding at a 4.58% CAGR.
Which product dominates the spinal non-fusion devices market?
Artificial cervical discs lead with 34.62% revenue share, supported by well-documented clinical outcomes and solid reimbursement.
Why are ASCs significant for future device adoption?
ASCs are growing procedures at 10.21% CAGR to 2031 because payer policies favor outpatient spine surgery, increasing device turnover and shaping product design.
Which region presents the highest future growth opportunity?
Asia-Pacific is projected for the fastest CAGR at 5.68% due to demographic aging, regulatory harmonization, and expanding hospital infrastructure.
Page last updated on:





