Special Graphite Market Size and Share
Market Overview
| Study Period | 2021 - 2031 |
|---|---|
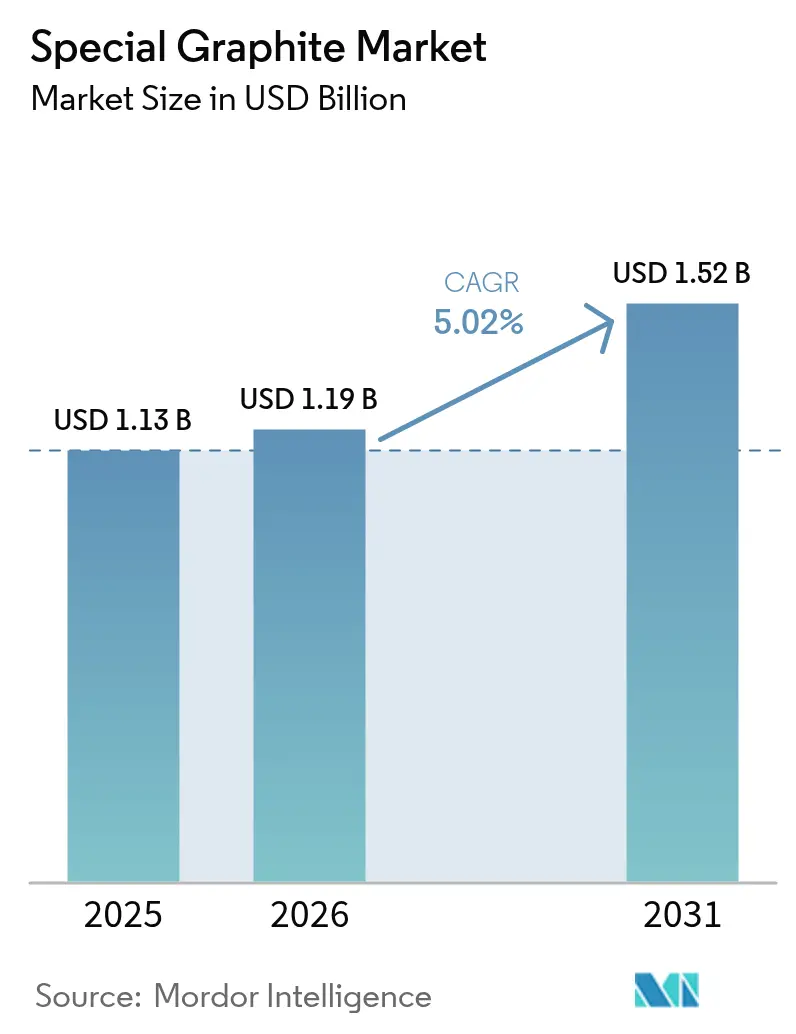
| Market Size (2026) | USD 1.19 Billion |
| Market Size (2031) | USD 1.52 Billion |
| Growth Rate (2026 - 2031) | 5.02% CAGR |
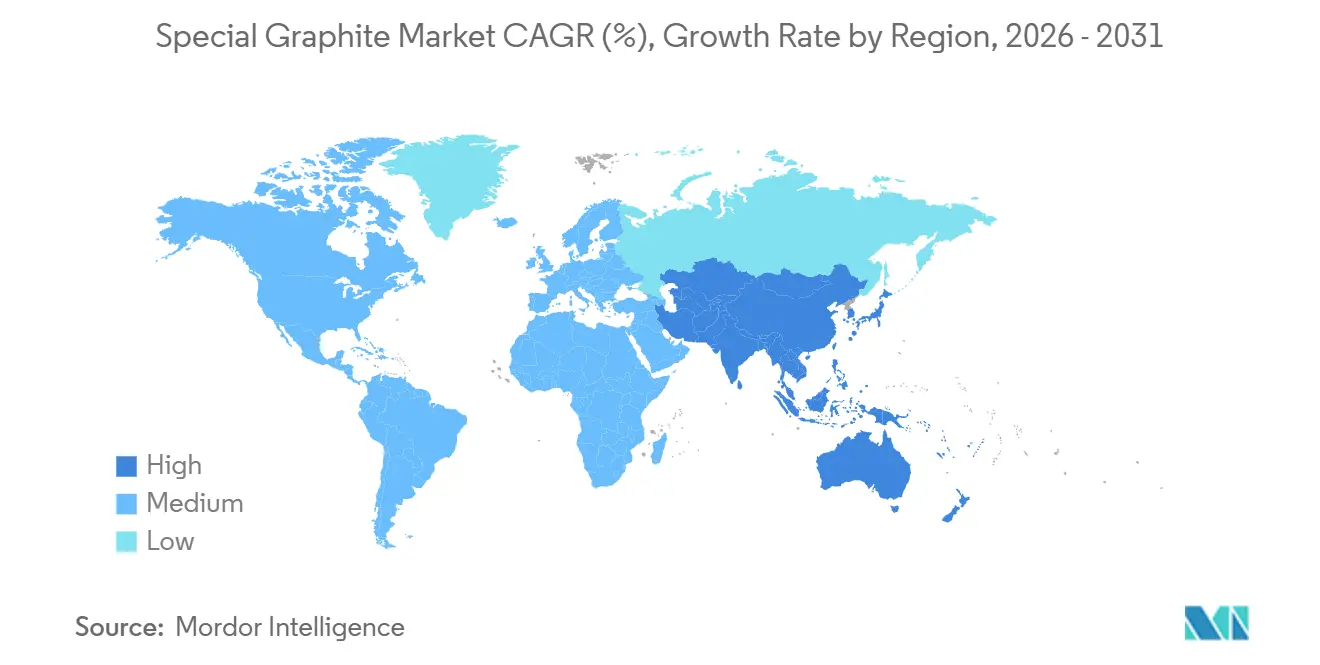
| Fastest Growing Market | Asia Pacific |
| Largest Market | Asia Pacific |
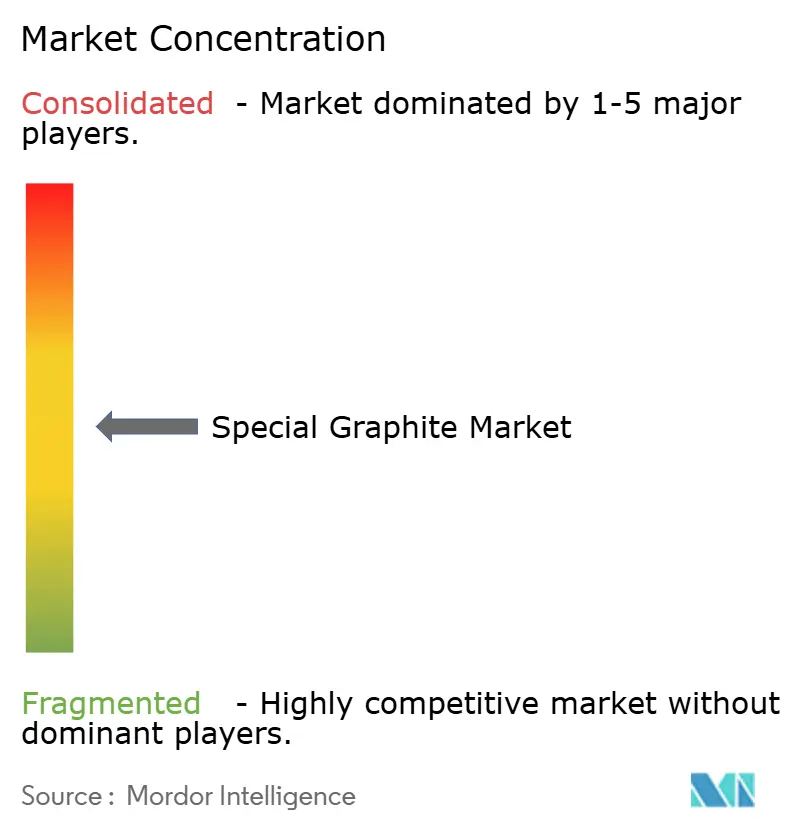
| Market Concentration | Medium |
Major Players *Disclaimer: Major Players sorted in no particular order Image © Mordor Intelligence. Reuse requires attribution under CC BY 4.0. | |
Special Graphite Market Analysis by Mordor Intelligence
The Special Graphite Market size is projected to be USD 1.13 billion in 2025, USD 1.19 billion in 2026, and reach USD 1.52 billion by 2031, growing at a CAGR of 5.02% from 2026 to 2031. Sovereign battery-content rules in the United States and European Union are splitting the global supply chain into a high-volume Chinese sphere and a premium-priced Western sphere, pushing Western automakers to pay 15-20% premiums for non-Chinese, fully traceable material. At the same time, Chinese refiners still control more than 95% of battery-grade processing capacity, giving them the ability to move spot prices by double-digit percentages within a single quarter. Midstream volatility therefore rewards vertically integrated companies that own both needle-coke feedstock and graphitization furnaces, while pure-play refiners remain exposed to feedstock spikes that reached USD 750 per tonne in early 2025 after a fire at a major Japanese calciner. Demand also benefits from the accelerating deployment of green-hydrogen electrolysers and 400 GW of new solar-wafer capacity in China, both of which require high-purity isotropic graphite parts capable of operating beyond 1,400 °C.
Key Report Takeaways
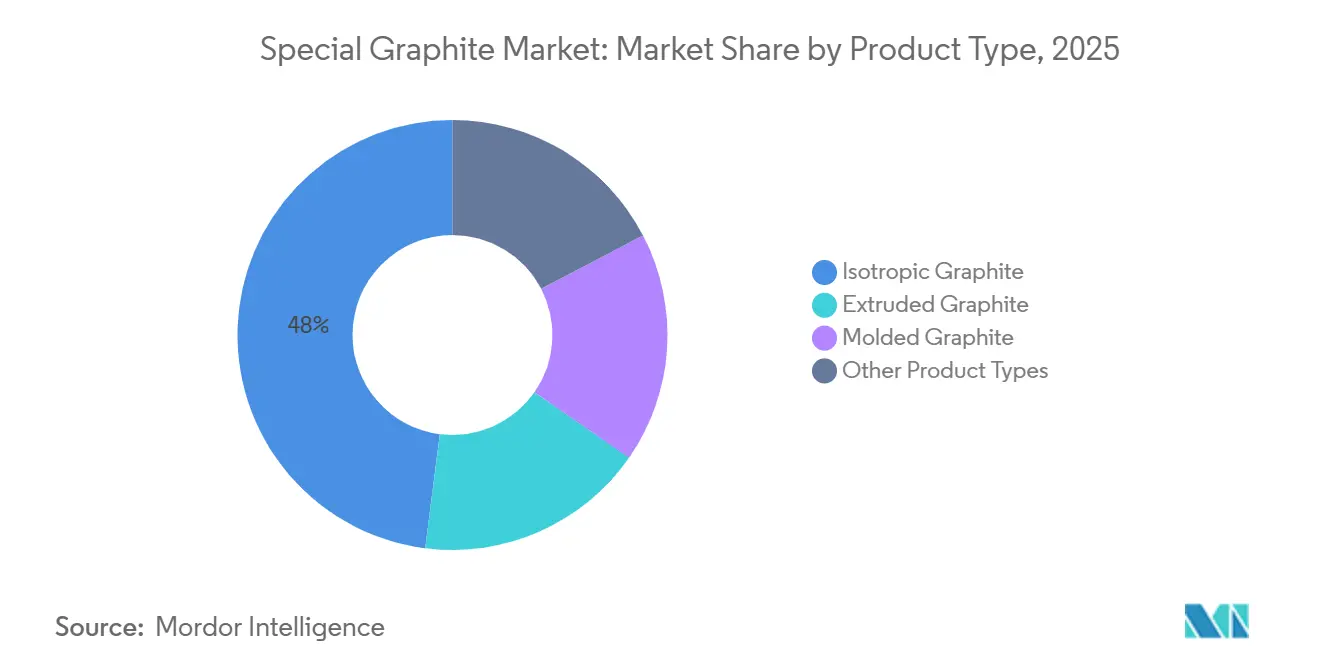
- By product type, isotropic graphite led with 47.98% of the special graphite market share in 2025 and is projected to expand at a 5.51% CAGR through 2031.
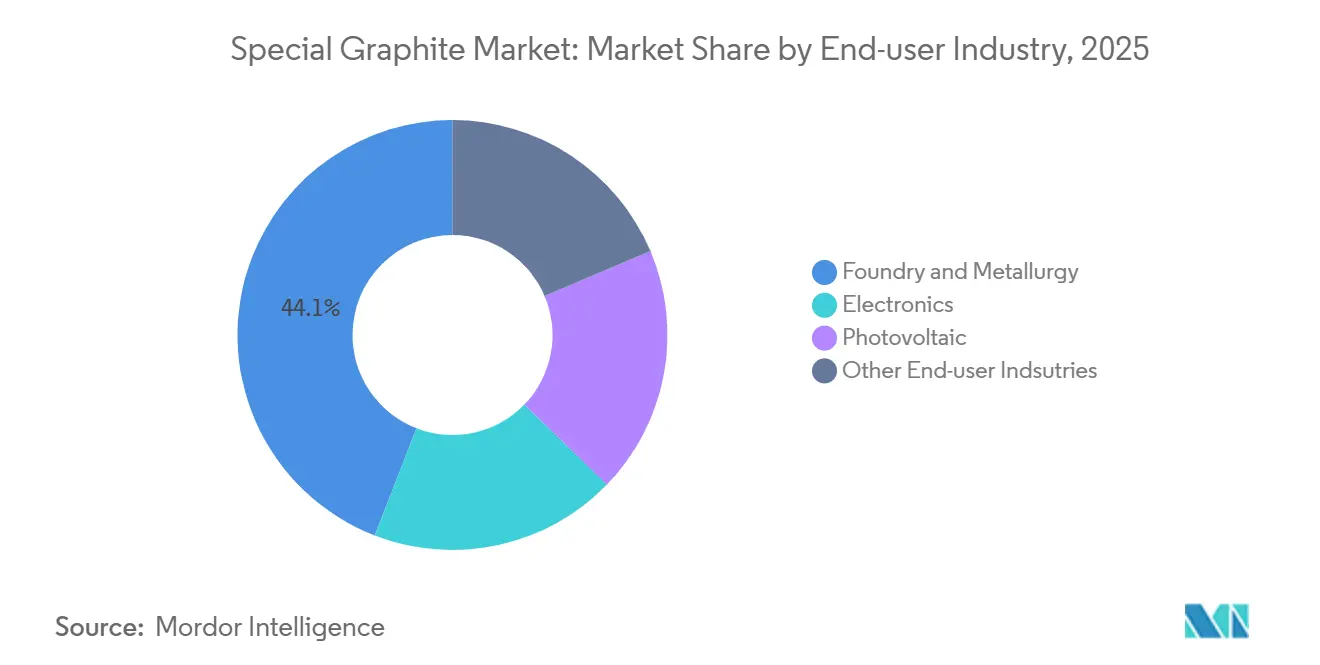
- By end-user industry, foundry and metallurgy commanded 44.12% of the special graphite market share in 2025 and is advancing at a 5.32% CAGR through 2031.
- By geography, Asia-Pacific captured 45.78% of the special graphite market share in 2025 and is advancing at a 6.57% CAGR through 2031.
Note: Market size and forecast figures in this report are generated using Mordor Intelligence’s proprietary estimation framework, updated with the latest available data and insights as of 2026.
Global Special Graphite Market Trends and Insights
Drivers Impact Analysis*
| Driver | (~) % Impact on CAGR Forecast | Geographic Relevance | Impact Timeline |
|---|---|---|---|
| Government decarbonization policies boosting solar-wafer demand | +1.2% | APAC core (China, India), spill-over to EU and North America | Medium term (2-4 years) |
| EV-battery supply-chain localization in United States and European Union spurring special graphite offtake | +1.5% | North America and EU, with sourcing pressure on APAC | Long term (≥ 4 years) |
| Shift to large-format Si-rich anodes needing higher-purity graphite | +0.9% | Global, led by China, South Korea, United States | Medium term (2-4 years) |
| Foundry migration from metal to graphite molds for complex alloys | +0.7% | North America, EU (Germany, France), APAC (Japan) | Short term (≤ 2 years) |
| Rapid expansion of green-hydrogen electrolyser plates using isostatic graphite | +0.6% | EU (Germany, Netherlands), North America, early gains in Middle-East (Saudi Arabia, UAE) | Long term (≥ 4 years) |
| Source: Mordor Intelligence | |||
Government Decarbonization Policies Boosting Solar-Wafer Demand
National climate mandates are translating directly into polysilicon and wafer capacity that sharply lifts special graphite market demand. China added 400 GW of solar manufacturing lines in 2024, which required an estimated 120,000 tonnes of crucible-grade graphite for Czochralski and directional-solidification processes. The U.S. Inflation Reduction Act pushed First Solar and Qcells to commit USD 4 billion to domestic wafer plants that each need isotropic susceptors able to survive 1,450 °C without warping[1]U.S. Department of Energy, “Solar Manufacturing Commitments under IRA,” energy.gov . India’s Production-Linked Incentive program set aside INR 240 billion for solar components, yet the country still imports more than 90% of specialty grades, creating commissioning delays of three to six months. Europe’s rose eight to ten percentage points between 2024 and 2026. Falling wafer thickness from 180 µm to 130 µm paradoxically raises graphite intensity per gigawatt because thinner wafers need tighter thermal-profile control and more rapid crucible replacement.
EV-Battery Supply-Chain Localization in United States and European Union Spurring Special Graphite Offtake
Foreign Entity of Concern rules in the United States and the EU Critical Raw Materials Act obligate automakers to secure non-Chinese graphite after 2027, even though China refined 1.5 million tonnes of spherical graphite in 2024. General Motors and Stellantis signed multi-year offtakes with Syrah’s Vidalia plant in Louisiana and Novonix’s Tennessee facility, paying 15-20% price premiums to lock in IRA eligibility. BMW and Volkswagen earmarked EUR 1.2 billion for a synthetic-graphite venture in Poland, but the plant’s dependence on petroleum needle coke makes it vulnerable to feedstock spikes such as the USD 750-per-tonne price seen in early 2025. The FEOC exemption sunsets in 2027, creating a narrow window in which Western OEMs either secure supply or forfeit USD 7,500 per vehicle in tax credits. South Korea’s KRW 9 trillion K-Battery program aims for 200,000 tonnes of anode capacity by 2028, yet still leans on imported Chinese flake, showing that “localization” often stops at refining.
Shift to Large-Format Si-Rich Anodes Needing Higher-Purity Graphite
Automakers are adopting 5-10% silicon composites to raise cell energy density above 300 Wh/kg, but doing so forces ash content below 50 ppm and shrinks D50 particle size to 12 µm to 15 µm, tighter than the 20-25 µm norm for conventional anodes. Tesla’s 4680 cell requires an extra purification pass that adds USD 800-1,000 per tonne in processing cost. Panasonic and LG Energy Solution pilot 10% silicon for 2027 release, a level where cycle life drops without graphite porosity below 5%. CATL’s Shenxing PLUS battery sources 80% of its high-purity graphite from a single supplier, underlining concentration risk catl.com. South Korean cell makers pay 10-12% premiums for Japanese isotropic graphite because its zero-defect record slashes scrap in pilot lines.
Foundry Migration from Metal to Graphite Molds for Complex Alloys
Aerospace and automotive foundries now replace steel molds with graphite to stretch tool life from 50-100 casting cycles to more than 500, cutting scrap 15-20% and justifying a mold that costs three times as much up front. GE Aerospace moved 30% of turbine-blade casting to graphite in 2024, slicing USD 400 from each part and trimming lead times by two weeks. Tesla’s Giga Press uses graphite inserts that last 1,000 shots, double the life of coated steel. European aerospace consumed 8,000 tonnes in 2024, up 25% year over year as Airbus and Safran ramped LEAP engine production. Qualification cycles still deter newcomers because foundries demand carbon pickup below 0.02%, a threshold extruded grades rarely meet.
Restraints Impact Analysis*
| Restraint | (~) % Impact on CAGR Forecast | Geographic Relevance | Impact Timeline |
|---|---|---|---|
| Breakthroughs in LTO and sodium-ion chemistries lowering graphite intensity | -0.8% | Global, with faster adoption in China for commercial vehicles and entry-level EVs | Medium term (2-4 years) |
| Stricter EU-REACH limits on graphite-dust emissions increase CAPEX | -0.4% | EU (Germany, France, Italy), with compliance pressure extending to UK post-Brexit | Short term (≤ 2 years) |
| Slow qualification cycles for isotropic graphite in advanced semiconductor fabs | -0.3% | Global, concentrated in Taiwan, South Korea, United States (Arizona, Texas) | Long term (≥ 4 years) |
| Source: Mordor Intelligence | |||
Breakthroughs in LTO and Sodium-Ion Chemistries Lowering Graphite Intensity
Lithium-titanate‐oxide anodes offer 20,000-cycle lifespans and already dominate Chinese e-bus packs, displacing about 15,000 tonnes of graphite in 2025 alone. Sodium-ion batteries commercialized by CATL and deployed in BYD’s Seagull sold 200,000 units in 2025 without graphite anodes, and the upcoming 200 Wh/kg milestones could restrict graphite to premium trims, trimming demand by up to 15% post-2028. The threat skews toward natural flake, leaving higher-margin synthetic grades less affected yet eroding volume that supports new Western refineries.
Stricter EU-REACH Limits on Graphite-Dust Emissions Increase CAPEX
The European Chemicals Agency’s 2024 update cut allowable PAH content in graphite electrodes from 10 mg/kg to 1 mg/kg and imposed real-time particulate monitors that trigger automatic line shutdowns above 0.5 mg/m³[2]European Chemicals Agency, “REACH Annex XVII Update 2024,” echa.europa.eu . SGL Carbon spent EUR 12 million to retrofit three German plants, extending payback periods from four to six years and trimming ROIC by 150 basis points. Smaller Bavarian producer Graphit Kropfmühl paused an 8,000-tonne expansion because the EUR 5 million closed-loop system outweighed project NPV. Importers now must verify that overseas suppliers meet equivalent standards, adding USD 50,000-100,000 in annual audit costs that squeeze lower-margin extruded-graphite players.
*Our forecasts treat driver/restraint impacts as directional, not additive. The impact forecasts reflect baseline growth, mix effects, and variable interactions.
Segment Analysis
By Product Type: Isotropic Graphite Dominates Precision Applications
Isotropic graphite held 47.98% of the special graphite market share in 2025 and is forecast to expand at a 5.51% CAGR through 2031, supported by semiconductor, hydrogen, and silicon-rich anode demand. Tokai Carbon and Toyo Tanso together are adding capacity across Japan and the United States, yet 18-month lead times persist because isostatic pressing and multi-week graphitization limit ramp speed.
Extruded graphite is serving EDM and foundry molds where cost per cycle matters more than absolute purity. Molded graphite anchors continuous-casting lines for steel and non-ferrous metals, but growth is muted as Chinese steel output plateaus. Niche products such as flexible and expandable graphite benefit from EV thermal-management systems that need 300-400 W/m·K conductivity, creating double-digit growth pockets even within a slower commodity tier. Price differentials remain wide: isotropic sells for two to three times extruded because the special graphite market size for high-precision grades commands premiums tied to 0.1% porosity specs.


By End-user Industry: Foundry and Metallurgy Lead, Electronics Accelerates
Foundry and metallurgy secured 44.12% of the special graphite market share in 2025 and are expanding at a 5.32% CAGR through 2031 as aerospace and automotive casters switch from steel to graphite molds that last 500-plus cycles. GE Aerospace achieved a cost reduction of USD 400 per turbine-blade casting, while Tesla’s Giga Press enhancements doubled tool life to 1,000 shots. In the aerospace industry, Europe experienced new demand, whereas North America benefited from increased adoption of EV structural castings.
The electronics demand is driven by semiconductor fabrication facilities in Arizona, Kumamoto, and Dresden, which require sub-10-µm grain size and ±2 °C thermal uniformity. Dual-source agreements have led to situations where a single fabrication facility can account for 10-15% of global isotropic capacity, driving up spot prices for unaffiliated EDM tool shops. Additionally, photovoltaic installers are contributing to demand growth; 210 mm wafers, which reduce the levelized cost of energy (LCOE) by 2-3%, require graphite crucibles capable of maintaining zero warp during 1,450 °C thermal cycles, increasing reliance on premium materials.
Geography Analysis
Asia-Pacific commanded 45.78% of the special graphite market share in 2025 and is growing at 6.57% to 2031, anchored by China’s 400 GW annual solar-wafer expansions and 1.5 million-tonne spherical-graphite output. Chinese export-permit rules, tightened in 2023, already prompt Western offtakers to pay 15-20% premiums for non-Chinese feedstock. South Korea plans 200,000 tonnes of local anode capacity by 2028 under the K-Battery initiative, but heavy reliance on Chinese flake means real autonomy remains distant. Japan keeps its niche leadership in ultra-pure isotropic grades, leveraging multi-year fab qualifications as a protective moat. India mined 35,000 tonnes of natural graphite in 2024 and is channeling INR 60 billion into specialty conversions, yet pipeline volumes remain small.
North America benefits from the Inflation Reduction Act, which turns graphite sourcing into a USD 7,500-per-vehicle binary. Syrah’s Vidalia line hit 10,000 tonnes in 2024 and is scaling to 45,000 tonnes by 2027, while Novonix’s Tennessee plant targets 16,000 tonnes by late 2025. Canada’s Bissett Creek restarted in 2024 and feeds a 25,000-tonne Quebec spherical-graphite partnership, and Mexico’s USMCA-compliant suppliers now feed Tesla’s Austin complex.
In Europe, SGL Carbon’s EUR 200 million Swedish expansion rides the EU Critical Raw Materials Act, which requires 40% of consumption to be processed locally by 2030. Only SGL and Mersen currently supply crucible-grade graphite, giving them an 8-10 point margin. Russia’s exports dipped under sanctions, moving European buyers toward Turkish and Indian feedstock. The Middle-East and Africa show focused growth tied to 4 GW of NEOM electrolyser demand, while South American projects remain at the exploration stage.

Competitive Landscape
The special graphite market remains moderately fragmented. Tokai Carbon, Toyo Tanso, and Nippon Carbon dominate semiconductor-grade isotropic graphite by virtue of 18-36 month fab qualifications that lock customers for half a decade. SGL Carbon bets on regulatory upside, investing EUR 200 million in Swedish anode lines rather than chasing Chinese cost curves.
Novonix and Syrah scale U.S. plants to meet IRA demand but still face feedstock risk unless they backward-integrate into flake mining. GrafTech retains a cost moat by owning petroleum needle-coke production that cushions it from the USD 750-per-tonne spike seen in early 2025. Innovation centers on biomass-to-graphite, expandable grades for 800-V EVs, and ultra-fine-grain material for gate-all-around transistors, with patent filings concentrated at SGL and Tokai.
Special Graphite Industry Leaders
SGL Carbon
Toyo Tanso Co., Ltd.
Tokai Carbon Co., Ltd.
Mersen Property
Entegris
- *Disclaimer: Major Players sorted in no particular order

Recent Industry Developments
- November 2025: X energy, LLC signed a USD 40 million agreement with Toyo Tanso Co., Ltd. to supply IG-110 fine-grain isotropic graphite. This graphite served as a neutron moderator and structural component for the Xe-100 high-temperature gas-cooled reactor, supporting the initial four-unit commercial deployment in Texas.
- June 2025: GCM CORPORATION Ltd commissioned its commercial-scale Very High Density (VHD) graphite production plant (Module 1) in New South Wales (NSW), transitioning from pilot testing to manufacturing. The facility, designed for high-performance thermal management in AI data centers and electronics, scaled up operations, with initial revenue expected in the first half of 2026.


Global Special Graphite Market Report Scope
Special graphite (often isotropic or isostatic graphite) is a high-performance synthetic carbon material characterized by fine-particle structure, high density, and uniform, direction-independent properties. It offers superior strength, excellent thermal shock resistance, and high electrical conductivity. It is widely used in semiconductor manufacturing, industrial furnaces, EDM electrodes, and solar cell production.
The special graphite market is segmented by product type, end-user industry, and geography. By product type, the market is segmented into isotropic graphite, extruded graphite, molded graphite, and other product types. By end-user industry, the market is segmented into foundry and metallurgy, electronics, photovoltaic, and other end-user industries. The report also covers the market size and forecasts for special graphite in 17 countries across major regions. For each segment, the market sizing and forecasts have been done on the basis of value (USD).
| Isotropic Graphite |
| Extruded Graphite |
| Molded Graphite |
| Other Product Types |
| Foundry and Metallurgy |
| Electronics |
| Photovoltaic |
| Other End-user Indsutries |
| Asia-Pacific | China |
| India | |
| Japan | |
| South Korea | |
| Rest of Asia-Pacific | |
| North America | United States |
| Canada | |
| Mexico | |
| Europe | Germany |
| United Kingdom | |
| France | |
| Italy | |
| Russia | |
| Rest of Europe | |
| South America | Brazil |
| Argentina | |
| Rest of South America | |
| Middle-East and Africa | Saudi Arabia |
| South Africa | |
| United Arab Emirates | |
| Rest of Middle-East and Africa |
| By Product Type | Isotropic Graphite | |
| Extruded Graphite | ||
| Molded Graphite | ||
| Other Product Types | ||
| By End-user Industry | Foundry and Metallurgy | |
| Electronics | ||
| Photovoltaic | ||
| Other End-user Indsutries | ||
| By Geography | Asia-Pacific | China |
| India | ||
| Japan | ||
| South Korea | ||
| Rest of Asia-Pacific | ||
| North America | United States | |
| Canada | ||
| Mexico | ||
| Europe | Germany | |
| United Kingdom | ||
| France | ||
| Italy | ||
| Russia | ||
| Rest of Europe | ||
| South America | Brazil | |
| Argentina | ||
| Rest of South America | ||
| Middle-East and Africa | Saudi Arabia | |
| South Africa | ||
| United Arab Emirates | ||
| Rest of Middle-East and Africa | ||


Key Questions Answered in the Report
What is the size of the special graphite market?
The special graphite market is estimated at USD 1.19 billion in 2026 and headed toward USD 1.52 billion by 2031, with a CAGR of 5.02% from 2026 to 2031.
Which product type holds the largest special graphite market share in 2025?
Isotropic graphite led with a 47.98% special graphite market share in 2025.
Why are Western automakers paying premiums for graphite?
Inflation Reduction Act and EU Critical Raw Materials rules require non-Chinese sourcing, driving 15-20% price premiums on qualified supply.
What threatens graphite demand in batteries?
Sodium-ion and LTO chemistries eliminate graphite anodes in entry-level EVs and e-buses, potentially shaving 10-15% of future volume if energy density targets are met.
Page last updated on:


