Graphite Market Size and Share
Market Overview
| Study Period | 2021 - 2031 |
|---|---|
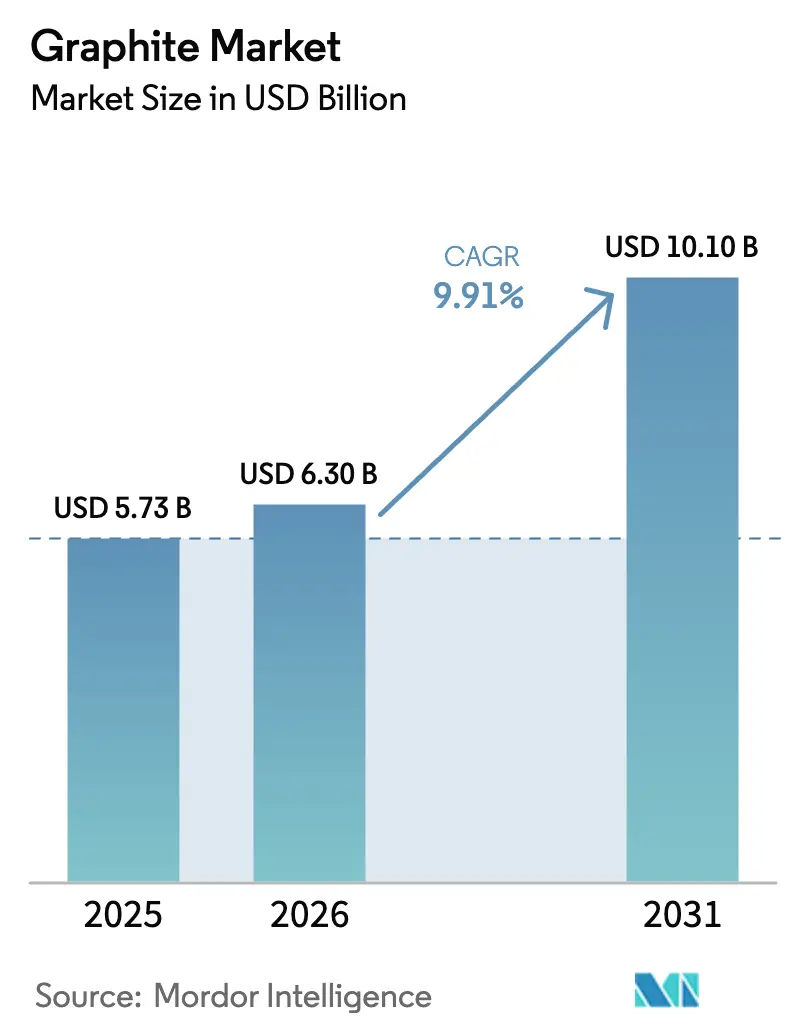
| Market Size (2026) | USD 6.30 Billion |
| Market Size (2031) | USD 10.10 Billion |
| Growth Rate (2026 - 2031) | 9.91% CAGR |
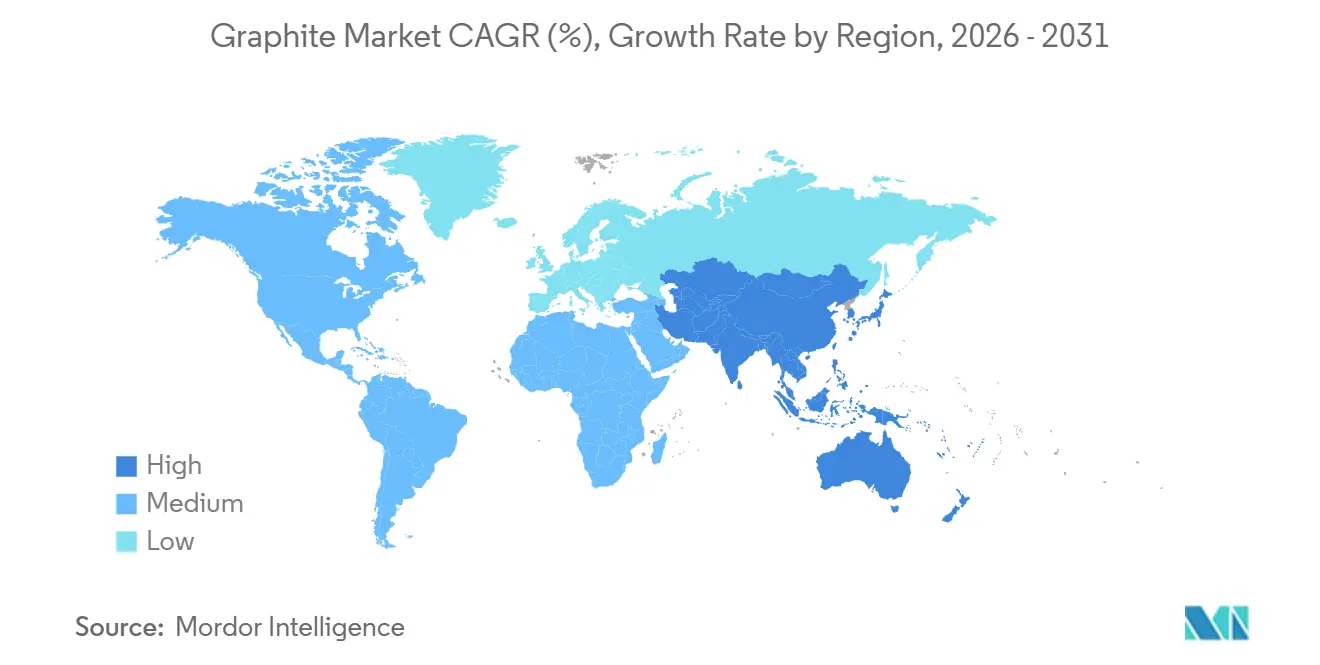
| Fastest Growing Market | Asia Pacific |
| Largest Market | Asia Pacific |
| Market Concentration | Medium |
Major Players *Disclaimer: Major Players sorted in no particular order Image © Mordor Intelligence. Reuse requires attribution under CC BY 4.0. | |
Graphite Market Analysis by Mordor Intelligence
The Graphite Market size is projected to be USD 5.73 billion in 2025, USD 6.30 billion in 2026, and reach USD 10.10 billion by 2031, growing at a CAGR of 9.91% from 2026 to 2031. This momentum is fueled by record capital spending on lithium-ion battery gigafactories, the shift toward electric-arc-furnace (EAF) steelmaking, and rising semiconductor demand for ultra-high-purity synthetic grades. Battery anode producers accelerated mine-to-anode integration to secure feedstock, while steelmakers locked in long-term electrode contracts to insulate against needle-coke shortages. Supply-chain re-routing after China’s 2023 export-licence regime triggered USD 1.8 billion of North American and European capacity announcements in 2025, underscoring a geographic rebalancing of the graphite market. Silicon-enhanced anodes threaten to trim graphite intensity in premium electric vehicles (EVs), yet the proliferation of cost-sensitive lithium-iron-phosphate (LFP) chemistries and the emergence of carbon-negative, bio-based synthetic routes keep long-term demand on an expansion trajectory.
Key Report Takeaways
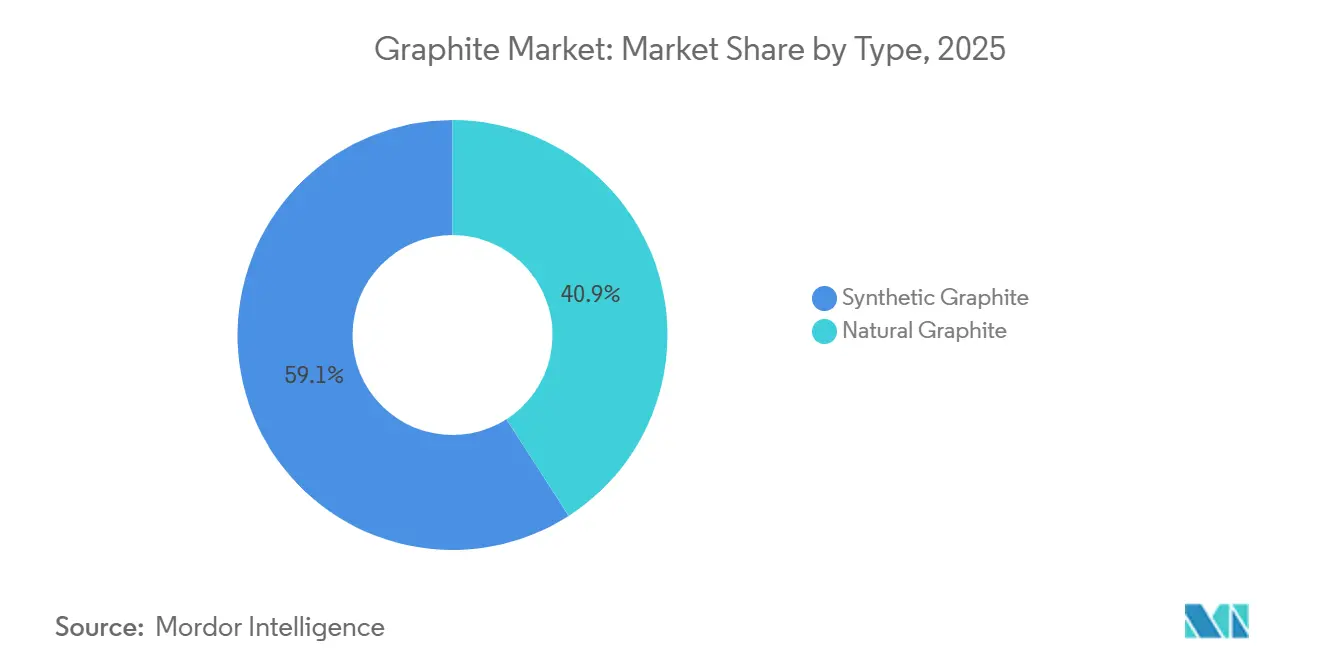
- By type, synthetic graphite led with 59.09% of the graphite market share in 2025. Natural graphite's market share is expected to grow with a CAGR of 12.29% during the forecast period (2026-2031).
- By application, batteries accounted for 40.98% of the graphite market size in 2025 and are advancing at a 17.94% CAGR through 2031.
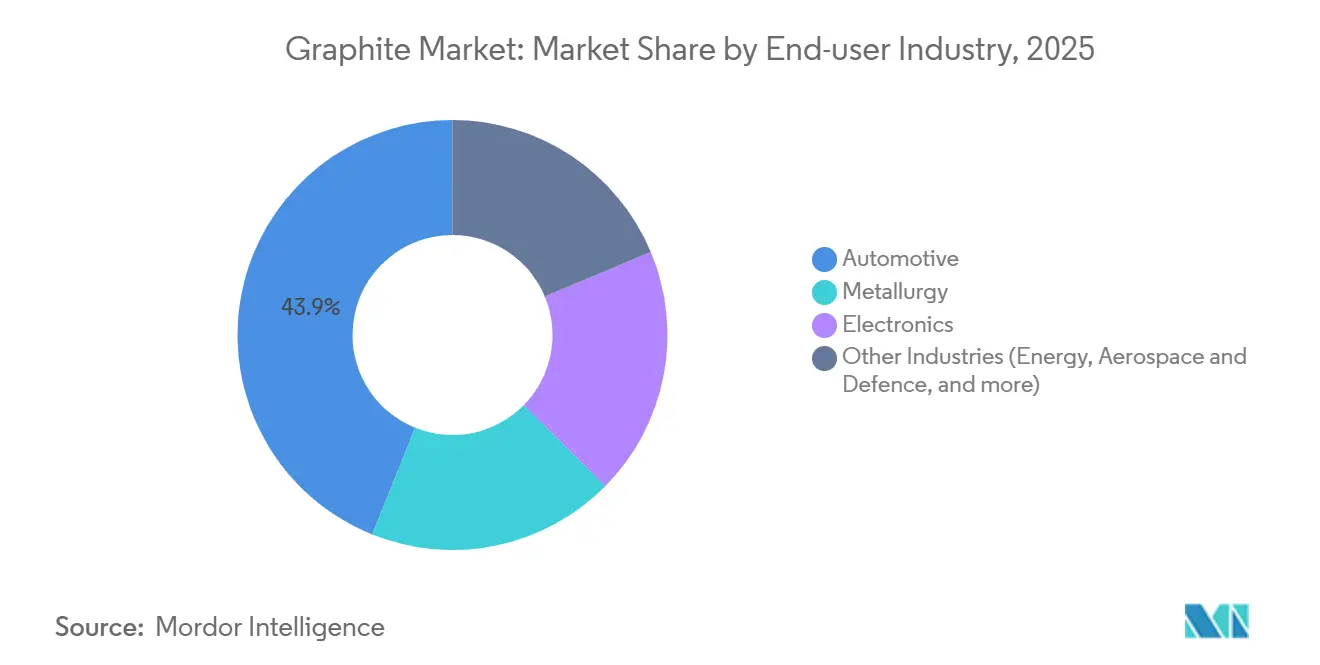
- By end-user industry, automotive held 43.91% share of the graphite market size in 2025, and is projected to expand at a 16.99% CAGR to 2031.
- By region, Asia-Pacific controlled 55.72% of 2025 revenue in the global graphite industry and is also forecasted to grow at 11.34% CAGR by 2031.
Note: Market size and forecast figures in this report are generated using Mordor Intelligence’s proprietary estimation framework, updated with the latest available data and insights as of January 2026.
Market Trends and Insights
Drivers Impact Analysis of Graphite Market*
| Driver | (~) % Impact on CAGR Forecast | Geographic Relevance | Impact Timeline |
|---|---|---|---|
| Soaring Li-ion battery gigafactory build-outs | +3.80% | Global, with APAC core and North America spill-over | Medium term (2-4 years) |
| Expansion of electric-arc-furnace (EAF) steel capacity | +2.10% | APAC, Europe, North America | Long term (≥ 4 years) |
| Rising demand for ultra-high-purity synthetic graphite in the semiconductor industry | +1.40% | APAC (Japan, South Korea, Taiwan), North America | Medium term (2-4 years) |
| China's export-licence regime accelerating ex-China supply investments | +1.90% | North America, Europe, Australia | Short term (≤ 2 years) |
| Emergence of bio-based "green" synthetic graphite routes | +0.80% | Europe, North America | Long term (≥ 4 years) |
| Source: Mordor Intelligence | |||


Soaring Li-Ion Battery Gigafactory Build-Outs
Battery-grade graphite demand is set to triple from 900,000 t in 2024 to 2.7 million t by 2030 as new gigafactories add roughly 150 GWh of cell capacity each year[1]International Energy Agency, “Battery and Minerals Outlook 2025,” iea.org. BTR New Material added 120,000 t pa of anode output in 2025 to secure contracts with CATL and BYD. Vianode commissioned a 10,000 t pa synthetic-graphite plant in Norway, backed by EUR 150 million equity, targeting European buyers seeking non-Chinese supply. In the United States, Syrah Resources’ Vidalia facility reached 11,250 t pa by mid-2025 after winning a USD 220 million Department of Energy loan guarantee. LFP chemistries raise anode loading by 15%, offsetting silicon substitution risk in high-end cells.
Expansion of Electric-Arc-Furnace Steel Capacity
EAF steel will require 1.1 million t of graphite electrodes annually by 2030, up from 850,000 t in 2024, as decarbonization policies spur blast-furnace conversions. HEG Limited lifted capacity utilization to 72% in FY2025 to meet India’s infrastructure‐led steel demand. Graphite India added a 20,000 t pa ultra-high-power electrode line aimed at Southeast Asia and Middle East customers. Germany’s Salzgitter AG plans an EAF conversion that will add 8,000 t pa of electrode demand by 2029. Ultra-high-power electrodes carry a 30% price premium yet cut furnace energy use by 15%, improving steel-mill economics.
Rising Demand for Ultra-High-Purity Synthetic Graphite in Semiconductors
Advanced chip packaging needs thermal-interface materials exceeding 1,500 W/m-K, a specification met by ultra-high-purity synthetic graphite thinner than 50 µm. Within the graphite industry, Tokai Carbon and Nippon Kokuen supplied 65% of this niche in 2025 by reducing ash below 5 ppm. TSMC’s Arizona fab consumes 120 t pa of high-purity graphite for CVD crucibles, while Intel’s Ohio complex will require about 200 t pa from 2027 onward. SGL Carbon’s SIGRAFLEX sheets captured 40% of the heat-spreader segment by dissipating 500 W TDP in sub-50 µm stacks. Despite volumes of only 15,000 t pa, price premiums of 5–8× battery-grade material create attractive margins for qualified suppliers.
China’s Export-Licence Regime Accelerating Ex-China Supply Investments
Beijing’s 2023 export-licensing requirements initially froze one-fifth of global graphite trade, but the selective suspension of permits in November 2025 spurred USD 1.8 billion of Western capacity announcements that year. Syrah Resources expanded Vidalia with U.S. federal backing to bypass Chinese processing. Northern Graphite restarted Ontario’s Bissett Creek mine to deliver 25,000 t pa of concentrate to Canadian anode lines. Vianode’s Norwegian facility pledges a 90% lower carbon footprint and a 10% cost advantage over Chinese producers. Although the controls temporarily boosted Chinese synthetic-graphite prices by 12% in Q1 2025, new Western supply moderated the spike by year-end.
Restraints Impact Analysis of Graphite Market*
| Restraint | (~) % Impact on CAGR Forecast | Geographic Relevance | Impact Timeline |
|---|---|---|---|
| Needle-coke feedstock bottlenecks for synthetic graphite | -1.20% | Global, acute in North America and Europe | Short term (≤ 2 years) |
| Stringent HF-emission regulations on purification lines | -0.90% | Europe, China, North America | Medium term (2-4 years) |
| Battery-anode silicon substitution eroding graphite intensity per kWh | -1.00% | North America, Europe, premium EV segments | Medium term (2-4 years) |
| Source: Mordor Intelligence | |||
Needle-Coke Feedstock Bottlenecks for Synthetic Graphite
Phillips 66 exited petroleum needle-coke production in 2024, erasing 180,000 t pa of capacity and tightening global supply by 15%. GrafTech’s Q1 2025 electrode shipments fell 22% as it struggled to source low-sulfur coke. Spot buyers saw an 18% price jump in H1 2025, while Japanese and Chinese majors secured multi-year coal-tar-pitch deals at a USD 500/t premium. Only a dozen refineries worldwide produce needle coke suitable for ultra-high-power electrodes, and none announced expansions after 2022. Blended feedstocks reduce electrode life by 10%, limiting their uptake in premium furnaces.
Battery-Anode Silicon Substitution Eroding Graphite Intensity per kWh
Sila Nanotechnologies’ Titan Silicon anode, first deployed in Mercedes-Benz EQG cells in 2025, replaced 20% of graphite while lifting volumetric energy density to 800 Wh/L[2]. Group14 Technologies scaled 2,000 t pa of SCC55 silicon-carbon composite capable of 30% silicon loading without swelling failures. IEA models show silicon blends reaching 35% of EV battery capacity by 2030, trimming graphite use from 0.9 kg/kWh to 0.7 kg/kWh fleet-wide in the graphite industry. Yet cost-sensitive LFP packs remain graphite-heavy, and only 12% of 2025 EV models adopted silicon anodes. The substitution is therefore a moderating rather than destructive force.
*Our forecasts treat driver/restraint impacts as directional, not additive. The impact forecasts reflect baseline growth, mix effects, and variable interactions.
Graphite Market Segment Analysis
By Type:
Synthetic Dominance Faces Natural’s ResurgenceSynthetic graphite retained 59.09% of the market share in 2025, thanks to its purity advantage in battery anodes and ultra-high-power electrodes. Natural grades, however, are forecast to expand at a 12.29% CAGR to 2031, lifted by lower costs in refractories, lubricants, and expandable-graphite products. Natural concentrate averaged USD 800–1,200/t in 2025 versus USD 4,500–6,500/t for battery-grade synthetic, a spread that encourages cost-conscious buyers. The graphite market size for natural graphite applications is therefore set to widen faster than synthetic, even if the latter keeps higher absolute revenues.
Production footprints are diverging. China, Japan, and South Korea still host 78% of synthetic capacity, yet North America and Europe added 60,000 t pa in 2025, improving supply security. Natural graphite draws strength from geographic diversity across Mozambique, Tanzania, Madagascar, and Brazil, whose combined reserves exceed 100 million t. Energy-intensive graphitization subjects synthetic producers to carbon-pricing risk, whereas natural processing consumes one-fifth of the electricity per tonne and increasingly benefits from renewable-powered beneficiation plants.


By Application:
Batteries Outpace Electrodes and RefractoriesBatteries absorbed 40.98% of 2025 demand and will grow at a robust 17.94% CAGR through 2031 as EV output targets 30 million units and stationary storage reaches 500 GWh. The graphite market size for batteries alone is expected to top USD 6 billion by the end of the decade, more than doubling 2026 levels. Electrodes for EAF steel will expand, reflecting both steel-market cyclicality and advances in electrode reuse technologies.
Refractory bricks, casting facings, and foundry applications will advance as aluminum and magnesium smelters adopt graphite-bonded linings resistant to 1,800°C melts. Lubricants and friction modifiers’ progress will be fueled by aerospace and heavy-machinery demand. Thermal-management materials, though a smaller volume segment, will surge on the back of data-center processors and high-power EV inverters that dissipate over 300 W/cm². Collectively, non-battery uses remain vital for market balance, cushioning suppliers when EV sales fluctuate.
By End-User Industry:
Automotive Leads, Electronics AcceleratesAutomotive accounted for 43.91% of 2025 demand, the largest graphite market share among end users, and is projected to expand at a 16.99% CAGR through 2031 as larger 75 kWh battery packs and silicon-carbide inverters become standard equipment. Electronic, spanning semiconductors, consumer devices, and data-center hardware, is set for growth, propelled by AI accelerators that require graphite heat spreaders able to manage 500 W thermal design powers. The segment’s center of gravity lies in Japan, South Korea, and Taiwan, which together host 70% of global semiconductor packaging capacity and consume about 15,000 t pa of ultra-high-purity synthetic graphite.
Metallurgy will grow at a more measured CAGR, as EAF steel and aluminum smelting expand but face competition from faster-growing automotive and electronics uses. Energy applications, including grid batteries, fuel cells, and nuclear reactors, are forecast to advance with the support of 200 GWh of stationary storage additions that require graphite felt electrodes at 99.9% purity. Aerospace and defense will post a substantial CAGR because satellite thermal-control panels and hypersonic-vehicle nose cones exploit graphite’s >1,500 W/m-K conductivity and ablation resistance. These specialized grades command prices 10–15 × commodity levels, drawing specialty suppliers such as SGL Carbon and Mersen into the segment. The combined pull of electrified transport, AI-driven compute, and renewable-energy storage is therefore steering demand toward high-purity synthetic grades and raising the technical entry bar for newcomers lacking purification expertise.
Geography Analysis
APAC Graphite Market
Asia-Pacific controlled 55.72% of 2025 revenue and is forecast to grow at an 11.34% CAGR through 2031. China commissioned 1.2 million t pa of new synthetic capacity between 2024 and 2025 to serve CATL and BYD. Japan and South Korea account for 65% of semiconductor-grade output, exporting 12,000 t pa of ultra-high-purity material to TSMC, Samsung, and Intel fabs. India’s electrode producers raised utilization to 72% in FY2025 to meet domestic EAF steel growth. The graphite market size in Asia-Pacific, therefore, remains anchored by integrated supply chains spanning mines, anode plants, and downstream gigafactories.
North America Graphite Market
North America’s market share is projected to expand, propelled by USD 1.2 billion of 2025 investments aimed at domestic anode independence. Syrah’s Vidalia plant hit 11,250 t pa in 2025 and targets 40,000 t pa by 2028. NOVONIX secured a USD 150 million Department of Energy grant to build a 30,000 t pa synthetic facility in Tennessee that will come online in 2027. Canada’s Bissett Creek mine restarted in 2024 to supply 25,000 t pa of concentrate, and Tesla’s upcoming Monterrey gigafactory in Mexico will need 8,000 t pa of anode material by 2027. Needle-coke scarcity remains the region’s largest constraint since Phillips 66’s 2024 exit removed a local feedstock source.
Europe Graphite Market
Europe will register growth, led by Norway’s Vianode plant, which raised EUR 150 million in March 2025 to scale from 10,000 t pa to 50,000 t pa by 2030. Sweden’s Talga Group secured a EUR 150 million European Investment Bank loan to expand its Vittangi natural-graphite project to 19,500 t pa by 2027, achieving a 1.2 kg CO₂/kg footprint using hydropower. Germany’s SGL Carbon and France’s Mersen added a combined 5,000 t pa of specialty-graphite capacity for semiconductors and aerospace. The EU’s Carbon Border Adjustment Mechanism, phased in from 2026, tilts demand toward low-emission graphite and EAF steel. Nordic suppliers leverage cheap renewables and proximity to European gigafactories to carve a green niche in the graphite market.

Regulatory Landscape
Graphite supply chains are increasingly shaped by critical-minerals and environmental permitting regimes. In April 2026, the United States and European Union announced an Action Plan for Critical Minerals Supply Chain Resilience, indicating closer alignment on trade and supply-chain security measures relevant to natural graphite, synthetic graphite, and downstream anode material qualification.
On the environmental side, graphite mining and processing projects face multi-agency approvals tied to water and emissions compliance. In the United States, mineral mining and processing discharges fall under EPA effluent guidelines, while major mine and processing builds must navigate NEPA review and federal permitting pathways, including FAST-41 coverage for selected projects. In Australia, state environmental assessment processes also affect project timelines, as reflected in EPA Western Australia's actions on the Munglinup Graphite Project.
Value Chain Analysis
The graphite value chain spans (1) upstream feedstock supply (natural flake concentrate and synthetic precursors such as petroleum needle coke and coal-tar pitch), (2) midstream upgrading (purification, milling, micronization, and for batteries, spheroidization and coating), and (3) downstream conversion into anode active materials, graphite electrodes, refractories, lubricants, and thermal-management components. The market continues to split between battery-grade material chains that require tight impurity control and consistent particle morphology, and metallurgy-oriented chains centered on electrode performance and reliability.
Bottlenecks and strategic moves are concentrated in midstream processing capacity and technology. Spheroidization and other anode-processing steps run at high utilization, with industry estimates around the mid-80% range, reinforcing vertical integration and regionalization efforts. Recent examples include Allied Graphite partnering with ONEJOON GmbH and Harper International on vertical furnace systems for commercial-scale anode materials manufacturing in North America, and International Graphite and Alkeemia advancing a processing hub model at Porto Marghera, Italy, designed to leverage existing industrial infrastructure to shorten build and qualification cycles. Battery OEM pull-through also shows up in direct stakes and JVs, including CATL taking a 20% stake in biographite developer CarbonScape and Northern Graphite forming a JV framework with Obeikan Investment Group for a battery anode project.
Competitive Landscape
The graphite industry is moderately consolidated. In natural graphite, more than 40 miners and processors vie for contracts, with Syrah Resources, Northern Graphite, and Talga Group among the leaders. Vertical integration is the dominant strategy: BTR’s 2024 purchase of Mozambique flake operations cut its raw-material costs by 18%, while Vianode’s low-temperature synthesis aims to underprice Chinese output by 10% once fully scaled. Smaller players like Mason Graphite and Triton Minerals target expandable graphite and refractory niches where scale advantages are less decisive.
Graphite Industry Leaders
GrafTech International
SGL Carbon
BTR New Material Group Co., Ltd.
Shanghai Shanshan Technology Co., Ltd.
Syrah Resources Limited
- *Disclaimer: Major Players sorted in no particular order
Graphite Market Companies Covered in this Report
- Graphit Kropfmühl GmbH
- Asbury Carbons
- BTR New Material Group Co., Ltd.
- Fangda Carbon New Material Co., Ltd.
- GrafTech International Ltd.
- Graphit Kropfmühl GmbH
- Graphite India Limited
- HEG Limited
- Imery
- Mason Resources Inc.
- Mersen
- Nippon Kokuen Group
- Northern Graphite
- POCO
- Resonac Holdings Corporation
- SGL Carbon
- Shanghai Shanshan Technology Co., Ltd.
- Syrah Resources Limited
- Tokai Carbon Co., Ltd.
- Triton Minerals Limited

Market Opportunities and Future Outlook
White space centers on ex-China battery anode-grade processing (purification, spheroidization, coating, and graphitization) and on low-carbon synthetic routes that support procurement and disclosure requirements. Europe is allocating capital toward localized processing under the EU Critical Raw Materials Act framework, including a binding joint venture between International Graphite and Alkeemia to establish a 10,000 tpa graphite processing hub at Porto Marghera, Italy. North America is also shifting from upstream resource positioning toward downstream active anode material build-outs, as shown by Graphite One securing an Ohio site and then executing an engineering contract for an active anode materials facility targeting 25,000 tpa of synthetic graphite capacity by Q4 2028.
Opportunities also extend to capacity additions in battery anode production in Asia outside legacy hubs and to integrated mine-to-material models that reduce qualification risk for automakers and cell manufacturers. Posco Future M announced a USD 239 million investment for a 55,000 tpa artificial graphite anode plant in Vietnam, adding another node to regional anode supply. In parallel, project maturation activity such as Titan Mining commencing shipments from a demonstration facility and launching a feasibility study for the 40,000 tpa integrated Kilbourne Graphite Project, and Nouveau Monde Graphite updating feasibility for Phase 2 at Matawinie and Becancour, point to continued throughput expansion pathways tied to EV and stationary storage scale-up, along with non-battery segments such as EAF electrodes and specialty graphite for electronics.
Recent Industry Developments in Graphite Market
- May 2026: BTR New Material Group reported progress on industrial projects in Morocco with a total investment cited at MAD 6 billion (about USD 650 million) linked to electric mobility and battery technology value chains. The build-out supports geographic diversification of anode-related manufacturing and strengthens supply options for customers seeking production outside legacy processing hubs.
- March 2026: GrafTech International announced a minimum price increase of USD 600 to USD 1,200 per metric ton for graphite electrodes on uncommitted volumes, effective immediately. The change highlighted ongoing tightness and pricing discipline in the large-diameter electrode segment, with implications for EAF steelmakers managing consumables costs and contract coverage.
- July 2024: Graphit Kropfmuhl partnered with BASF to access renewable-energy certificates for its Hauzenberg plant in Germany. The agreement reduced the site carbon footprint profile and supported downstream customers preparing for stricter EU battery and industrial supply-chain disclosure requirements.


Graphite Market Report Scope and Research Methodology
Market Definition and Coverage
For this study, the graphite market covers the value of graphite sold into industrial uses, counting natural graphite and synthetic graphite across major consuming regions and commonly traded forms.
Scope exclusions: Adjacent carbon materials and advanced derivatives such as graphene, carbon fiber, and diamond-like carbon coatings are not counted in this market.
Segments Covered in This Report
- By Type
- Natural Graphite
- Synthetic Graphite
- By Application
- Electrodes
- Refractories, Casting and Foundries
- Batteries
- Lubricants
- Other Applications (Thermal Management Materials, Friction Products and Brake Linings,etc.)
- By End-user Industry
- Metallurgy
- Electronics
- Automotive
- Other Industries (Energy, Aerospace and Defence, etc.)
- By Geography
- Asia-Pacific
- China
- India
- Japan
- South Korea
- ASEAN Countries
- Rest of Asia-Pacific
- North America
- United States
- Canada
- Mexico
- Europe
- Germany
- United Kingdom
- France
- Italy
- Spain
- NORDIC Countries
- Rest of Europe
- South America
- Brazil
- Argentina
- Rest of South America
- Middle-East and Africa
- Saudi Arabia
- United Srab Emirates
- Egypt
- South Africa
- Rest of Middle-East and Africa
- Asia-Pacific
Data Sources, Market Sizing, and Validation
Desk Research
Desk research was used to map the demand pool and to set reasonable starting points for production, trade, and usage patterns. We reviewed public datasets and references such as USGS mineral statistics, national geological surveys, UN Comtrade trade flows, and energy and transport statistics published by IEA-type agencies, plus peer reviewed papers on anode and refractory consumption.
To connect these indicators to market value, we also used company filings, investor presentations, project announcements, and reputed business press for capacity additions and commissioning timelines. Price direction was cross-checked using public customs unit values and published benchmarks, then cleaned for outliers. In a few cases, paid subscriptions that track company financials and news, along with an import and export shipment-level database, helped confirm shipment routes and timing. The sources listed here are illustrative, and we referred to other public and official sources as well for data collection, validation, and research clarification.
Primary Interviews and Surveys
Primary work focused on validating what graphite is being used for, how demand splits between natural and synthetic routes, and how pricing is negotiated by application. We spoke with a mix of producers, processors, traders, distributors, and large end users, then checked regional differences across APAC, EMEA, and the Americas to close gaps left by public data.
Distribution of primary research fieldwork respondents
| Company type | Respondent position | Region |
|---|---|---|
| Top tier: 36% | CXOs: 13% | APAC: 44% |
| Mid tier: 46% | Functional/Unit leaders: 35% | EMEA: 36% |
| Smaller Players: 18% | Managers: 52% | Americas: 20% |
Market-Sizing & Forecasting
Sizing starts from a top-down build where production, trade data, and downstream consumption indicators are used to reconstruct the graphite demand pool by region, then translated into value using application-led pricing logic. To keep this practical, we leaned on variables such as the natural versus synthetic split, battery anode material demand signals, steel and foundry output trends that influence refractories and electrodes, import dependency in key consuming countries, and observable price bands for different grades.
After the regional totals were shaped, we used selective bottom-up approximations as a check, such as sampling supplier volumes disclosed in public updates, channel discussions on typical contract sizes, and a simple volume times average selling price view for a few high-visibility applications. When data was missing for smaller markets, we used proxies like trade intensity and end-use output, and we kept assumptions only if interview feedback supported them.
Forecasting was mainly done using scenario analysis supported by short series trend methods such as exponential smoothing for prices and volumes, since demand can shift with step changes in battery investments and capacity additions. The final outlook reflects how quickly new supply comes online, how battery adoption changes the application mix, and how price normalization occurs after tight or oversupplied periods.
Data Validation & Update Cycle
Outputs were validated through several checks so that the model does not drift away from real market signals. We compared implied per-ton values against public benchmarks, reviewed regional demand shares against trade and production footprints, and rechecked any sharp year-on-year jumps before internal sign-off.
If interview feedback or new public announcements created a material variance, the assumptions were revisited and the affected parts of the model were rebuilt, followed by a second review. The report is refreshed annually, and interim updates are made when large capacity additions, policy changes, or price shocks materially alter the outlook. Before delivery, an analyst performs a final pass so the numbers reflect the latest available information.
Mordor Intelligence's Graphite Market Size Versus Other Published Estimates
Published graphite market numbers can vary a lot, even when the topic appears similar on the surface, because scope, base year, and pricing approach are not always aligned. Differences also come from whether a study includes downstream carbon materials, applies aggressive battery growth assumptions, or uses a single blended price that does not reflect grade and application spreads.
Key gaps often come from what is being valued along the battery chain and how natural and synthetic graphite are priced across applications. Some estimates lean on blended pricing and broader definitions that can pull in higher-value processed items linked to anodes, which tends to lift the total compared with a traded-graphite and end-use consumption build.
Benchmark comparison
| Source | Market Size | Gaps in Research Methodology |
|---|---|---|
| Mordor Intelligence | USD 6.30 B (2026) | |
| Global Consultancy A | USD 20.38 B (2024) | Uses an earlier base year and appears to apply a broader value-chain view that can pull in higher-value processed battery and industrial carbon items, which increases the value versus traded graphite material. |
| Industry Publisher B | USD 8.33 B (2025) | Uses a different base year and a more averaged pricing structure, which can understate grade-level price dispersion and shift the natural versus synthetic mix in value terms. |
The comparison shows that year selection and what is counted as graphite value are the two biggest levers behind the spread. By tying volumes to production and trade flows, then applying application-specific pricing with interview-based checks, the estimate stays traceable to repeatable steps, a modeling discipline applied by Mordor Intelligence.


Key Questions Answered in the Report
How fast is demand for graphite in EV batteries growing?
Battery anodes are forecast to rise at a 17.94% CAGR during 2026-2031 as global EV output targets 30 million units.
Which region leads graphite production and consumption?
Asia-Pacific holds 55.72% of 2025 revenue, keeping it the dominant node for both supply and demand.
How will silicon impact future graphite usage in batteries?
Silicon-blended anodes could lower graphite intensity from 0.9 kg/kWh to 0.7 kg/kWh by 2030, but graphite remains dominant in cost-sensitive LFP cells.
Which companies are pioneering low-carbon graphite production?
Vianode, Talga Group, and Levidian are scaling processes that cut cradle-to-gate emissions by 40%–100% versus conventional synthetic routes.
What is current market size of Graphite market?
What is the current market size of the graphite market?
Page last updated on:


