
Market Overview
| Study Period | 2021 - 2031 |
|---|---|
| Forecast Data Period | 2026 - 2031 |
| Base Year Market Size (2025) | USD 28.47 Billion |
| Market Size (2026) | USD 30.02 Billion |
| Market Size (2031) | USD 39.16 Billion |
| Growth Rate (2026 - 2031) | 5.45 % |
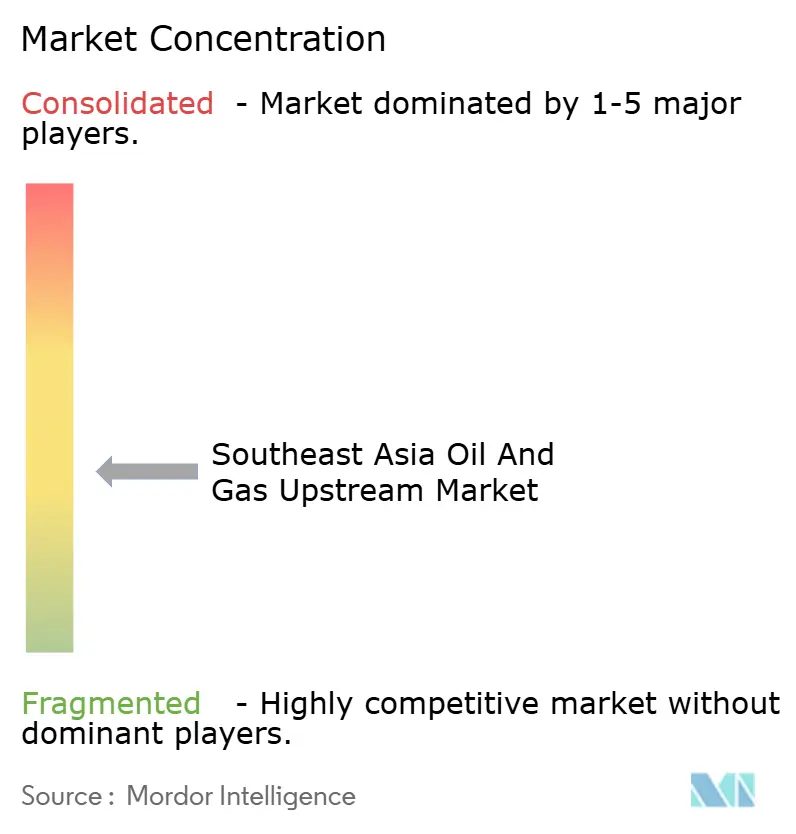
| Market Concentration | Medium |
Major Players *Disclaimer: Major Players sorted in no particular order Image © Mordor Intelligence. Reuse requires attribution under CC BY 4.0. | |
Southeast Asia Oil And Gas Upstream Market Analysis by Mordor Intelligence
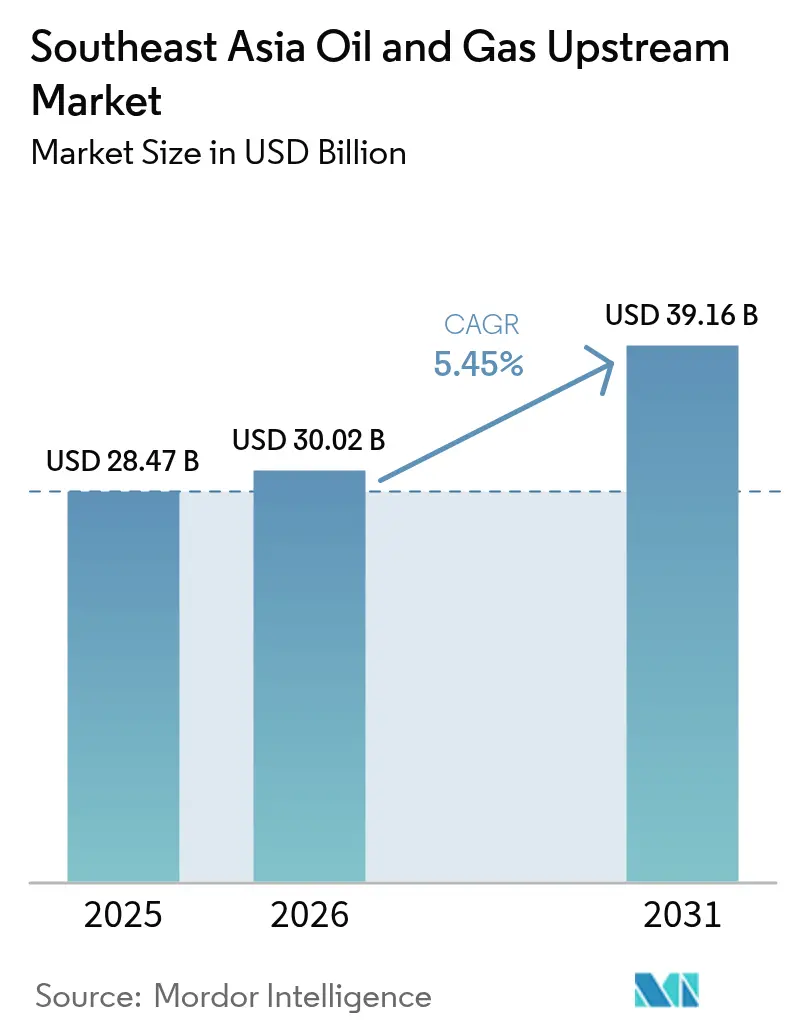
The Southeast Asia Oil And Gas Upstream Market size was valued at USD 28.47 billion in 2025 and estimated to grow from USD 30.02 billion in 2026 to reach USD 39.16 billion by 2031, at a CAGR of 5.45% during the forecast period (2026-2031).
A combination of deep-water gas discoveries, enhanced fiscal incentives, and sustained regional demand for cleaner-burning fuels is accelerating capital inflows into exploration, development, and decommissioning activities. Operators are prioritizing high-CO₂ gas projects that integrate carbon-capture solutions, while National Oil Companies (NOCs) are broadening their portfolios through asset purchases from divesting International Oil Companies (IOCs). Tight offshore drilling and subsea equipment supply is driving up day rates and extending project lead times, thereby granting service providers greater pricing power. Indonesia retains the largest resource base, but the Philippines shows the fastest growth trajectory as streamlined licensing attracts fresh entrants.
Key Report Takeaways
- By location, offshore operations accounted for 66.02% of revenue in 2025, and deep-water deployments are expected to advance at a 5.98% CAGR through 2031.
- By resource type, natural gas captured the fastest 8.08% CAGR, while crude oil held 54.20% of the Southeast Asia oil and gas upstream market share in 2025.
- By well type, conventional wells accounted for 84.12% of the revenue in 2025; unconventional developments are expanding at a 7.41% CAGR, driven by horizontal drilling and AI-enabled stimulation.
- By service, development and production commanded 68.35% of the revenue in 2025, yet decommissioning is expected to lead future growth at an 7.78% CAGR, as 1,500 offshore platforms near the end of their life.
- By geography, Indonesia captured 35.12% of the revenue in 2025; the Philippines shows the fastest 6.05% CAGR to 2031.
Note: Market size and forecast figures in this report are generated using Mordor Intelligence’s proprietary estimation framework, updated with the latest available data and insights as of 2026.
Market Trends and Insights
Drivers Impact Analysis of Southeast Asia Oil And Gas Upstream Market*
| Driver | (~) % Impact on CAGR Forecast | Geographic Relevance | Impact Timeline |
|---|---|---|---|
| Surging regional gas demand for power & industry | 1.80% | Indonesia, Malaysia, Thailand core markets | Medium term (2-4 years) |
| Deep-water gas discoveries & planned FIDs (Indonesia, Malaysia) | 1.50% | Indonesia, Malaysia offshore basins | Long term (≥ 4 years) |
| Enhanced fiscal terms & new PSC licensing rounds | 1.20% | Indonesia, Malaysia, Philippines | Short term (≤ 2 years) |
| Mid-size asset divestments by IOCs opening opportunities for NOCs | 0.80% | Regional, concentrated in Indonesia, Malaysia | Medium term (2-4 years) |
| CCS-ready sour-gas fields unlocking high-CO₂ reservoirs | 0.60% | Malaysia, Indonesia, Brunei | Long term (≥ 4 years) |
| AI-driven well optimisation lifting brown-field recovery factors | 0.40% | Regional mature fields | Short term (≤ 2 years) |
| Source: Mordor Intelligence | |||
Surging Regional Gas Demand for Power & Industry
Natural gas consumption across the power and industrial sectors is forecast to reach 210 billion m³ by 2030, a 45% increase over current levels. Indonesia’s PLN plans 20.9 GW of new gas-fired capacity, and Malaysia’s market reforms treat gas as the preferred balancing fuel for solar and wind integration. Petrochemical expansions in Thailand and Singapore will lift feedstock needs, ensuring multi-decade demand visibility. This structural call on gas underpins aggressive upstream sanctioning of high-CO₂ reservoirs that embed carbon-capture modules. Consequently, operators secure long-term sales contracts before first gas, de-risking multibillion-dollar investments and supporting the Southeast Asia oil and gas upstream market.
Deep-Water Gas Discoveries & Planned FIDs
Indonesia’s Geng North (2.5 TCF) and Malaysia’s Kasawari (3.3 TCF) rank among the world’s most consequential deep-water finds, located in waters exceeding 1,500 m depth. BP’s USD 7 billion Tangguh Ubadari sanction and Vietnam’s Block B commitment illustrate investor confidence in subsea production, floating LNG, and CCS integration. Deep-water hubs shift the supply map away from maturing shelf assets and set local engineering benchmarks for high-pressure, high-CO₂ developments. As national grids shift toward gas, these discoveries encourage fresh frontier exploration, reinforcing the outlook for growth in the Southeast Asia oil and gas upstream market.
Enhanced Fiscal Terms & New PSC Licensing Rounds
Indonesia now lets operators choose between cost-recovery and gross-split PSCs, trimming state take by 5-8 percentage points on marginal fields.[1] Malaysia offers Small Field Allowance and Late-Life Asset schemes that extend plateau production. The Philippines’ 2024 bid round cut typical approval cycles to 12 months, improving investment certainty. Competitive fiscal liberalization among governments is driving a regional bidding race that channels capital toward both brown- and greenfield opportunities. The resulting deal flow sustains drilling commitments and bolsters the Southeast Asia oil and gas upstream market.
Mid-Size Asset Divestments by IOCs Opening Opportunities for NOCs
Global majors are pruning mature Southeast Asian holdings to fund low-carbon portfolios, selling mid-size assets to regional NOCs and independents. TotalEnergies’ purchase of SapuraOMV stakes in Malaysia and Chevron’s exit from a Singapore refinery typify the trend. Buyers inherit cash-flowing fields, plus upside in redevelopment, to enhance project economics, enabling NOCs such as PETRONAS and PTTEP to expand their operations and conduct infill drilling. Fiscal sweeteners further improve project economics, allowing NOCs such as PETRONAS and PTTEP to deepen domestic and cross-border exposure. Ownership churn keeps rigs working and preserves workforce skills, reinforcing market continuity.
Restraints Impact Analysis of Southeast Asia Oil And Gas Upstream Market*
| Restraint | (~) % Impact on CAGR Forecast | Geographic Relevance | Impact Timeline |
|---|---|---|---|
| Rapid decline of mature shallow-water oil fields | -1.20% | Indonesia, Malaysia, Thailand legacy basins | Short term (≤ 2 years) |
| Fiscal & regulatory uncertainty in Vietnam & Thailand | -0.80% | Vietnam, Thailand | Medium term (2-4 years) |
| Environmental opposition delaying frontier exploration acreage | -0.60% | Regional frontier areas | Long term (≥ 4 years) |
| Global rig/sub-sea equipment tightness stretching project schedules | -0.50% | Regional offshore projects | Short term (≤ 2 years) |
| Source: Mordor Intelligence | |||
Rapid Decline of Mature Shallow-Water Oil Fields
Shelf assets installed in the 1980s and 1990s now face annual decline rates of 8-12% as reservoir pressure falls and facilities surpass their design life. Indonesia alone operates more than 630 offshore platforms, many of which are over 40 years old.[2] Replacement projects often fail to clear capital hurdles, prompting operators to abandon them prematurely. Such accelerated shut-ins weigh on near-term liquids output and cap upside to the Southeast Asia oil and gas upstream market.
Global Rig/Sub-Sea Equipment Tightness Stretching Project Schedules
Jack-up utilization in the Asia Pacific reached 97% in 2025, and deep-water drillships are approaching full booking.[3] Malaysia requires 118 additional offshore support vessels annually through 2027, yet a fifth of the current fleet is laid up or non-compliant. Scarcity inflates day rates by double-digit percentages, lengthens project timelines by up to 12 months, and raises break-even prices. Developers must sequence projects carefully to avoid cost overruns, which can temper the growth of the Southeast Asia oil and gas upstream market.
*Our forecasts treat driver/restraint impacts as directional, not additive. The impact forecasts reflect baseline growth, mix effects, and variable interactions.
Southeast Asia Oil And Gas Upstream Market Segment Analysis
By Location of Deployment:
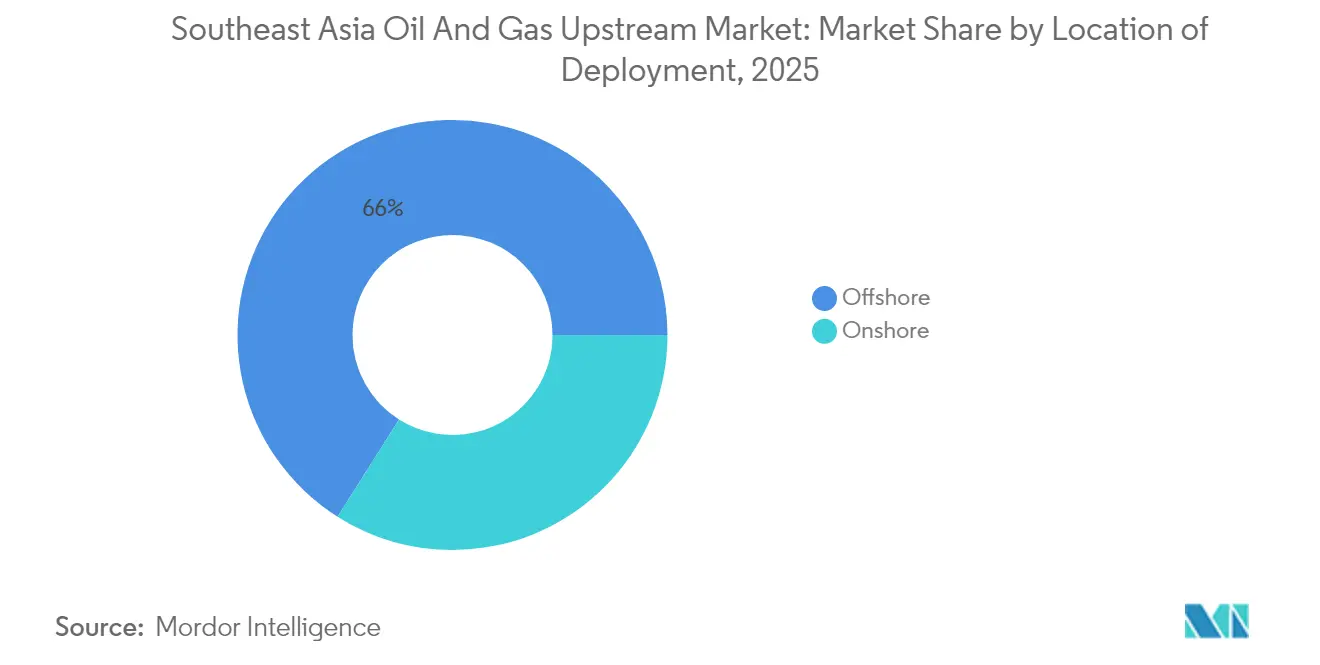
Deep-Water Expansion Bolsters Offshore DominanceOffshore activities generated two-thirds of 2025 revenue, and the segment is forecast to compound at a 5.98% CAGR through 2031 as operators sanction ultra-deep gas hubs. The Southeast Asia oil and gas upstream market size for offshore reached USD 19.82 billion in 2026, reflecting momentum from Indonesia’s Geng North and Malaysia’s Kasawari FPSO installations. Floating production systems, subsea compression, and CCS modules are now integral, enabling the commercialization of previously stranded high-CO₂ accumulations.
Onshore spending holds a smaller share, but investments in predictive maintenance and reservoir modeling lift recovery from legacy Sumatra and Thai onshore blocks. AI-enabled optimization reduced downtime 15-20% on Shell’s Malaysian assets, helping offset natural declines. As the deep-water drive continues, rig and vessel bottlenecks will dictate project sequencing and preserve the premium enjoyed by offshore contractors within the Southeast Asia oil and gas upstream market.

By Resource Type:
Gas Ascendancy Accelerates Energy TransitionNatural gas logged the fastest 8.08% CAGR and is expected to surpass half of incremental hydrocarbon volumes by 2031. Utility decarbonization mandates and petrochemical expansions lift baseload demand, while LNG import dependence prompts governments to monetize domestic gas. The natural-gas component of the Southeast Asia oil and gas upstream market is expected to increase from USD 13.75 billion in 2026 to USD 20.29 billion by 2031.
Crude oil remains important, holding a 54.20% share in 2025, but incremental growth centers on gas-rich reservoirs with CCS readiness. PETRONAS’s Kasawari Phase 1 integrates 3.3 million tonnes per year of carbon-capture capacity, turning sour gas into a bankable project. Strong regional gas prices and policy support sustain the investment thesis, even as liquids output gently declines.
By Well Type:
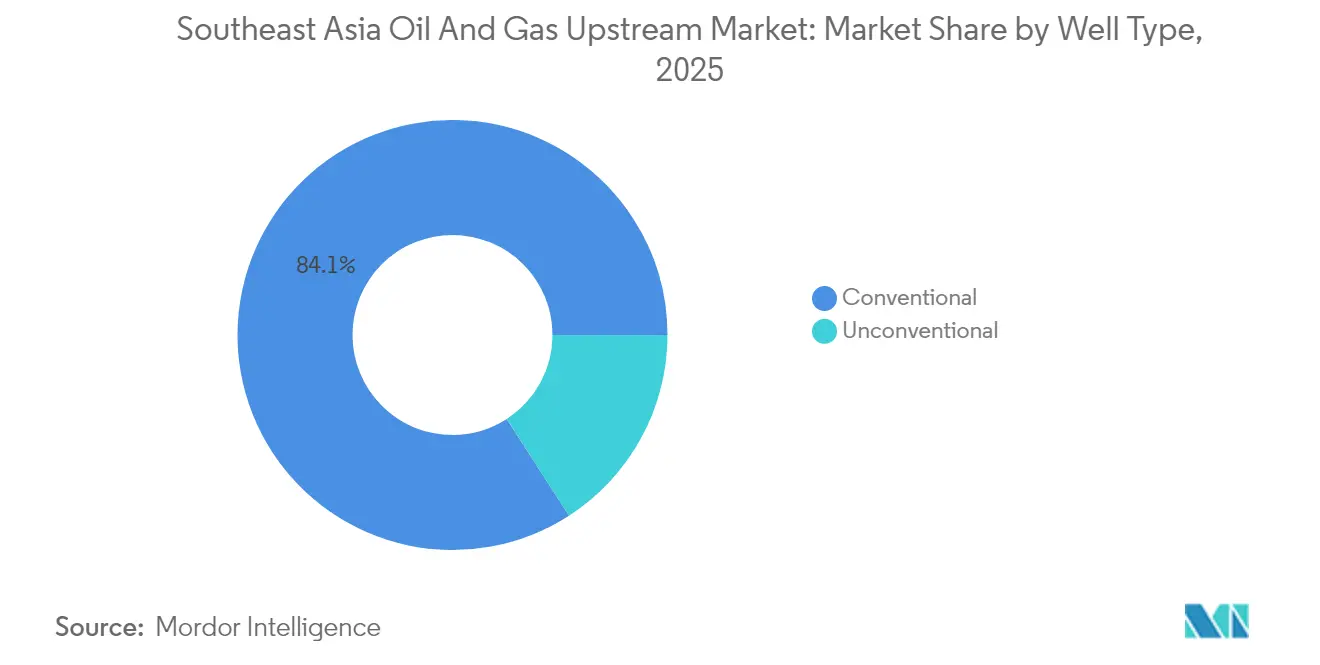
Unconventional Methods Revitalize Mature BasinsConventional drilling still accounts for 84.12% of the revenue, yet unconventional wells are projected to grow at a 7.41% CAGR through 2031, as horizontal drilling, multistage stimulation, and digital twins unlock previously inaccessible resources. AI-driven workflows reduced non-productive time 15-20% across pilot wells, improving capital efficiency for marginal prospects.
The Southeast Asia oil and gas upstream market share for unconventional operations remains modest today; however, aggressive pilot programs in Indonesia’s Sumatra and Malaysia’s Peninsular fields indicate a rising adoption. Cost curves decline as learning effects accumulate, allowing operators to profitably redevelop brownfields without requiring large-scale surface upgrades.
By Service:
Decommissioning Surges Amid Infrastructure MaturityDevelopment and production services accounted for 68.35% of revenue in 2025, reflecting ongoing brown- and greenfield work. However, decommissioning is forecasted at a 7.78% CAGR, as 200 fields and 1,500 platforms near the end of their operational life. This niche could touch USD 5.28 billion within the Southeast Asia oil and gas upstream market by 2031. PETRONAS has earmarked USD 2 billion over ten years for retirements across 300 platforms, 40% of which have exceeded their 30-year design life.
Engineering houses are pivoting toward well-plugging, jacket removal, and reefing solutions, supplementing revenue lost to IOCs’ divestments. Exploration services retain a steady but smaller slice as licensing reforms keep frontier acreage on the radar, particularly in Brunei deep-water blocks and Myanmar once political stability returns.
Geography Analysis
Indonesia Oil and Gas Upstream Market
Indonesia accounted for 35.12% of 2025 revenue, as dual PSC options reduced the government's share and unlocked FIDs, such as BP's USD 7 billion Tangguh Ubadari project. The nation's 630-plus platforms provide a steady pipeline for workover and decommissioning contracts, while new deep-water gas hubs extend the production outlook beyond 2035. Fiscal agility and improved permitting enable Indonesia to maintain its leadership in the Southeast Asian oil and gas upstream market.
Philippines Oil and Gas Upstream Market
The Philippines is the fastest-growing jurisdiction with a 6.05% CAGR through 2031. Malampaya Phase 4's success, coupled with eight new Predetermined Areas offered in 2024, reduced the average licensing cycle to 12 months. Political stability and straightforward gross-split terms attract new capital for both shallow-water gas and frontier Palawan prospects, enabling Manila to displace imported LNG volumes.
ASEAN Oil and Gas Upstream Market
Malaysia stays pivotal through PETRONAS's integrated role and tailored fiscal packages for deep-water, small fields, and high-pressure reservoirs. The country's specialized PSCs protect break-even below USD 50/bbl, encouraging infill drilling at late-life assets even as decommissioning ramps up. Thailand and Vietnam generate steady cash flow but face risks of delays from environmental reviews and South China Sea territorial disputes. Singapore acts as a logistics and financial hub, wMyanmar'smar’s resource potential remains contingent on political normalization.

Regulatory Landscape
Southeast Asian upstream regulation is shifting toward faster approvals and more investable fiscal and administrative terms, with national regulators tightening operational governance through digitalized licensing. In Indonesia, the Ministry of Energy and Mineral Resources (MEMR) enacted Permen ESDM No. 7/2026 in June 2026, aligning risk-based business licensing standards with the Online Single Submission (OSS) system to streamline permitting across the energy and minerals sector. This also sits alongside the market context of Indonesia offering operators a choice between cost-recovery and gross-split PSC structures to improve project economics.
Vietnam advanced its upstream reform agenda through government resolutions that set direction for sector governance and investment incentives. Resolution No. 81/NQ-CP (April 2026) approved policy groups to guide drafting of a revised Law on Petroleum, with an emphasis on simplifying procedures and incentivizing upstream investment, while Resolution No. 36/NQ-CP (March 2026) granted Petrovietnam greater autonomy in crude trading and imports to support fuel security. At the regional level, ASCOPE and the ASEAN Energy Regulators Network (AERN) provide coordination platforms, and ASCOPE Decommissioning Guidelines (ADG) are used as a technical reference for offshore decommissioning practices as aging infrastructure becomes a larger regulatory and execution topic.
Competitive Landscape
The Southeast Asia oil and gas upstream market exhibits moderate concentration, with Shell, PETRONAS, BP, and TotalEnergies leading in terms of operated volumes. Asset recycling is reshaping ownership as majors divest to NOCs and agile independents like EnQuest and Jadestone Energy, attracted by improved PSCs. Buyers leverage lower cost structures and longer investment horizons, maintaining production with enhanced recovery techniques.
Technology is the main differentiator. Shell deployed predictive-maintenance AI across its Malaysian hubs, which trimmed unplanned downtime by 10%, while BP applied digital twins to optimize well trajectories at Tangguh. PETRONAS integrates CCS at Kasawari, creating an emissions-compliant template for sour-gas monetization. Supply-chain management also confers advantage, as access to scarce high-spec rigs and vessels dictates schedule certainty.
Decommissioning opens a USD 30-100 billion service opportunity. Specialist contractors collaborating with host governments develop fit-for-purpose regulations, reducing abandonment liability risk. Service firms providing plug-and-abandonment, jacket cutting, and subsea debris clearance will enjoy multi-year order backlogs, supporting diversification away from dependence on greenfield projects.
Southeast Asia Oil And Gas Upstream Industry Leaders
-
Petroliam Nasional Berhad (PETRONAS)
-
Shell Plc
-
Total Energies SE
-
PTTEP
-
Pertamina
- *Disclaimer: Major Players sorted in no particular order
Southeast Asia Oil And Gas Upstream Market Companies Covered in this Report
- Shell plc
- Petronas
- PTT Exploration & Production (PTTEP)
- TotalEnergies SE
- Exxon Mobil Corp.
- Chevron Corp.
- ConocoPhillips
- BP plc
- Eni SpA
- Woodside Energy
- Harbour Energy
- Medco Energi
- Pertamina
- Vietnam Oil & Gas Group (PVN)
- Mubadala Energy
- Jadestone Energy
- KrisEnergy
- Halliburton
- Schlumberger
- Baker Hughes
Read Analysis of Southeast Asia Oil And Gas Upstream Companies
Market Opportunities and Future Outlook
Deep-water and high-CO2 gas development creates an opportunity set for new upstream spending, supported by new discoveries, contracting activity, and gas offtake steps that reduce project risk. Eni announced Geliga-1 discovery in Indonesia in April 2026 (5 Tcf of gas and 300 million barrels of condensate), reinforcing the Kutei Basin as a focal point for offshore developments and related demand for drilling, subsea, FPSO, and gas processing services. In parallel, Eni, PETRONAS, and Searah awarded a USD 2 billion EPCI contract in July 2026 to the Saipem and PT Tripatra joint venture for an FPSO for the Kutei North Hub gas development, signaling a near-term work scope for regional fabrication yards, offshore construction, and marine logistics centered on Indonesia and Malaysia.
A second opportunity track is domestic-gas monetization and infrastructure-linked upstream, where projects are increasingly sequenced around local supply obligations and accelerated approvals rather than relying solely on export strategies. Perenco Vietnam signed a gas sales and purchase agreement in June 2026 for Su Tu Trang Phase 2B (Block 15-1) to supply the domestic market, showing how smaller and mid-sized developments can progress with secured offtake and country energy-security priorities. Region-wide methane and emissions management frameworks are also gaining commercial relevance: the ASCOPE-led Methane Management Roadmap (with ASEAN Centre for Energy involvement) creates common expectations for monitoring and abatement, which expands service demand for measurement, verification, and emissions-reduction solutions alongside CCS-ready sour-gas field developments in Malaysia and Indonesia.
Recent Industry Developments in Southeast Asia Oil And Gas Upstream Market
- July 2026: Eni, PETRONAS, and Searah awarded a USD 2 billion EPCI contract to the Saipem and PT Tripatra joint venture for an FPSO tied to the Kutei North Hub gas development offshore Indonesia. The award moves the project into an execution phase and improves demand visibility for regional fabrication, offshore installation, and subsea-related services. It also highlights a shift toward large-scale, integrated offshore gas hubs as a central investment theme in Southeast Asia.
- June 2026: Perenco Vietnam signs a gas sales and purchase agreement for Su Tu Trang Phase 2B (Block 15-1) to supply the domestic market, highlighting a pathway for smaller and mid-sized developments to progress via secured offtake and country energy-security priorities. The deal sets a domestic allocation precedent and supports near-term activity in Vietnam's gas sector.
- April 2026: Eni announces Geliga-1 discovery in Indonesia (5 Tcf gas and 300 million barrels of condensate), reinforcing the Kutei Basin as a focal point for offshore developments and related demand for drilling, subsea, FPSO, and gas processing services. The discovery supports continued exploration momentum in the region and informs capex planning for associated facilities.
Southeast Asia Oil And Gas Upstream Market Report Scope and Research Methodology
Market Definition and Coverage
This market is defined as the annual spending and activity value tied to upstream oil and gas work in Southeast Asia, starting from exploration through field development, production operations, and end-of-life work. It reflects what operators and partners spend to find, develop, and produce hydrocarbons across the region.
Scope exclusions: This sizing does not include midstream or downstream infrastructure, refined products, or retail fuel sales.
Segments Covered in This Report
- By Location of Deployment
- Onshore
- Offshore
- By Resource Type
- Crude Oil
- Natural Gas
- By Well Type
- Conventional
- Unconventional
- By Service
- Exploration
- Development and Production
- Decomissioning
- By Geography
- Indonesia
- Malaysia
- Thailand
- Vietnam
- Philippines
- Singapore
- Myanmar
- Rest of Southeast Asia
Data Sources, Market Sizing, and Validation
Desk Research
Desk work was used to set the factual backbone for the model, before assumptions were added. We leaned on public statistics and technical releases to understand upstream direction by country, including energy ministries and petroleum regulators, national statistics offices, and central bank macro series for inflation and FX.
A second layer came from operator and contractor disclosures, such as annual reports, investor presentations, and project updates, which helped us map development timelines and typical spend phasing. For production and reserves context, we also used sources such as the U.S. EIA, OPEC annual publications, and peer reviewed journals on offshore development and recovery factors. Where it fit the question, we then cross-checked trade and equipment signals using an import export shipment-level database. The desk sources listed here are illustrative only, and many other public documents and datasets were also referenced for collection, validation, and clarification.
Primary Interviews and Surveys
Primary work was used to pressure-test the desk findings and to avoid relying on a single public narrative. We spoke with upstream focused respondents across operators, service providers, and engineering groups, and coverage was balanced across APAC sub-regions to validate cost cycles, offshore versus onshore mix, and near-term project pacing.
Distribution of primary research fieldwork respondents
| Company type | Respondent position |
|---|---|
| Top tier: 36% | CXOs: 18% |
| Mid tier: 46% | Functional/Unit leaders: 27% |
| Smaller Players: 18% | Managers: 55% |
Market-Sizing & Forecasting
Sizing started with a top-down build that reconstructs upstream spend by linking country-level production and development activity to typical cost intensity, and then rolling it up across Southeast Asia. To keep it practical, the core inputs were a short list of measurable fingerprints, including liquids and gas production trends, the offshore share of new projects, drilling and well activity direction, indicative development CAPEX timing, and service-cost inflation (which is then adjusted using currency timing).
Once the regional total was formed, it was corroborated with selective bottom-up approximations, such as sampling project pipelines and applying spend profiles by phase, and then using interviewed ranges to sanity-check implied cost per barrel-of-oil-equivalent additions. Where direct signals were thin for smaller basins, gaps were handled by using proxy variables like nearby-country cost curves, operator guidance ranges, and observed decline rates, and then the assumptions were rechecked in calls.
For forecasting, scenario analysis was applied around a base case that reflects expected sanctioning pace, offshore execution capacity, and cost-cycle behavior, and then we layered in a light ARIMA style time-series check for production-linked variables so short-term volatility did not over-shift the long run view. Final numbers were kept traceable back to a few drivers that can be explained on a client call without special tooling.
Data Validation & Update Cycle
Triangulation was done by comparing the model outputs against independent signals, such as production series, visible project starts, and the implied CAPEX-to-production relationship, and then checking if any country totals looked out of line. When a variance was found, the assumptions were reopened, followed by a second pass that rechecks units, FX timing, and whether offshore developments were being double counted across phases.
Before sign-off, results go through multi-step analyst review so that the narrative and the math stay consistent. Reports are refreshed annually, with interim updates triggered by material events such as large project sanctions, major fiscal changes, or sharp service-cost swings, and a final pre-delivery pass is done so clients receive the latest updated view.
Mordor Intelligence's Southeast Asia Oil and Gas Upstream Market Sizing Compared With Other Published Estimates
Published market sizes for Southeast Asia upstream can look far apart, even when the title sounds the same, because the counting rules are often different. The biggest differences usually come from what is treated as upstream spend versus broader oil and gas value chain activity, and also from how offshore project cycles and currency timing are handled.
Another common driver is whether estimates are anchored to operator CAPEX and project phase timing, or whether they use a wider revenue proxy that can pull in adjacent services and pass-through items. Forecast stance matters too, since some figures lean aggressive on new sanctions, while others assume delays or cost deflation that is not supported by current contracting signals.
Benchmark comparison
| Source | Market Size | Gaps in Research Methodology |
|---|---|---|
| Mordor Intelligence | USD 28.47 B (2025) | |
| Global Consultancy A | USD 98.40 B (2024) | This figure appears to use a much broader spend pool and can effectively include non-upstream value-chain items or pass-through revenues, which inflates totals versus an E&P-only construct, and it is anchored to a different year. |
| Regional Publisher B | USD 31.52 B (2026) | The sizing is presented from a later base year and may apply faster project sanctioning and higher offshore activity weighting, which can lift the near-term starting point if cost-cycle escalation is pushed through uniformly. |
The table shows that the spread is driven more by scope and timing than by one single demand signal. In Mordor Intelligence's model, the market is counted only for upstream exploration, development and production, plus decommissioning, across Southeast Asia, rather than folding in midstream or downstream value. With that tighter counting rule, plus country-level checks on production direction and project phase pacing, the estimate stays easier to reconcile and repeat when the next update cycle is run.
Key Questions Answered in the Report
How large is the Southeast Asia oil and gas upstream market in 2026?
The market is valued at USD 30.02 billion in 2026.
What is the projected CAGR through 2031?
Aggregate revenue is forecast to grow at a 5.45% CAGR from 2026 to 2031.
Which country leads regional production?
Indonesia accounts for 35.12% of 2025 revenue, reflecting its extensive resource base and improved PSC terms.
Why is natural gas gaining share?
Power-sector decarbonization and petrochemical expansion are lifting demand, pushing gas volumes at an 8.08% CAGR to 2031.
What drives decommissioning growth?
Aging infrastructure with 1,500 offshore platforms nearing end-of-life is spurring an 7.78% CAGR in decommissioning services.
How are equipment shortages impacting projects?
Rig and subsea scarcity has raised dayrates, delaying developments by up to 12 months and increasing capital costs.