Southeast Asia Foodservice Market Size and Share
Market Overview
| Study Period | 2021 - 2031 |
|---|---|
| Forecast Data Period | 2026 - 2031 |
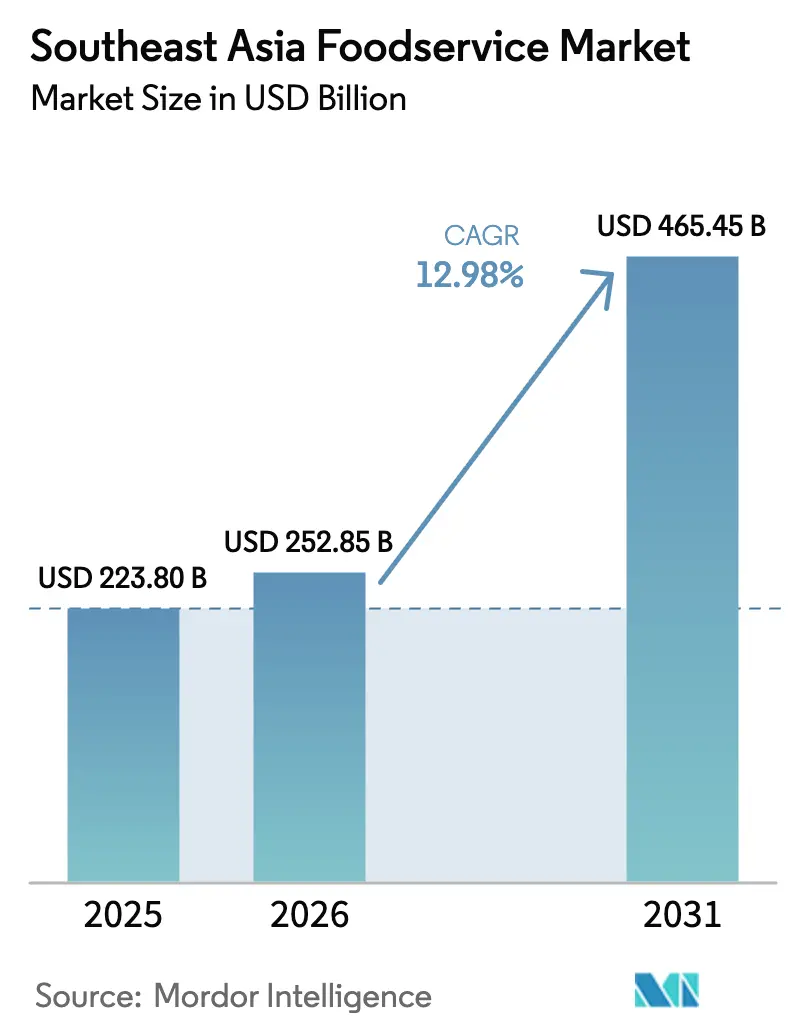
| Base Year Market Size (2025) | USD 223.80 Billion |
| Market Size (2026) | USD 252.85 Billion |
| Market Size (2031) | USD 465.45 Billion |
| Growth Rate (2026 - 2031) | 12.98% CAGR |
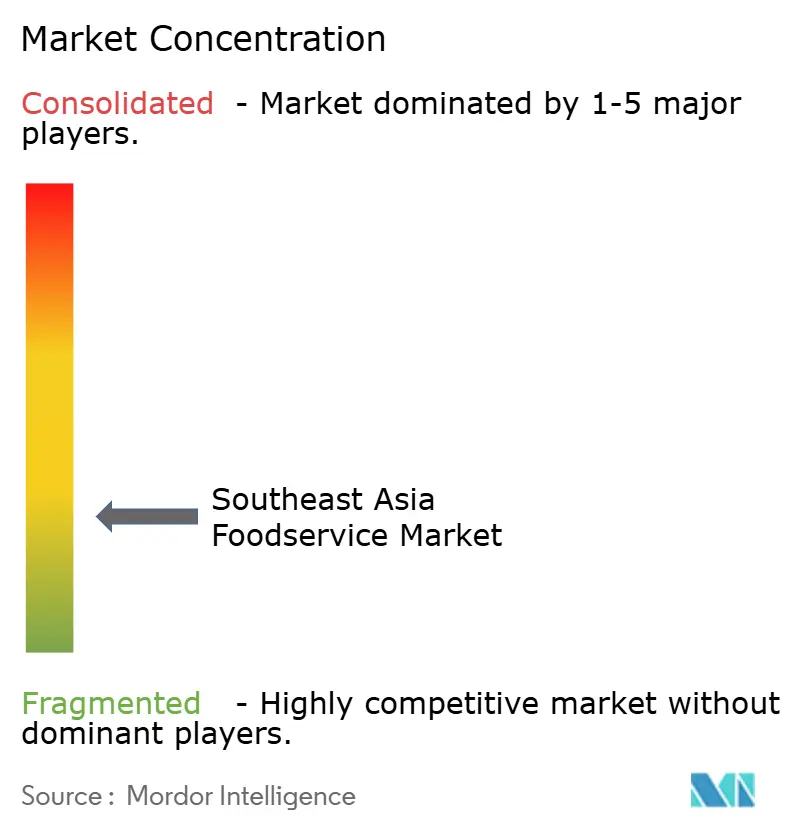
| Market Concentration | Low |
Major Players
*Disclaimer: Major Players sorted in no particular order Image © Mordor Intelligence. Reuse requires attribution under CC BY 4.0. |
|
Southeast Asia Foodservice Market Analysis by Mordor Intelligence
The Southeast Asia foodservice market size is expected to grow from USD 223.80 billion in 2025 to USD 252.85 billion in 2026 and is forecast to reach USD 465.45 billion by 2031 at 12.98% CAGR over 2026-2031. Economic growth, urbanization, and rising smartphone use are expanding the consumer base for restaurants and delivery services. Between 2022 and 2023, international visitor arrivals nearly doubled, boosting spending at hotels and street-side venues. The rise of quick service formats and cloud kitchens underscores a market shift in Southeast Asia, prioritizing convenience, speed, and a leaner expansion model. While independent operators dominate the outlet landscape, chained groups are rapidly scaling, harnessing franchising, technology, and centralized purchasing. Delivery aggregators, spearheaded by Grab, are intensifying competition, pushing restaurants to refine their commission strategies and in-store economics for better profitability.
Key Report Takeaways
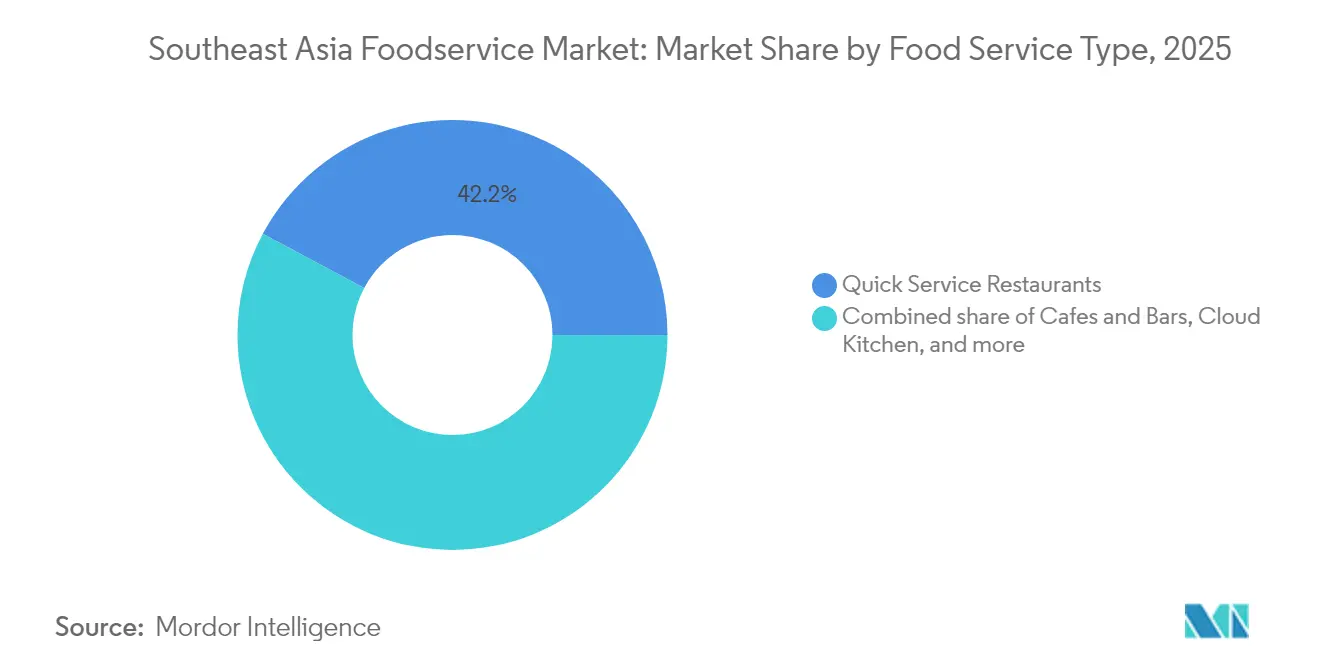
- By foodservice type, quick service restaurants commanded 42.20% of Southeast Asia foodservice market share in 2025, while cloud kitchens are forecast to expand at a 18.62% CAGR through 2031.
- By outlet, independents held 69.10% share of the Southeast Asia foodservice market size in 2025; chained outlets are advancing at a 13.29% CAGR to 2031.
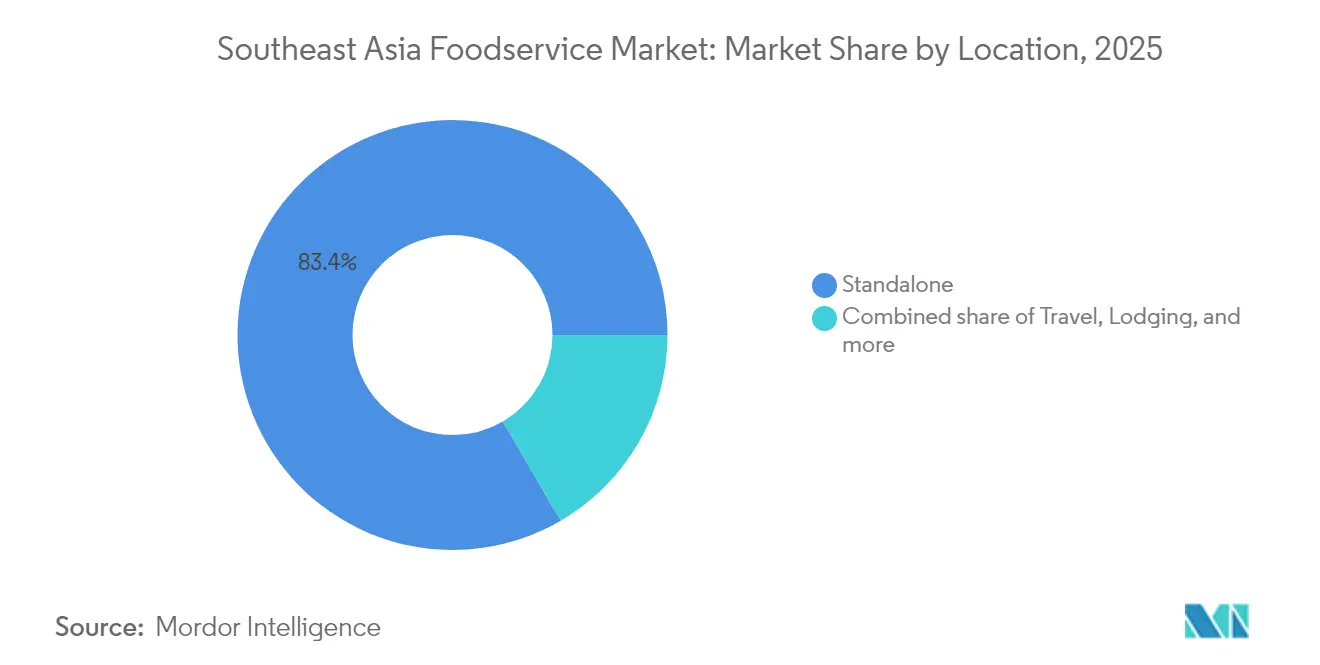
- By location, standalone venues secured 83.40% share in 2025, whereas travel-based outlets are projected to rise at a 14.67% CAGR over 2026-2031.
- By service type, dine-in retained 64.20% revenue share in 2025, and delivery services are set to climb at a 17.52% CAGR during the forecast period.
- By Geography, indonesia venues secured 30.70% share in 2025, whereas Singapore is projected to rise at a 16.85% CAGR over 2026-2031.
Note: Market size and forecast figures in this report are generated using Mordor Intelligence’s proprietary estimation framework, updated with the latest available data and insights as of 2026.
Southeast Asia Foodservice Market Trends and Insights
Drivers Impact Analysis*
| Drivers | (~) % Impact on CAGR Forecast | Geographic Relevance | Impact Timeline |
|---|---|---|---|
| Rapid Adoption of Digital Ordering and Delivery | +3.2% | ASEAN-wide, strongest in Singapore, Thailand, Vietnam | Short term (≤ 2 years) |
| Cloud and Virtual Kitchens Drive Concept Testing and Market Reach | +2.8% | Urban centers across Indonesia, Malaysia, Philippines | Medium term (2-4 years) |
| Personalization Through Build-Your-Own Formats and Data-Driven Offers | +1.9% | Tech-savvy markets: Singapore, Thailand, urban Malaysia | Medium term (2-4 years) |
| Tourism and Hospitality Integration Boosts Dining | +2.1% | Tourism-dependent: Thailand, Singapore, Indonesia, Philippines | Short term (≤ 2 years) |
| Health and Wellness Trends Focus on Clean Labels and Plant-Forward Menus | +1.7% | Higher-income segments across ASEAN, led by Singapore, Malaysia | Long term (≥ 4 years) |
| End-To-End Operational Tech Including POS, Kitchen Automation, and Contactless Payments | +1.5% | Chain operators across all markets, gradual independent adoption | Medium term (2-4 years) |
| Source: Mordor Intelligence | |||


Rapid Adoption of Digital Ordering and Delivery
Digital ordering platforms have transformed the foodservice value chain in Southeast Asia, offering more than just convenience. These platforms use real-time data to help restaurants accurately predict demand and manage inventory more efficiently. This has enabled many restaurants to reduce food waste by up to 23% through predictive ordering systems. Vietnam is leading this digital transformation, supported by rapid urbanization—now exceeding 40%—and a large online population of approximately 88 million internet users in 2024[1]International Telecommunication Union, "Number of internet users in Vietnam from 2014 to 2029", www.itu.int. Apps like Grab are reshaping the market with integrated business models that combine food delivery, digital payments, loyalty programs, and merchant financing into a single platform. This integration not only increases customer lifetime value for platforms but also helps restaurants lower their customer acquisition costs. As these digital ecosystems expand, they are improving operational efficiency and redefining how restaurants engage with consumers in Southeast Asia’s fast-changing foodservice market.
Cloud and Virtual Kitchens Drive Concept Testing and Market Reach
Cloud kitchens, which initially gained traction during the pandemic, have now become a crucial growth strategy in Southeast Asia's foodservice market. These kitchens enable restaurant brands to test new ideas and expand rapidly while keeping costs significantly lower—requiring 60–70% less investment compared to traditional dine-in restaurants. However, as the market matures, challenges like high delivery costs and limited brand differentiation are leading to consolidation. This trend is particularly evident in Singapore, where several operators have shut down. To remain competitive, leading cloud kitchen players are focusing on innovation. They are adopting vertical farming to ensure a fresh supply of ingredients and using AI-driven tools to optimize menus. These strategies help reduce ingredient costs by 15–20% while maintaining consistent quality across their virtual brands. Additionally, companies like GoTo are implementing hybrid models that combine cloud kitchens with a few physical outlets. This approach improves brand visibility and strengthens customer engagement. These developments highlight a broader transformation in the region’s foodservice market, where technology and strategic expansion are reshaping how restaurant brands operate and grow.
Personalization Through Build-Your-Own Formats and Data-Driven Offers
Restaurants in Southeast Asia are increasingly adopting advanced analytics to boost sales and enhance customer engagement. By using data insights, they have raised average order values by 35–40% through personalized menu suggestions and dynamic pricing that adjusts to customer preferences and real-time demand. The popularity of "build-your-own" meal options has further improved profitability, delivering around 25% higher gross margins while simplifying inventory management with modular ingredient systems. Machine learning is also reshaping marketing strategies. Algorithms analyze customer behavior to deliver promotions at the right time, achieving conversion rates up to three times higher than traditional methods. Additionally, integrating loyalty program data with point-of-sale systems enables real-time personalization, such as tailored discounts and recommendations, resulting in a 45% increase in repeat purchases among active users. These technological advancements are helping restaurants operate more efficiently while providing customers with a personalized and engaging dining experience.
Tourism and Hospitality Integration Boosts Dining
The recovery of tourism has significantly boosted Southeast Asia's foodservice sector, with international visitor spending on food and beverages increasing by 180% between 2022 and 2024, according to the The ASEAN Secretariat[2]ASEAN Business Advisory Council, "Shaping the Future of ASEAN's Business Landscape", www.asean-bac.org. Hotels have shifted from offering basic room service to creating more premium and engaging dining experiences, such as chef-led tasting menus and themed restaurants. This strategy has been highly successful, with leading hotels reporting a 40–50% rise in food and beverage revenue per available room. Similarly, dining at airports and transit hubs has evolved into an essential part of the travel experience, rather than just a convenience. Companies like Minor International are expanding premium casual dining options that cater to both travelers and local customers seeking high-quality yet accessible meals. Additionally, the digital space is playing a growing role, as tourism boards collaborate with delivery and review platforms to promote local cuisines. These partnerships not only make destinations more attractive but also create new revenue opportunities for restaurants involved in the tourism ecosystem.
Restraints Impact Analysis*
| Restraint | (~) % Impact on CAGR Forecast | Geographic Relevance | Impact Timeline |
|---|---|---|---|
| Fragmented Regulations and Licensing Complexity | -1.8% | Cross-border operations across ASEAN, particularly Indonesia, Philippines | Long term (≥ 4 years) |
| Supply Chain Volatility for Perishables | -2.3% | Agricultural-dependent markets: Vietnam, Thailand, Indonesia, Philippines | Short term (≤ 2 years) |
| Rising Labor Costs and Staff Shortages | -2.1% | Urban centers across all markets, acute in Singapore, Malaysia | Medium term (2-4 years) |
| Aggregator Commissions and Last-Mile Costs Reduce Profitability | -1.9% | Delivery-dependent operators across all markets | Short term (≤ 2 years) |
| Source: Mordor Intelligence | |||
Fragmented Regulations and Licensing Complexity
Restaurant chains operating across multiple ASEAN markets face significant challenges due to differing regulations. Compliance costs for operators managing businesses in more than three jurisdictions typically account for 8-12% of their revenue[3].The ASEAN Secretariat, "https:///wp-content/uploads/2021/01/ASEAN-Tourism-Strategic-Plan-2016-2025.pdf", www.asean.org In Indonesia, companies must handle complex halal certification requirements, while Thailand enforces strict foreign ownership rules. Singapore adds to the complexity with its stringent food safety standards. These varying regulations demand specialized local expertise and dedicated compliance systems. Moreover, the lack of mutual recognition agreements for food safety certifications forces businesses to maintain separate quality assurance systems, increasing operational costs by 15-20% compared to competitors focused on a single market. Although recent efforts toward ASEAN economic integration show potential, implementation is not expected until after 2027, offering little immediate relief for businesses looking to expand.
Supply Chain Volatility for Perishables
Independent operators in Southeast Asia face significant cost challenges due to an average 31% post-harvest loss in fruits and vegetables, primarily because they lack cold chain infrastructure. The effects of climate change have made this issue worse, with extreme weather events causing quarterly price fluctuations of 40-60% for essential items like rice, vegetables, and seafood. Additionally, the region has a USD 60 billion investment gap in cold storage and logistics, which restricts operators from managing inventory efficiently and mitigating price volatility. While efforts to improve cross-border trade facilitation show potential, these initiatives currently address less than 30% of food import and export volumes, leaving most operators vulnerable to local supply chain disruptions.
*Our forecasts treat driver/restraint impacts as directional, not additive. The impact forecasts reflect baseline growth, mix effects, and variable interactions.
Segment Analysis
By Foodservice Type: Cloud Kitchens Reshape Traditional Boundaries
In 2025, Quick Service Restaurants (QSRs) hold a strong 42.20% market share in Southeast Asia. Their dominance is driven by efficient operations and the use of technology, which ensure consistent customer experiences across various markets. By implementing standardized processes and kitchen automation systems, QSRs have reduced their reliance on labor by 25-30%. This approach helps them manage rising wage costs while maintaining high service standards. Leading chains like McDonald's and KFC have made significant investments in digital ordering systems and mobile payment options. McDonald's, for instance, reports that most of its orders in Southeast Asia now come through digital channels. The segment continues to grow, supported by a cultural shift toward convenient dining and the busy lifestyles of the expanding middle class in urban areas of Indonesia, Thailand, and Vietnam.
Cloud Kitchens are the fastest-growing segment in the foodservice industry, with a projected CAGR of 18.62% through 2031. These kitchens are transforming the industry by focusing on delivery operations, which eliminate the need for front-of-house expenses and prime locations. Initially a solution during the pandemic, cloud kitchens have now become a key growth strategy. They allow established brands to test new ideas with 60-70% lower capital investment compared to traditional outlets. GoTo's plan to open 400 franchise stores by 2025 highlights the integration of cloud kitchens with digital platforms. This model provides restaurant partners with essential technology support, including payment processing, customer acquisition, and inventory management. However, in mature markets like Singapore, operators face challenges such as standing out in a crowded market and improving delivery efficiency as consolidation pressures increase.


By Outlet: Independent Heritage Versus Chain Scalability
In 2025, independent outlets hold a dominant 69.10% market share, reflecting Southeast Asia's strong preference for authentic, locally-inspired food experiences. These outlets, often family-owned and passed down through generations, thrive by offering flexible menus and culturally authentic dishes. They play a vital role as community gathering spots, especially in densely populated urban areas. Their ability to quickly adapt to local tastes and seasonal ingredients gives them an edge in customer satisfaction, often surpassing chain competitors through personalized service and customized menus. However, independent operators face growing challenges, including rising costs of ingredients, stricter regulatory requirements, and the need to adopt new technologies. Larger operators, with their administrative resources and economies of scale, are better equipped to handle these pressures.
Chained outlets are expanding rapidly, with a compound annual growth rate (CAGR) of 13.29%. Their growth is driven by better access to funding and efficient operational systems, enabling them to scale quickly across multiple markets. By investing in technology and streamlining supply chains, chains reduce food costs by 15-20% while maintaining consistent quality across locations. This gives them a significant competitive advantage over independent operators. For example, Jollibee has expanded to 200 stores in Vietnam and acquired Compose Coffee for USD 340 million, showcasing how regional chains combine cultural relevance with operational efficiency to compete with global brands. Franchise models are also gaining popularity, as they combine the efficiency of chain operations with local market expertise. This approach allows for faster expansion, reduces capital requirements for parent companies, and provides independent entrepreneurs with proven business systems.
By Location: Standalone Accessibility Versus Travel Hub Premium
In 2025, standalone locations make up 83.40% of outlets, benefiting from Southeast Asia's busy urban areas and walkable commercial districts. These locations attract high foot traffic without relying on anchor tenants or mall operators. They also have lower rental costs compared to mall-based outlets and offer more flexibility. This flexibility allows operators to adjust menus, try new service formats, and extend operating hours to meet customer needs throughout the day. The dominance of standalone locations reflects dining habits that prioritize convenience and accessibility. Many consumers prefer street-level outlets that fit easily into their daily routines, such as commuting or shopping. Additionally, standalone operators can build direct relationships with customers without sharing revenue with property managers. This independence leads to higher profit margins and enables competitive pricing to challenge delivery platforms.
Travel locations are the fastest-growing segment, with a 14.67% CAGR. This growth is driven by airport expansions and upgrades to transportation hubs in major ASEAN cities, creating opportunities for premium dining experiences for both travelers and locals. The recovery in tourism has further boosted this segment, with international visitor arrivals increasing from 39.8 million in 2022 to 91.4 million in 2023, according to the ASEAN Secretariat. As a result, demand for high-quality dining options in transit areas has grown. Airport dining has evolved from basic convenience to offering unique experiences that highlight local cuisines while meeting global service standards. This shift allows operators to charge premium prices, often earning 40-60% more than standalone locations. For example, Minor International has expanded its premium casual dining concepts in travel hubs, successfully attracting both travelers and local customers seeking elevated dining experiences.
By Service Type: Dine-In Tradition Meets Delivery Convenience
In 2025, dine-in services account for 64.20% of the market share, reflecting the strong appeal of social dining and cultural traditions in Southeast Asia. This segment has successfully adapted to changing consumer preferences by enhancing ambiance, incorporating experiential features, and using technology to improve service efficiency. These efforts ensure that the high-quality hospitality of dine-in experiences remains distinct from eating at home. Cultural celebrations, business meetings, and family gatherings continue to drive demand for dine-in services. Group dining, in particular, generates 45-60% higher average check sizes compared to individual orders. The segment’s ability to deliver memorable experiences strengthens customer loyalty and encourages repeat visits, which delivery-only models find challenging to replicate.
Delivery services are expanding rapidly, with an 17.52% CAGR, driven by the convenience they offer to urban professionals and the growing use of smartphones, now adopted by over 75% of people in major cities. The segment has evolved from basic food delivery to advanced logistics systems that use AI for routing and real-time demand forecasting, improving delivery speed and customer satisfaction. In 2024, Grab dominates the market with a gross merchandise value of USD 19.3 billion, supported by its integrated ecosystem of payments, loyalty programs, and merchant financing. However, profitability remains a concern as operators balance commission rates of 20-30% of order values while maintaining competitive pricing and high service standards.
Geography Analysis
In 2025, Indonesia holds a 30.70% share of the market, driven by its large population of 275 million and a rapidly growing middle class. This makes Indonesia the largest foodservice market in the region in terms of size and growth potential. The country's unique geography and cultural diversity create demand for a wide range of dining options, from traditional warungs to international QSR chains. These chains adapt their menus to suit local tastes and meet halal requirements. Companies like Jollibee have succeeded by localizing their offerings, while domestic players benefit from a deep understanding of local culture and strong supply chain networks. These advantages allow them to offer competitive prices and authentic flavors. The market's size also attracts significant foreign investment, as companies see Indonesia as a key base for expanding into other ASEAN markets and applying operational insights regionally.
Singapore is the fastest-growing market, with a projected CAGR of 16.85% through 2031. Its growth is fueled by its role as a regional innovation hub and its early adoption of foodservice technologies, which influence trends across Southeast Asia. Singapore's high income levels and tech-savvy consumers create ideal conditions for premium dining, delivery platforms, and advanced operational technologies. These factors result in better profitability compared to other markets in the region. For example, Chick-fil-A chose Singapore as the location for its USD 75 million Asian expansion headquarters, recognizing the country's impact on regional consumer preferences and operational practices. Additionally, Singapore's strong regulatory framework and excellent infrastructure make it an attractive location for cloud kitchens and delivery platforms. Successful concepts often expand to nearby markets after proving their viability in Singapore's competitive environment.
Competitive Landscape
In Southeast Asia, the foodservice market thrives on fragmentation, boasting a mix of local and international players. These players span various segments, from quick-service restaurants and full-service dining to cafés and the ever-popular street food. Local vendors, with their keen grasp of regional tastes, price sensitivities, and built-up consumer trust, continue to hold the reins. On the other hand, global giants like McDonald's, Yum! Brands (encompassing KFC, Pizza Hut, and Taco Bell), Jollibee, Starbucks, and Subway's Doctor’s Associates are not just spectators; they're aggressively expanding, leveraging franchising and strategic partnerships to cement their presence. This blend of traditional local eateries and global brands fuels fierce competition and a rich tapestry of offerings.
This market fragmentation mirrors the region's rich cultural and culinary diversity. Here, local cuisines reign, convenience is paramount, and affordability drives choices. To navigate this dynamic landscape, players are honing in on menu localization, embracing digital ordering, and ramping up delivery services. As diners increasingly lean towards convenience and unique food experiences, the market may witness a wave of consolidation through mergers, acquisitions, and franchise growth.
Yet, with a diverse consumer base and robust local loyalty, the market's fragmentation is poised to persist in the short term. Both global and regional brands are vying for growth across varied income brackets and urban locales. Emerging opportunities lie in health-centric dining, the premium casual segment, and tech-driven personalized services, all catering to the modern consumer's desire for convenience and customization. Meanwhile, regulatory moves in several ASEAN nations target commission rates and market concentration, hinting at potential shifts in the delivery ecosystem's competitive landscape in the coming years.
Southeast Asia Foodservice Industry Leaders
-
Jollibee Foods Corporation
-
McDonald's Corporation
-
Starbucks Corporation
-
Yum! Brands Inc.
-
Doctor’s Associates Inc. (Subway)
- *Disclaimer: Major Players sorted in no particular order

Recent Industry Developments
- October 2025: Malaysia’s OldTown White Coffee announced its plan of P400 million expansion in the Philippines focused on Visayas and Mindanao over the next five years, anchored by its Philippine licensee Del Mundo Group and a growing presence starting with Zamboanga City openings. According to the company, the investment will fund 20 new outlets—split evenly between Mindanao and Visayas—building on the brand’s 11-store footprint since its 2023 debut and targeting emerging regional hubs beyond Metro Manila.
- March 2025: Eat Pizza has opened its second Philippine branch at SM Mall of Asia after debuting at SM North EDSA, signaling a steady buildout of the Korean 10‑inch “slide” pizza concept locally in 2025. The MOA store sits on the 3rd floor of the North Entertainment Mall. It showcases the brand’s individual rectangular pizzas and Korean‑inspired flavors, with management indicating more locations are slated this year as momentum builds.
- July 2025: Blue Bottle Coffee inaugurated a new café at Paragon, its second outlet in Singapore and the first in the Orchard Road area. This expansion reflected the brand's commitment to enhancing its presence in key urban locations and catering to a diverse customer base.
- September 2024: ZUS Coffee secured RM250 million investment from consortium including KV Asia Capital, KWAP, and Indonesia's Kapal Api Group to accelerate regional expansion into Singapore, Brunei, and additional Southeast Asian markets. The funding supports the company's growth from 18 stores in 2020 to approximately 600 stores regionally by 2024, demonstrating the scalability of tech-enabled coffee chains in Malaysia's competitive market.


Southeast Asia Foodservice Market Report Scope
Cafes & Bars, Cloud Kitchen, Full Service Restaurants, Quick Service Restaurants are covered as segments by Foodservice Type. Chained Outlets, Independent Outlets are covered as segments by Outlet. Leisure, Lodging, Retail, Standalone, Travel are covered as segments by Location. Indonesia, Malaysia, Philippines, Singapore, Thailand, Vietnam are covered as segments by Country.| Cafes & Bars | By Cuisine | Bars & Pubs |
| Cafes | ||
| Juice/Smoothie/Desserts Bars | ||
| Specialist Coffee & Tea Shops | ||
| Cloud Kitchen | ||
| Full Service Restaurants | By Cuisine | Asian |
| European | ||
| Latin American | ||
| Middle Eastern | ||
| North American | ||
| Other FSR Cuisines | ||
| Quick Service Restaurants | By Cuisine | Bakeries |
| Burger | ||
| Ice Cream | ||
| Meat-based Cuisines | ||
| Pizza | ||
| Other QSR Cuisines |
| Chained Outlets |
| Independent Outlets |
| Leisure |
| Lodging |
| Retail |
| Standalone |
| Travel |
| Dine-in |
| Takeaway |
| Delivery |
| Indonesia |
| Malaysia |
| Philippines |
| Singapore |
| Thailand |
| Vietnam |
| Rest of Southeast Asia |
| Foodservice Type | Cafes & Bars | By Cuisine | Bars & Pubs |
| Cafes | |||
| Juice/Smoothie/Desserts Bars | |||
| Specialist Coffee & Tea Shops | |||
| Cloud Kitchen | |||
| Full Service Restaurants | By Cuisine | Asian | |
| European | |||
| Latin American | |||
| Middle Eastern | |||
| North American | |||
| Other FSR Cuisines | |||
| Quick Service Restaurants | By Cuisine | Bakeries | |
| Burger | |||
| Ice Cream | |||
| Meat-based Cuisines | |||
| Pizza | |||
| Other QSR Cuisines | |||
| Outlet | Chained Outlets | ||
| Independent Outlets | |||
| Location | Leisure | ||
| Lodging | |||
| Retail | |||
| Standalone | |||
| Travel | |||
| Service Type | Dine-in | ||
| Takeaway | |||
| Delivery | |||
| Country | Indonesia | ||
| Malaysia | |||
| Philippines | |||
| Singapore | |||
| Thailand | |||
| Vietnam | |||
| Rest of Southeast Asia | |||


Market Definition
- FULL-SERVICE RESTAURANTS - A foodservice establishment where customers are seated at a table, give their order to a server and are served food at a table.
- QUICK SERVICE RESTAURANTS - A foodservice establishment that provides customers convenience, speed, and food offerings at lower prices. Customers usually help themselves and carry their own food to their tables.
- CAFES & BARS - A type of foodservice business that include bars and pubs that are licensed to serve alcoholic drinks for consumption, cafes that serve refreshments and light food items, as well as specialty tea and coffee shops, dessert bars, smoothie bars, and juice bars.
- CLOUD KITCHEN - A foodservice business that utilizes a commercial kitchen for the purpose of preparing food for delivery or takeout only, with no dine-in customers.
| Keyword | Definition |
|---|---|
| Albacore Tuna | It is one of the smallest species of tuna found in the six distinct stocks known globally in the Atlantic, Pacific, and Indian oceans, as well as the Mediterranean Sea. |
| Angus beef | It is beef derived from a specific breed of cattle indigenous to Scotland. It requires certification from the American Angus Association to receive the "Certified Angus Beef" quality mark. |
| Asian cuisine | It includes full-service offerings in restaurants that serve cuisines from cultures such as Chinese, Indian, Korean, Japanese, Bengali, Southeast Asian, etc. |
| Average Order Value | It is the average value of all orders made by the customers at a foodservice establishment. |
| Bacon | It is salted or smoked meat that comes from the back or sides of a pig. |
| Bars & Pubs | It is a drinking establishment that is licensed to serve alcoholic drinks for consumption on the premises. |
| Black Angus | It is beef derived from a black-hided breed of cows that don't have horns. |
| BRC | British Retail Consortium |
| Burger | It is a sandwich consisting of one or more cooked beef patties, placed inside a sliced bread roll or bun roll. |
| Café | It is a foodservice establishment serving various refreshments (mainly coffee) and light meals. |
| Cafes & Bars | It is a type of foodservice business that include bars and pubs that are licensed to serve alcoholic drinks for consumption, cafes that serve refreshments and light food items, as well as specialty tea and coffee shops, dessert bars, smoothie bars, and juice bars. |
| Cappuccino | It is an Italian coffee drink that is traditionally prepared with equal parts double espresso, steamed milk, and steamed milk foam. |
| CFIA | Canadian Food Inspection Agency |
| Chained Outlet | It refers to a foodservice establishment that shares brands, operates in several locations, has central management, and standardized business practices. |
| Chicken Tender | It refers to chicken meat prepared from the pectoralis minor muscles of a chicken bird. |
| Cloud Kitchen | It is a foodservice business that utilizes a commercial kitchen for the purpose of preparing food for delivery or takeout only, with no dine-in customers. |
| Cocktail | It is an alcoholic mixed drink made with either a single spirit or a combination of spirits, mixed with other ingredients such as juices, flavored syrups, tonic water, shrubs, and bitters. |
| Edamame | It is a Japanese dish prepared with soybeans (harvested before they ripen or harden) and cooked in its pod. |
| EFSA | European Food Safety Authority |
| ERS | Economic Research Service of the USDA |
| Espresso | It is a concentrated form of coffee, served in shots. |
| European cuisine | It includes full-service offerings in restaurants that serve cuisines from cultures such as Italian, French, German, English, Dutch, Danish, etc. |
| FDA | Food and Drug Administration |
| Fillet Mignon | It is a cut of meat taken from the smaller end of the tenderloin. |
| Flank Steak | It is a cut of beef steak taken from the flank, which lies forward of the rear quarter of a cow. |
| Foodservice | It refers to the part of the food industry which includes businesses, institutions, and companies which prepare meals outside the home. It includes restaurants, school and hospital cafeterias, catering operations, and many other formats. |
| Franks | Also known as frankfurter or Würstchen, it is a type of highly seasoned smoked sausage popular in Austria and Germany. |
| FSANZ | Food Standards Australia New Zealand |
| FSIS | Food Safety and Inspection Service |
| FSSAI | Food Safety and Standards Authority of India |
| Full service restaurant | It refers to a foodservice establishment where customers are seated at a table, give their order to a server, and are served food at a table. |
| Ghost Kitchen | It refers to a cloud kitchen. |
| GLA | Gross Leasable Area |
| Gluten | It is a family of proteins found in grains, including wheat, rye, spelt, and barley. |
| Grain-fed beef | It is beef derived from cattle that have been fed a diet supplemented with soy and corn and other additives. Grain-fed cows can also be given antibiotics and growth hormones to fatten them up more quickly. |
| Grass-fed beef | It is beef derived from cattle that have only been fed grass as feed. |
| Ham | It refers to the pork meat taken from the leg of a pig. |
| HoReCa | Hotels, Restaurants and Cafes |
| Independent Outlet | It refers to a foodservice establishment that operates with a single outlet or is structured as a small chain with no more than three locations. |
| Juice | It is a drink made from the extraction or pressing of the natural liquid contained in fruit and vegetables. |
| Latin American | It includes full-service offerings in restaurants that serve cuisines from cultures such as Mexican, Brazilian, Argentinian, Colombian, etc. |
| Latte | It is a milk-based coffee that is made up of one or two shots of espresso, steamed milk, and a thin layer of frothed milk. |
| Leisure | It refers to foodservice offered as a part of a recreation business, such as sports arenas, zoos, movie theaters, and museums. |
| Lodging | It refers to foodservice offerings at hotels, motels, guesthouses, holiday homes, etc. |
| Macchiato | It is an espresso coffee drink with a small amount of milk, usually foamed. |
| Meat-based cuisines | This inlcudes food items like fried chicken, steak, ribs, etc. where meat is the primary ingredient for the dish. |
| Middle Eastern cuisine | It includes full-service offerings in restaurants that serve cuisines from cultures such as Arabic, Lebanese, Iranian, Israeli, etc. |
| Mocktail | It is an non-alcoholic mixed drink. |
| Mortadella | It is a large Italian sausage or luncheon meat made of finely hashed or ground heat-cured pork, which incorporates at least 15% small cubes of pork fat. |
| North American | It includes full-service offerings in restaurants that serve cuisines from cultures such as American, Canadian, Caribbean, etc. |
| Pastrami | It refers to a highly seasoned smoked beef, typically served in thin slices. |
| PDO | Protected Designation of Origin: It is the name of a geographical region or specific area that is recognized by official rules to produce certain foods with special characteristics related to location. |
| Pepperoni | It is an American variety of spicy salami made from cured meat. |
| Pizza | It is a dish made typically of flattened bread dough spread with a savory mixture usually including tomatoes and cheese and often other toppings and baked. |
| Primal cuts | It refers to the major sections of the carcass. |
| Quick service restaurant | It refers to a foodservice establishment that provides customers convenience, speed, and food offerings at lower prices. Customers usually help themselves and carry their own food to their tables. |
| Retail | It refers to a foodservice outlet inside a mall. shopping complex or a commercial real estate building, where there are other businesses operating as well. |
| Salami | It is a cured sausage consisting of fermented and air-dried meat. |
| Saturated fat | It is a type of fat in which the fatty acid chains have all single bonds. It is generally considered unhealthy. |
| Sausage | It is a meat product made of finely chopped and seasoned meat, which may be fresh, smoked, or pickled and which is then usually stuffed into a casing. |
| Scallop | It is an edible shellfish that is a mollusk with a ribbed shell in two parts. |
| Seitan | It is a plant-based meat substitute made out of wheat gluten. |
| Self-service kiosk | It refers to a self-order point-of-sale (POS) system through which customers place and pay for their own orders at kiosks, enabling totally contactless and frictionless service. |
| Smoothie | It is a beverage made by placing all the ingredients in a container and processing them together, without removing the pulp. |
| Specialty coffee & tea shops | It refers to a foodservice establishment that serves only various types of tea or coffee. |
| Standalone | It refers to a restaurants that have an independent infrastructure setup and not connected to any other business. |
| Sushi | It is a Japanese dish of prepared vinegared rice, usually with some sugar and salt, accompanied by a variety of ingredients, such as seafood—often raw—and vegetables. |
| Travel | It refers to foodservice offerings such as airplane food, dining on long-distance trains, and foodservice on cruise ships. |
| Virtual Kitchen | It refers to a cloud kitchen. |
| Wagyu Beef | It is beef derived from any of four strains of a breed of black or red Japanese cattle that are valued for their highly marbled meat. |


Research Methodology
Mordor Intelligence follows a four-step methodology in all our reports.
- Step-1: Identify Key Variables: In order to build a robust forecasting methodology, the variables and factors identified in Step 1 are tested against available historical market numbers. Through an iterative process, the variables required for the market forecast are set, and the model is built on the basis of these variables.
- Step-2: Build a Market Model: Market size estimations for the forecast years are in nominal terms. Inflation is considered for average order value, and it is forecasted as per predicted inflation rates in the countries.
- Step-3: Validate and Finalize: In this important step, all market numbers, variables, and analyst calls are validated through an extensive network of primary research experts from the market studied. The respondents are selected across levels and functions to generate a holistic picture of the market studied.
- Step-4: Research Outputs: Syndicated Reports, Custom Consulting Assignments, Databases & Subscription Platforms


