
Market Overview
| Study Period | 2021 - 2031 |
|---|---|
| Forecast Data Period | 2026 - 2031 |
| Base Year Market Size (2025) | 44.59 gigawatt |
| Market Volume (2026) | 49.37 gigawatt |
| Market Volume (2031) | 82.11 gigawatt |
| Growth Rate (2026 - 2031) | 10.72 % |
| Market Concentration | Medium |
Major Players
*Disclaimer: Major Players sorted in no particular order Image © Mordor Intelligence. Reuse requires attribution under CC BY 4.0. |
|
South Korea Renewable Energy Market Analysis by Mordor Intelligence
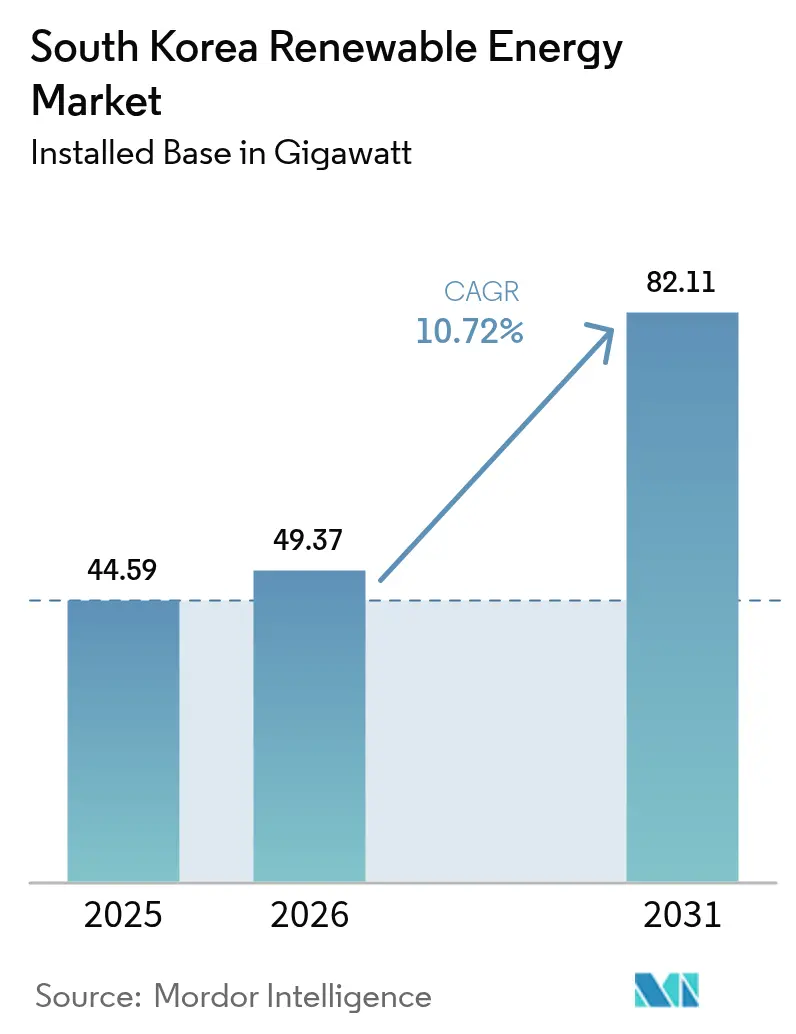
The South Korea Renewable Energy Market size is expected to grow from 44.59 gigawatt in 2025 to 49.37 gigawatt in 2026 and is forecast to reach 82.11 gigawatt by 2031 at 10.72% CAGR over 2026-2031.
Strong policy alignment with the 11th Basic Plan, a streamlined offshore wind permitting law, and rising corporate power purchase agreements jointly underpin capacity additions. Grid digital-twin deployment, mandatory REC quotas, and 1.2 trn won port upgrades for large-turbine handling accelerate the South Korean renewable energy market by lowering integration and logistics barriers. Jeju Island’s utility-scale storage pilots, KEPCO’s 29.3 trn won transmission plan, and nuclear-powered hydrogen projects further expand the technology mix as utilities pivot from thermal fleets to diversified renewables. Land-acquisition disputes and 30-month EIA cycles remain the primary bottlenecks; however, ongoing legal challenges and procedural reforms aim to ease these frictions and sustain the momentum of the South Korean renewable energy market.
Key Report Takeaways
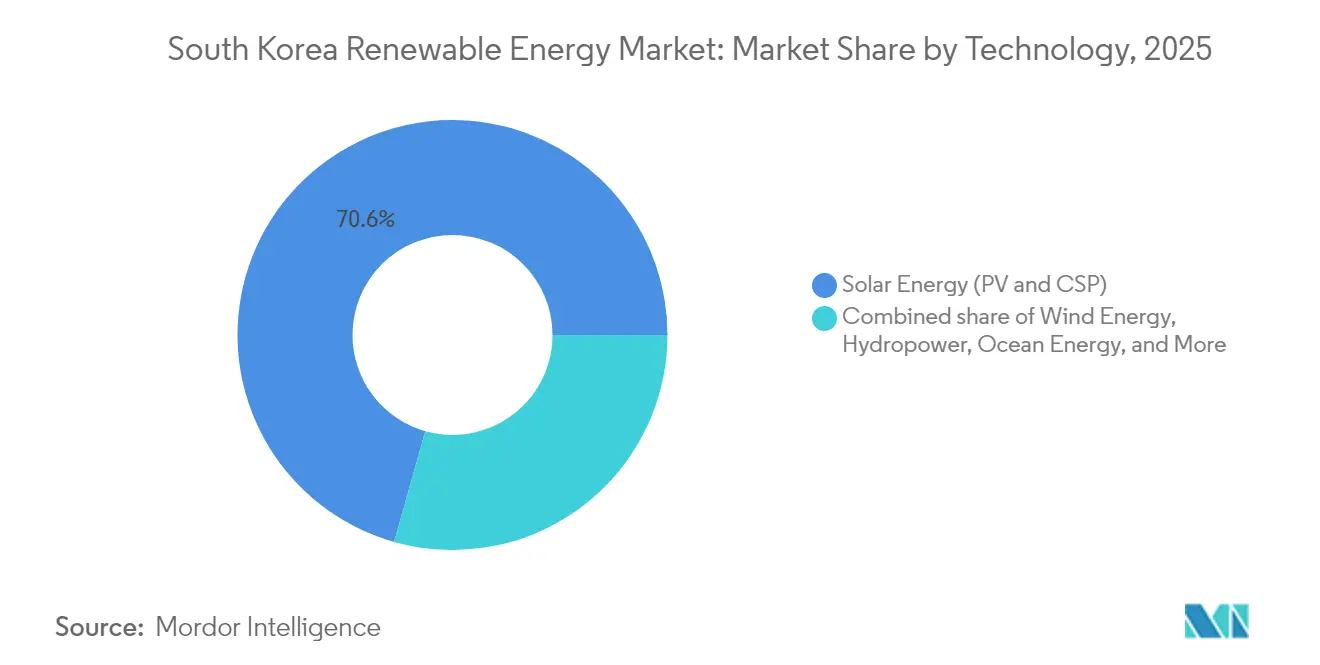
- By technology, solar energy commanded 70.62% of the South Korean renewable energy market share in 2025, while wind energy is projected to grow at a 34.92% CAGR between 2026 and 2031.
- By end-user, utilities held 59.12% of the South Korean renewable energy market share in 2025 and are expected to expand at a 12.58% CAGR through 2031.
Note: Market size and forecast figures in this report are generated using Mordor Intelligence’s proprietary estimation framework, updated with the latest available data and insights as of 2026.
South Korea Renewable Energy Market Trends and Insights
Drivers Impact Analysis*
| Driver | (~) % Impact on CAGR Forecast | Geographic Relevance | Impact Timeline | |
|---|---|---|---|---|
| Rapid Decline in Utility-Scale Solar LCOE Across South Korea | +2.1% | National, concentrated in Jeolla and Gyeonggi provinces | Medium term (2-4 years) | |
| Mandatory REC Quotas Pushing Corporates Toward PPAs | +1.8% | National, with Seoul metropolitan area leading adoption | Short term (≤ 2 years) | |
| Offshore Wind Port Infrastructure Subsidies Near Mokpo & Ulsan | +2.9% | Southwest and Southeast coastal regions | Long term (≥ 4 years) | |
| Hydrogen-to-Power Pilots Backed by KEPCO & SK E&S | +1.2% | Ulsan and Pohang industrial clusters | Long term (≥ 4 years) | |
| Jeju "Carbon-Free Island" 2030 Target Accelerating Storage-Coupled RE | +1.5% | Jeju Province, with mainland spillover effects | Medium term (2-4 years) | |
| Grid Modernization Investments (KEPCO Digital Twin Roll-out) | +2.3% | National grid infrastructure, priority on transmission corridors | Medium term (2-4 years) | |
| Source: Mordor Intelligence | ||||
Rapid Decline in Utility-Scale Solar LCOE Across South Korea
Utility-scale module prices fell 27% between early 2024 and 2025 as Hanwha Q CELLS and OCI ramped 50-100 MW projects, widened domestic wafer pulls, and benefited from tariff exemptions on imported trackers. Developers installed 1.2 GW of new solar capacity in 1H 2024, reinforcing South Korea's 71.3% solar lead in the renewable energy market. LCOE parity versus LNG is expected by 2026, shifting corporate buyers toward multi-megawatt PPAs. Despite a KRW 300.2 bn loss from oversupply, Hanwha's expanded Q ANTUM line underpins price competitiveness and secures future volume.[1]Business Korea, "Hanwha Solutions Reports 300.2 Billion Won Operating Loss," businesskorea.co.kr
Mandatory REC Quotas Pushing Corporates Toward PPAs
The Renewable Portfolio Standard requires large producers to generate 25% of their energy from renewable sources by 2026, following the implementation of direct PPAs after the Electric Utility Act amendments.[2]Mayer Brown energy alert, “South Korea opens door for direct PPAs,” MAYERBROWN.COM Hyundai’s 610 GWh, twenty-year deal exemplifies first-mover industrial demand and signals mounting pressure on peers to adopt renewable sourcing. While PPA electricity lacks REC eligibility, utilities now design hybrid structures that link certificates with hedged supply, broadening liquidity and stabilizing the South Korean renewable energy market.
Offshore Wind Port Infrastructure Subsidies Near Mokpo & Ulsan
A KWR 1.2 trillion harbor overhaul delivered heavy-lift cranes, deep-water quays, and marshalling yards capable of handling 15-MW nacelles, resulting in a 20% reduction in logistics costs. The government awarded 1.9 GW across December 2024 auctions and holds a 58.8 GW pipeline, driving the wind segment’s 36.6% CAGR and altering the South Korea renewable energy market technology mix.
Grid Modernisation Investments (KEPCO Digital Twin Roll-out)
KEPCO's KWR 29.3 trillion expansion adds 10,173 circuit kilometers and embeds a cloud-based digital twin that simulates congestion and dispatch in real-time. The 4 GW Donghaean #2 HVDC line will transport southeast renewables to Seoul, which accounts for 40% of the nation's demand. These upgrades ensure the South Korean renewable energy market can scale without curtailment spikes.
Restraints Impact Analysis*
| Restraint | (~) % Impact on CAGR Forecast | Geographic Relevance | Impact Timeline | |
|---|---|---|---|---|
| Land Acquisition Challenges for Ground-Mounted Solar in Gyeonggi & Chungcheong | -1.6% | Gyeonggi and Chungcheong provinces, urban periphery areas | Short term (≤ 2 years) | |
| Curtailment Risk Owing to 154 kV Congestion on Southwest Corridor | -1.2% | Southwest transmission corridor, Jeolla to Seoul route | Medium term (2-4 years) | |
| Local-content Rules Inflating Offshore-Wind CapEx | -0.7% | Offshore wind development zones, coastal manufacturing regions | Medium term (2-4 years) | |
| Slow Environmental Impact Assessment (EIA) Approval Cycle (>30 months) | -1.9% | National, with particular delays in environmentally sensitive areas | Long term (≥ 4 years) | |
| Source: Mordor Intelligence | ||||
Land Acquisition Challenges for Ground-Mounted Solar in Gyeonggi & Chungcheong
Setback ordinances of 100-1,000 m eliminate up to 70% of candidate plots and inflate build costs by 25%.[3]Solutions for Our Climate press office, “Citizens challenge solar-setback rules,” SOF.OR.KR Constitutional appeals filed in February 2025 target these rules as scientifically unfounded. Without repeal, capital will shift to rooftop or offshore wind, eroding solar’s current preeminence within the South Korean renewable energy market.
Slow Environmental Impact Assessment Approval Cycle (Above 30 months)
Haewoori offshore wind completed its EIA in July 2024, following a multi-year review, which illustrates a 30-month average that extends the financing risk.[4]Energy Global news desk, “Haewoori offshore wind EIA completed,” ENERGYGLOBAL.COM The March 2025 Wind Power Promotion Act pledges single-window clearance, but the entrenched agency is still delaying project realisation.
*Our forecasts treat driver/restraint impacts as directional, not additive. The impact forecasts reflect baseline growth, mix effects, and variable interactions.
Segment Analysis
By Technology: Wind Acceleration Challenges Solar Dominance
Solar energy maintained a 70.62% share of the South Korean renewable energy market in 2025, yet wind’s 34.92% CAGR signals a shift. The South Korean renewable energy market size for offshore wind could exceed 26.3 GW by 2031 if the entire auction pipeline reaches financing. Removal of local-content quotas cut turbine CapEx by up to 20%, attracting Ørsted and Equinor, while CS Wind localised tower production. Hydropower, bioenergy, and geothermal energy remain niche options, given resource limits and the refocusing of subsidies.
A 15-MW turbine roll-out, floating-foundation pilots off Ulsan, and deeper water leasing rounds reinforce wind’s catching-up trajectory. The South Korea renewable energy market share for solar may narrow as port capacity, HVDC links, and corporate decarbonisation tilt spending toward higher-capacity-factor wind farms.



By End-User: Utilities Drive Market Transformation
Utilities controlled 59.12% of installed capacity in 2025 and posted a 12.58% CAGR through 2031 as KEPCO subsidiaries spearhead multi-GW tenders. K-RE100 uptake and Hyundai’s record PPA indicate that commercial-industrial buyers are scaling rapidly, yet non-REC eligibility tempers wider adoption. Residential growth lags, capsized by setback ordinances and limited rooftop area, though virtual-power-plant pilots harness new 540 MW/3,240 MWh storage contracts. As reform widens PPA eligibility, the South Korean renewable energy industry can progressively rebalance reliance away from incumbent utilities.

Geography Analysis
Due to strong coastal winds and deep-water ports, Jeolla provinces dominate the South Korean renewable energy market. The 8.2 GW Sinan complex anchors this lead, bolstered by the KWR 1.2 trillion infrastructure package that equips Mokpo to service turbines exceeding 15 MW. Grid plans allocate 2 GW of dedicated HVDC export capacity from Sinan to the Seoul load center once the Donghaean #2 link comes online in 2027. Robust local content incentives also foster nacelle and blade facilities that feed domestic and export orders.
Jeju Island pioneers integrated renewables, with its 16.2% renewable penetration in 2020 and the goal of achieving carbon neutrality by 2030, creating an experimental sandbox. ABB’s synchronous condenser and Hitachi’s VSC converter keep the island grid balanced despite rising variable output. Battery storage cut curtailment by 1,847 MWh between 2015 and 2019, and a green-hydrogen pilot positions Jeju as a template for mainland replication. Lessons from frequency management and rotating-inertia substitution inform national standards slated for 2026.
Industrial East Coast hubs Ulsan and Pohang are evolving into hydrogen valleys. KHNP broke ground on the country’s first nuclear-powered electrolyser in October 2025, while SK E&S advanced a USD 16 billion complex targeting 250,000 t H₂ annually. These clusters leverage proximity to steel mills and petrochemical plants, generating anchor demand for clean molecules and stabilizing renewable energy flows. Conversely, land-tight Gyeonggi and Chungcheong provinces struggle with ground-mounted solar permitting, prompting developers to opt for pricier rooftops or rural areas with longer grid feeds.
Regulatory Landscape
South Korea’s renewable buildout is shaped by the Renewable Portfolio Standard (RPS) and REC compliance, with grid rules handled under KEPCO’s transmission monopoly. Permitting also runs through environmental and maritime regimes. In May 2026, the Ministry of Climate, Energy and Environment (MCEE) announced a First Basic Plan for Renewable Energy with a 150 GW total-capacity target by 2035, which shifts implementation toward more programmatic procurement and system integration alongside ongoing grid expansion.
A key in-flight change is the May 2026 National Assembly committee passage of bills to abolish the RPS and move procurement to a government-led long-term fixed-price contract market starting in 2027. At the same time, the government introduced a Build-Transfer (BT) model that allows private participation in transmission-network construction, with assets transferred to KEPCO after completion. This widens the set of firms that can execute grid-enabling works, while KEPCO continues to retain the central system operator role.
Competitive Landscape
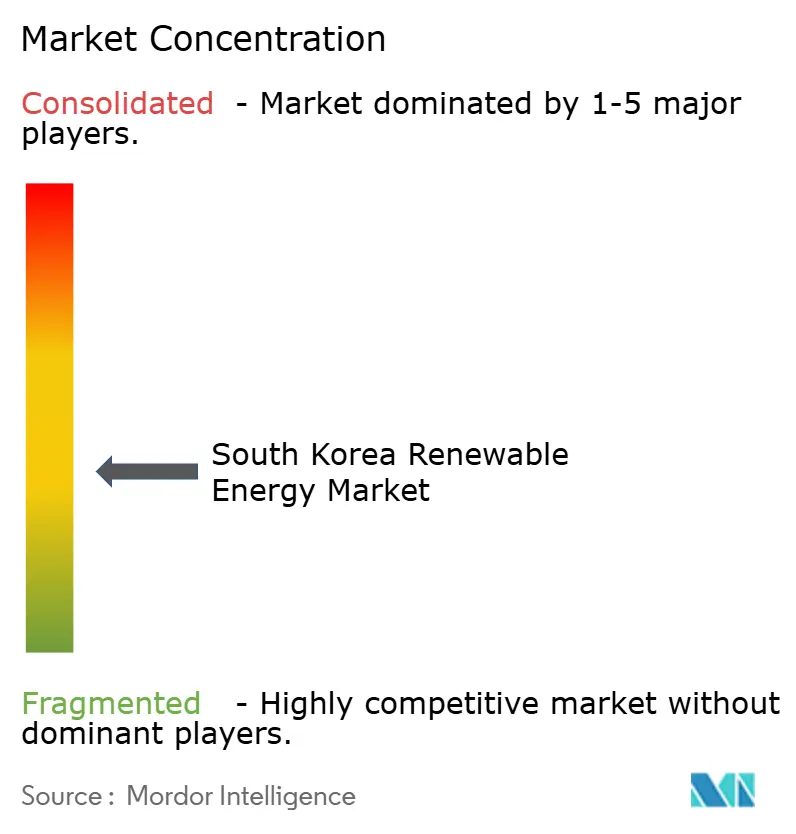
Market concentration is moderate. KEPCO’s generation subsidiaries maintain extensive pipelines but face new competition from Ørsted, Equinor, and Vena Energy in the offshore wind sector. Joint ventures such as ESVAGT-KMC Line’s service-operation-vessel tie-up fill marine capability gaps, while CS Wind-Vestas localization agreements secure power supply. Technology leadership is shifting toward 15-MW-plus turbines, with Siemens Gamesa and GE Vernova positioning themselves for the next tender round.[6]CS Wind announcement, “CS Wind-Vestas joint venture,” CSWIND.COM
Domestic conglomerates pursue vertical integration. Hanwha Q CELLS controls upstream polysilicon, modules, and EPC services, giving the firm leverage in price negotiations yet exposing it to global oversupply swings. SK E&S combines LNG trading, renewables, and hydrogen, hedging commodity volatility. KHNP’s HK$1.166 billion green nuclear bond diversifies funding and underscores nuclear-renewable synergies. Meanwhile, smaller IPPs exploit direct-PPA rules to carve out retail niches.
Cost competitiveness supplants legacy relationships as the primary criterion for tender. Developers can bundle storage or hydrogen gain evaluation points under the 2025 auction guidelines. Fleet-wide digitalization adopted by KEPCO sets performance benchmarks, prompting OEMs to embed predictive analytics into their operations and maintenance (O&M) contracts. International entrants deliver expertise in floating foundations and multi-terminal HVDC, accelerating the transfer of skills into local supply chains.
South Korea Renewable Energy Industry Leaders
-
Korea Electric Power Corporation (KEPCO)
-
Hanwha Q CELLS Co., Ltd
-
Korea Midland Power Co., Ltd (KOMIPO)
-
Korea South-East Power Co., Ltd (KOSEP)
-
SK E&S Co., Ltd
- *Disclaimer: Major Players sorted in no particular order

Market Opportunities and Future Outlook
The shift toward a government-led, long-term fixed-price contract market starting in January 2027, with legislation advancing in 2026, creates room for developers and OEMs to bid on capacity-based awards and execute bankable projects under standardized offtake terms. Offshore wind is where this format is most immediately practical, since logistics and grid interfaces tend to drive execution risk. This direction is reflected in recent procurement outcomes, including a KHNP-led group winning an 800 MW offshore wind tender in a first-half 2026 government auction, and KOMIPO securing a fixed-price contract for the 160 MW Yeosu Geumodo offshore wind project through a competitive bid in June 2026.
Grid and siting constraints also point to nearer-term demand for solutions that reduce congestion and expand hosting capacity, including storage, advanced forecasting, and grid reinforcement enabled through the newly introduced Build-Transfer route for private-sector transmission construction. In parallel, distributed and water-surface solar can be implemented with fewer land-acquisition bottlenecks; for instance, K-water began operations of the 47.2 MW Imha Dam floating solar farm in July 2026, providing a repeatable model for reservoir-based deployments on existing public-asset footprints.
Recent Industry Developments
- July 2026: Korea Midland Power (KOMIPO) began construction of the 390 MW Shinan-Wi offshore wind project after closing its financing package. The project incorporates 26 units of 15 MW-class turbines and includes an offshore substation, strengthening the domestic delivery pipeline for large-turbine offshore wind execution.
- May 2026: Hanwha Q CELLS was selected to supply about 640,000 high-efficiency solar modules manufactured at its Jincheon plant for Korea Southern Power’s 400 MW solar project in Haenam (Jeollanam-do). The award links utility-scale PV additions to domestic module production, supporting localization strategies as procurement frameworks evolve.
- April 2025: KHNP broke ground on the nation’s first nuclear-powered hydrogen plant, targeting output of 4 tons per day. The project broadens the flexibility toolkit alongside variable renewables by anchoring a low-carbon hydrogen supply option for power and industrial use cases.


Research Methodology Framework and Report Scope
Market Definition and Coverage
This market covers renewable power in South Korea measured as installed capacity, and it includes grid connected projects that add to the country total across the main renewable technologies.
Scope exclusions: Off grid captive systems without reliable capacity disclosure, renewable equipment manufacturing, and energy storage only assets are not counted as renewable capacity.
Segmentation Overview
-
By Technology
- Solar Energy (PV and CSP)
- Wind Energy (Onshore and Offshore)
- Hydropower (Small, Large, PSH)
- Bioenergy
- Geothermal
- Ocean Energy (Tidal and Wave)
-
By End-user
- Utilities
- Commercial and Industrial
- Residential
Data Sources, Market Sizing, and Validation
Desk Research
Desk work starts with mapping South Korea renewable capacity additions and the policy context that shapes project pipelines. We typically use public series and official reporting such as Korea Energy Agency releases, MOTIE policy documents, KEPCO grid and power system disclosures, and IEA and IRENA country level renewables statistics for cross checks.
To anchor realism, we also review sources such as customs trade statistics for major components, permitting and tender announcements, listed company filings and investor presentations, and reputable press coverage of commissioned plants. When useful, a paid subscription for company financials and news helps track project ownership changes and avoids missing smaller operators. Patent databases can also be used to understand technology shifts that affect performance and build rates. These are illustrative examples, and many other public and reference materials were also consulted for data collection, validation, and clarification.
Primary Interviews and Surveys
Primary work is used to validate what desk sources cannot fully explain, especially commissioning timing, realistic annual build rates by technology, and common causes of delay. We speak with developers, EPC and O&M participants, utilities and grid linked stakeholders, and selected industry bodies so assumptions get tested across the value chain and then aligned to country specific realities.
Distribution of primary research fieldwork respondents
| Company type | Respondent position |
|---|---|
| Top tier: 25% | CXOs: 12% |
| Mid tier: 61% | Functional/Unit leaders: 40% |
| Smaller Players: 14% | Managers: 48% |
Market-Sizing & Forecasting
For sizing, we start from a top-down reconstruction of national installed renewable capacity using official capacity time series, grid connection updates, and project commissioning trackers, and then we reconcile that with technology level additions. The totals are then corroborated with selective bottom-up checks, such as sampling project pipelines, using typical capacity blocks by plant type, and validating a portion of additions through developer and EPC discussions.
Inputs used in the model include annual capacity additions by technology, retirement or repowering signals, grid interconnection and congestion indicators, auction or RPS driven procurement volumes, and typical construction lead times that affect when capacity shows up in the installed base. Where a plant is announced but the capacity is not clearly disclosed, a gap handling rule is applied using comparable project sizes from confirmed builds, followed by a second review from interviews.
Forecasts are built using scenario analysis, where base, faster, and slower build cases are linked to policy enforcement signals, permitting speed, and financing availability, and then narrowed using expert consensus from fieldwork. At the end, we apply a consistency check so the forecasted capacity path stays aligned with observed build constraints and reported national targets.
Data Validation & Update Cycle
Validation is done by comparing model outputs against independent signals such as national renewable generation trends, grid connection progress, and public project commissioning announcements, before totals are finalized. Any large jumps are investigated, and if an anomaly is traced to a single large project or a change in reporting, it is documented and the assumption is revisited.
A multi-step review is followed, where one analyst rebuilds key calculations, and another checks unit consistency and year on year movements before sign-off. Reports are refreshed annually, and interim updates are done when material policy changes, major commissioning waves, or unexpected delays become visible. Before delivery, a final pass is completed so clients receive the most current view available.
Mordor Intelligence's South Korea Renewable Energy Market Size Compared Against Other Published Estimates
It is common to see different market sizes for South Korea renewable energy because publishers do not measure the same thing, even when the title looks identical. The biggest differences usually come from the chosen unit (capacity, generation, or revenue), how hybrid projects are treated, and the exact years used for conversion and updates.
Some estimates convert renewable electricity output into a market value using power price assumptions, and others report annual generation as the market size. Those broader definitions naturally move with utilization and pricing, then the installed base becomes a secondary check. For Mordor Intelligence, only installed renewable capacity in gigawatts is counted, and equipment sales, storage only assets, and output-to-revenue conversions are excluded from the total.
Benchmark comparison
| Source | Market Size | Gaps in Research Methodology |
|---|---|---|
| Mordor Intelligence | USD 49.37 B (2026) | |
| Industry Research House A | USD 16.00 B (2024) | Uses a value based definition in USD, which depends on assumed power prices, incentive pass through, and currency timing rather than capacity additions and commissioning dates. |
| Industry Publisher B | USD 60.30 B (2025) | Reports renewable electricity generation in TWh and treats that output as the market size, which shifts totals with weather, utilization rates, and curtailment even if capacity stays the same. |
The table shows that most of the spread is explained by the unit of measurement and the conversion choices that follow from it. By keeping the model tied to capacity additions, commissioning timing, and independent public signals, the final number stays traceable to observable build activity and can be repeated year to year using the same steps.


Key Questions Answered in the Report
How large is the South Korea renewable energy market today?
It stood at 49.37 GW in 2026 and is forecast to reach 82.11 GW by 2031.
Which technology is growing fastest?
Wind energy post the highest 34.92% CAGR for 2026-2031.
Why are corporate PPAs important in South Korea?
Direct PPAs let firms such as Hyundai secure long-term renewable supply outside KEPCO’s monopoly, supporting REC compliance and fixed pricing.
What grid upgrades are planned to support renewables?
KEPCO will add 10,173 circuit-km and a 4 GW HVDC link to Seoul, plus a nationwide digital-twin platform by 2034.
What is the main hurdle for new solar farms?
Municipal setback ordinances remove much developable land, prompting legal challenges and cost increases.
How is hydrogen linked to renewable growth?
Nuclear-powered electrolysers and SK’s USD 16 bn complex will supply clean hydrogen for 6,500 GWh of power bids, providing flexible back-up to variable renewables.
Page last updated on:





