Market Overview
| Study Period | 2020 - 2031 |
|---|---|
| Forecast Data Period | 2026 - 2031 |
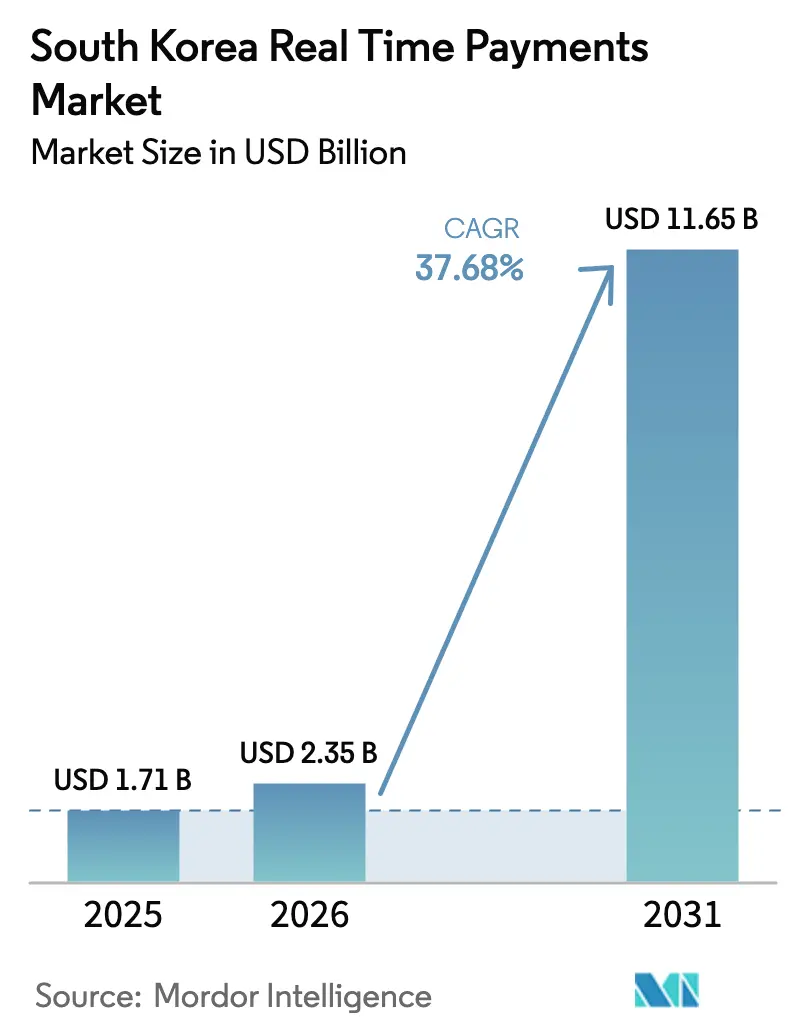
| Base Year Market Size (2025) | USD 1.71 Billion |
| Market Size (2026) | USD 2.35 Billion |
| Market Size (2031) | USD 11.65 Billion |
| Growth Rate (2026 - 2031) | 37.68% CAGR |
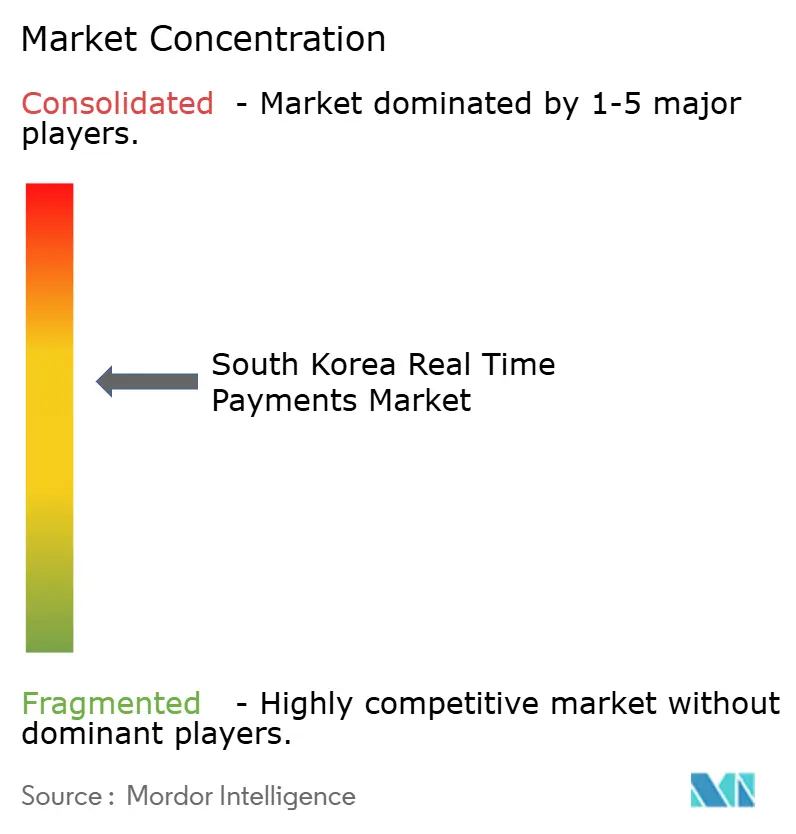
| Market Concentration | Medium |
Major Players *Disclaimer: Major Players sorted in no particular order Image © Mordor Intelligence. Reuse requires attribution under CC BY 4.0. | |
South Korea Real Time Payments Market Analysis by Mordor Intelligence
South Korea real time payments market size in 2026 is estimated at USD 2.35 billion, growing from 2025 value of USD 1.71 billion with 2031 projections showing USD 11.65 billion, growing at 37.68% CAGR over 2026-2031. Momentum is anchored in near-universal smartphone ownership, a mature 5G backbone, and a regulatory framework that prioritizes open banking. Cash usage is falling at double-digit rates, while real-time rails now underpin everything from peer-to-peer transfers to metaverse commerce. Banks and fintechs are racing to embed artificial-intelligence fraud engines and blockchain-based settlement modules, positioning themselves for cross-border growth as overseas transaction volumes accelerate. At the same time, the Bank of Korea’s ongoing central-bank digital-currency pilot is prompting market-wide upgrades to ISO 20022 messaging, creating a unified data model that improves compliance and risk analytics.
Key Report Takeaways
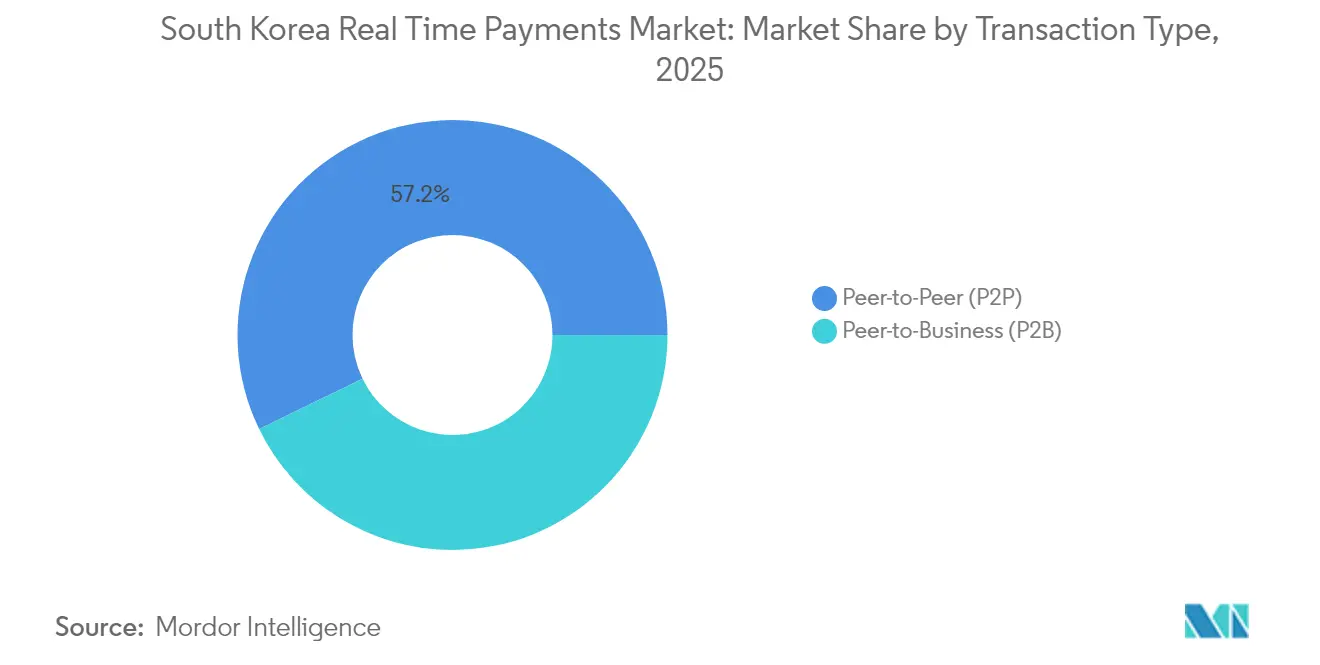
- By transaction type, Peer-to-Peer (P2P) transfers held 57.20% of South Korea real time payments market share in 2025, while Peer-to-Business (P2B) is forecast to post the fastest 2026-2031 CAGR at 32.14%.
- By component, platform/solution offerings captured 72.10% revenue share in 2025; the services segment is projected to expand at a 28.96% CAGR through 2031.
- By deployment mode, cloud implementations commanded 61.85% of the South Korea real time payments market size in 2025 and are advancing at a 30.08% CAGR to 2031.
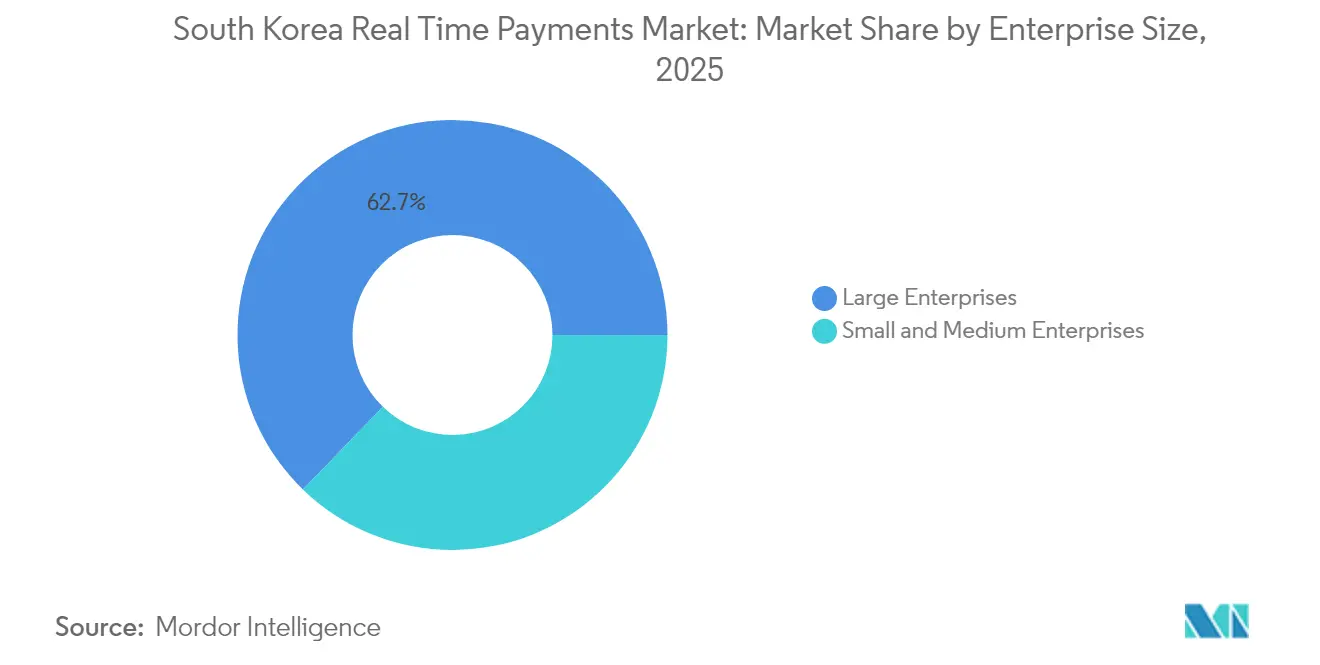
- By enterprise size, large enterprises led with 62.75% share in 2025, while the SME segment is projected to grow at 32.74% CAGR.
- By end-user industry, BFSI accounted for 40.80% of the market in 2025; the government & public-sector segment is advancing at a 38.21% CAGR through 2031.
Note: Market size and forecast figures in this report are generated using Mordor Intelligence’s proprietary estimation framework, updated with the latest available data and insights as of 2026.
South Korea Real Time Payments Market Trends and Insights
Drivers Impact Analysis*
| Driver | (~) % Impact on CAGR Forecast | Geographic Relevance | Impact Timeline |
|---|---|---|---|
| Digital transformation & >95% smartphone penetration | +10.2% | National, with stronger impact in urban centers | Short term (≤ 2 years) |
| Need for instant settlement & declining cash use | +8.5% | National | Medium term (2-4 years) |
| Government-backed open-banking & financial-hub ambition | +7.3% | National | Medium term (2-4 years) |
| Integration of RTP rails into metaverse super-apps | +5.1% | National, with early adoption in Seoul, Busan, Incheon | Long term (≥ 4 years) |
| CBDC sandbox creating RTP clearing-house upgrades | +4.8% | National | Long term (≥ 4 years) |
| Working-capital optimization in SME supply chains | +3.2% | National, with emphasis on industrial regions | Medium term (2-4 years) |
| Source: Mordor Intelligence | |||
Digital transformation & smartphone penetration
Smartphone penetration above 95% delivers a ubiquitous endpoint for mobile wallets, underpinning a 20% jump in overall digital-payment volume to about KRW 400 trillion (USD 0.29 billion) in 2024.[1]Ministry of Science and ICT, “Digital New Deal Harness the Winds of Change,” msit.go.kr The government’s Digital New Deal has earmarked KRW 10.1 trillion (USD 7.77 billion) to reinforce cloud, AI, and data infrastructure, accelerating fintech time-to-market.[2]Bank of Korea, “지급결제제도 감시와 혁신 노력,” bok.or.kr These investments have enabled payment providers to address nearly the entire consumer base, reinforcing the flywheel of adoption across ride-hailing, food-delivery, and gaming.
Need for instant settlement & declining cash use
Card fees and legacy batch-processing delays have nudged merchants toward account-to-account transfers. Real-time rails now settle most small-ticket urban retail spend within seconds, improving merchant liquidity and reducing chargeback exposure. Declining ATM withdrawals signal a structural shift as consumers prefer QR or near-field-communication (NFC) options integrated into super-apps.
Government-backed open banking & financial-hub ambition
The Financial Services Commission (FSC) opened bank APIs in stages, lowering switching costs for consumers and creating a new avenue for fintech revenue. Transaction fees for third-party access dropped sharply; offline availability scheduled for 2025 will extend benefits to small storefronts.[3]Financial Services Commission, “Press Releases,” fsc.go.kr The KRW500 billion Fintech Innovation Fund (2024-2027) is crowding-in private investment and drawing regional headquarters to Seoul’s Yeouido district.
Integration of RTP rails into metaverse super-apps
Virtual economies on Naver Zepeto and Kakao Universe require frictionless micro-payments. Digital-wallet ownership is set to reach 98% of the population by 2025.[4]Xsolla, “Unlocking the South Korea digital wallets market,” xsolla.com Gaming studios embed real-time settlement modules, allowing cross-platform asset trading and opening ancillary revenue for payment gateways via data monetisation.
Restraints Impact Analysis*
| Restraint | (~) % Impact on CAGR Forecast | Geographic Relevance | Impact Timeline |
|---|---|---|---|
| Rising fraud & account-takeover attacks | -3.8% | National, with higher impact in metropolitan areas | Short term (≤ 2 years) |
| Legacy batch clearing still critical for corporates | -2.1% | National, concentrated in industrial and financial centers | Medium term (2-4 years) |
| Intraday liquidity risk for smaller PSPs | -1.9% | National | Medium term (2-4 years) |
| Fee-cap uncertainty for QR-code micropayments | -1.5% | National, with emphasis on retail-dense areas | Short term (≤ 2 years) |
| Source: Mordor Intelligence | |||
Rising fraud & account-takeover attacks
Payment fraud across Asia-Pacific rose 15% in 2024; QR scams and SIM-swap tactics are prevalent in Korea. Real-time irrevocability heightens consumer risk perception. Regulators are auditing data-protection controls at Naver Pay and Toss. Providers respond with behavioural biometrics and consortium blacklists, yet attacker sophistication evolves quickly.
Legacy batch clearing still critical for corporates
Large enterprises still batch bulk payroll and supplier files overnight to align with enterprise-resource-planning (ERP) cycles. This behaviour reduces addressable volume for the South Korea real time payments market, although transition plans to ISO 20022 may smooth migration.
*Our forecasts treat driver/restraint impacts as directional, not additive. The impact forecasts reflect baseline growth, mix effects, and variable interactions.
Segment Analysis
By Transaction Type: P2P Dominance Masks B2B Upside
P2P transfers represented 57.20% of 2025 volume, reflecting the cultural ubiquity of KakaoTalk plug-ins. This segment anchors the South Korea real time payments market size, yet growth is plateauing amid saturation. P2B flows, however, are forecast to rise at 32.14% CAGR, underpinned by QR codes at point of sale and account-to-account online checkout.
P2B adoption signals deeper merchant digitalisation and yields richer data streams for loyalty targeting. Kakao Pay plans to triple affiliated stores to 3 million, leveraging Samsung Pay interoperability. Direct A2A transfers lower acceptance cost versus card rails, prompting e-commerce platforms to promote bank-button checkout.


By Component: Platforms as System Integrators
Platform/solution offerings captured 72.10% revenue in 2025, illustrating buyer preference for end-to-end stacks. The services slice will expand fastest at 28.96% CAGR as firms outsource fraud analytics, Know-Your-Customer checks, and compliance modules.
Hyundai Card shows the trajectory: its “Universe” AI-marketing engine classifies behavioural clusters and sells analytics overseas. Such capabilities transform platforms into orchestration layers for credit, lending, and insurance cross-sell, adding annuity revenue.
By Deployment Mode: Cloud Acceleration
Cloud deployments owned 61.85% share in 2025 and are growing at 30.08% CAGR. Elastic compute supports holiday traffic spikes without stranded capacity. Oracle’s globally distributed database illustrates sovereign-cloud compliance alongside sub-second latency.
Migration unlocks global reach: foreign-currency payments via Naver Pay, Kakao Pay, and Toss climbed from KRW117.73 billion (USD0.09 billion) in 2022 to KRW640.31 billion (USD0.49 billion) in 2024. Cloud APIs simplify onboarding of overseas acquirers and wallets.
By Enterprise Size: SMEs Close the Gap
Large enterprises controlled 62.75% of 2025 transactions, leveraging captive IT budgets to embed instant payments across omnichannel journeys. Yet SMEs will post 32.74% CAGR as digital-services vouchers, e-commerce toolkits, and cloud point-of-sale solutions lower adoption barriers.
CEO digital literacy and perceived advantage are decisive adoption factors. Payment providers bundle analytics dashboards that benchmark turnover, incentivising SMEs to shift from cash.
By End-User Industry: BFSI Leads, Public Sector Surges
BFSI captured 40.80% share in 2025 as banks deploy real-time rails to retain depositors and cross-sell. ISO 20022 integration enhances AML screening accuracy, lowering false positives.
The public-sector CAGR of 38.21% is the market’s fastest, fueled by digital disbursement programmes and procurement reform. Real-time rails cut settlement from days to seconds, improving liquidity for suppliers. Visa notes governments leverage data insights for policy setting.
Geography Analysis
South Korea’s homogeneous fibre and 5G coverage underpin uniform service availability; internet penetration exceeds 96%. Metropolitan Seoul, Busan, and Incheon command the highest transaction densities thanks to corporate headquarters and affluent consumers. Seoul is often the beta ground for new wallet features, accelerating network effects.
Regional uptake disparities reflect income rather than infrastructure. A 2023 study shows higher-income cohorts use digital finance more frequently, raising inclusion concerns even in a dense network environment. Government grants target rural small merchants with subsidised QR readers.
Cross-border expansion is reshaping growth vectors. Korean outbound wallet spend jumped 443% between 2022 and 2024. Toss extended QR acceptance to 42 countries via Alipay+, creating new fee corridors. Such moves diversify revenue as the domestic market matures and push South Korean standards into regional payment architectures.
Competitive Landscape
Competition is intense but moderately concentrated; the top five operators process roughly 60% of volume. Kakao Pay, Naver Financial, and Toss leverage captive social-media or portal ecosystems, translating daily active users into payment loops. Traditional banks respond with white-label APIs and equity stakes in fintechs to retain settlement flows.
Ecosystem strategy dominates. Naver Financial scales via patents, filing 430 automation-related applications in 2024. Technology differentiation underpins partnership talks with card issuers seeking AI reconciliation. New entrants carve niches: Alchemy Pay obtained local approval to bridge fiat and crypto rails, tapping segments underserved by incumbents.
South Korea Real Time Payments Industry Leaders
Toss (Viva Republica Inc.)
VISA Inc.
Mastercard Inc.
Kakao Pay Corp.
Naver Financial Corp. (Naver Pay)
- *Disclaimer: Major Players sorted in no particular order

Recent Industry Developments
- May 2025: Kakao Pay entered talks to acquire SSG Pay and Smile Pay for KRW 500 billion (USD 0.38 billion), aiming to expand its merchant base and exploit Shinsegae’s loyalty ecosystem.
- May 2025: South Korea finalised crypto rules allowing licensed exchanges to liquidate assets, paving the way for institutional participation and deeper integration of digital assets with real-time rails.
- April 2025: Alchemy Pay secured Korean regulatory clearance for compliant fiat-to-crypto gateways, strengthening local wallet connectivity.
- March 2025: The Bank of Korea launched the 100,000-user CBDC pilot “Project Han River,” testing tokenised deposit use in offline and online stores.


Research Methodology Framework and Report Scope
Market Definitions and Key Coverage
Our study treats the South Korean real-time payments (RTP) market as all domestic, retail-value electronic payments that clear and settle in seconds on 24 x 7 rails, whether pushed from bank apps, digital wallets, or API-enabled merchant checkouts. Values reflect provider revenue streams, software license, per-transaction fees, and value-added services, rather than the face value of funds moved.
Scope exclusion: large-value RTGS, card scheme clearing, and one-off wire transfers sit outside this estimate.
Segmentation Overview
- By Transaction Type
- Peer-to-Peer (P2P)
- Peer-to-Business (P2B)
- By Component
- Platform / Solution
- Services
- By Deployment Mode
- Cloud
- On-Premise
- By Enterprise Size
- Large Enterprises
- Small and Medium Enterprises
- By End-User Industry
- Retail and E-Commerce
- BFSI
- Utilities and Telecom
- Healthcare
- Government and Public Sector
- Other End-user Industries
Detailed Research Methodology and Data Validation
Primary Research
Interview rounds with Korean PSP executives, card-issuer product heads, mid-tier merchants, and banking regulators helped confirm fee structures, cloud migration costs, and upcoming feature roadmaps. Online consumer surveys across Seoul, Busan, and Daegu clarified usage frequency and tolerance for service fees, refining adoption curves modeled from desk work.
Desk Research
Mordor analysts gathered base data from open repositories such as the Bank of Korea's Payment Statistics, KFTC's monthly HOFINET bulletins, Ministry of Science & ICT telecom user files, and OECD broadband indicators. Policy insight came from Financial Services Commission releases and IMF working papers, while adoption metrics were tracked through ACI Worldwide's "Prime Time for Real-Time" dashboards and press filings from major PSPs. Paid intelligence from Dow Jones Factiva and D&B Hoovers supplied company revenues and product timelines. Macroeconomic anchors, GDP, CPI, smartphone penetration, were sourced from World Bank and ITU datasets, then cross-checked in Factiva archives. The sources listed illustrate our approach; many additional public and proprietary references supported data validation.
Market-Sizing & Forecasting
Top-down reconstruction began with KFTC transaction volumes and average provider fee bands to arrive at the value, which was then stress-tested through selective supplier roll-ups of SaaS ARPU and channel checks at gateway vendors. Key drivers feeding the model include: smartphone penetration trajectory, e-commerce GMV growth, share of account-to-account payments within retail spend, average RTP fee per transaction, and regulatory caps on interchange. A multivariate regression blends these inputs; scenario analysis adjusts for policy shocks such as fee waivers or new cross-border links. Bottom-up gaps, especially on SME uptake, were bridged with primary-research elasticity ratios.
Data Validation & Update Cycle
Outputs pass three-layer review: automated variance flags, senior-analyst reasonableness tests, and final sign-off. The model refreshes annually, with interim patches when material events, rail outages, fee policy shifts, and major M&A occur.
Why Mordor's South Korea Real Time Payments Baseline Commands Reliability
Published numbers often diverge because firms toggle between transaction-value and provider-revenue lenses, reference different rail scopes, or uplift 2023 data without re-benchmarking after fee reforms.
Key gap drivers include: some studies roll card-based NFC volumes into RTP, others extrapolate solely from smartphone counts, and several freeze currency at historical KRW-USD rates, whereas Mordor adjusts quarterly and models only instant-clearing rails.
Benchmark comparison
| Market Size | Anonymized source | Primary gap driver |
|---|---|---|
| USD 1.71 B (2025) | Mordor Intelligence | - |
| USD 1.48 B (2023) | Regional Consultancy A | Excludes wallet platform service revenues and applies 2021 exchange rate |
| USD 1.70 B (2024) | Global Consultancy B | Mixes retail RTP with corporate bulk payments; limited primary validation |
| USD 1.13 B (2022) | Trade Journal C | Uses provider filings only and omits cloud-service fee streams |
These contrasts show that, by aligning scope with true instant-payment rails, refreshing inputs yearly, and blending macro signals with on-ground interviews, Mordor delivers a balanced, transparent baseline clients can replicate and trust.


Key Questions Answered in the Report
What is the current size of the South Korea real time payments market?
The market stands at USD2.35 billion in 2026 and is forecast to reach USD11.65 billion by 2031.
Which transaction type is growing fastest?
Peer-to-Business transfers are projected to expand at 32.14% CAGR between 2026-2031, outpacing other categories.
How important is cloud deployment for payment providers?
Cloud solutions already represent 61.85% of deployments and are forecast to grow at 30.08% CAGR, offering scalability and rapid innovation.
Why is the public sector a high-growth segment?
Government agencies adopt instant payments to improve procurement and benefit disbursements, driving a 38.21% CAGR through 2031.
What security risks accompany real-time payments?
Fraud schemes such as QR scams and SIM swaps are rising, prompting providers to invest in AI-driven detection and regulators to tighten oversight.
How will the Bank of Korea’s CBDC pilot affect the market?
It compels banks to upgrade infrastructure to ISO 20022 and tests tokenised deposits, setting the stage for broader real-time settlement innovation.
Page last updated on:


