
South Korea Data Center Storage Market Size and Share
Market Overview
| Study Period | 2020 - 2031 |
|---|---|
| Forecast Data Period | 2026 - 2031 |
| Base Year Market Size (2025) | USD 1.23 Billion |
| Market Size (2026) | USD 1.37 Billion |
| Market Size (2031) | USD 2.35 Billion |
| Growth Rate (2026 - 2031) | 11.43 % |
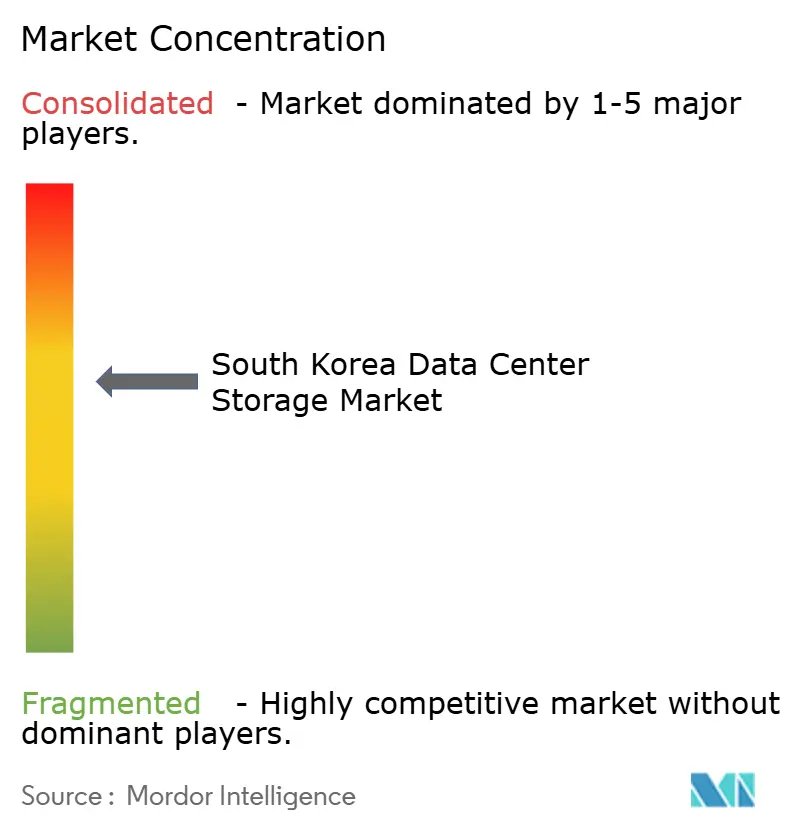
| Market Concentration | Medium |
Major Players *Disclaimer: Major Players sorted in no particular order Image © Mordor Intelligence. Reuse requires attribution under CC BY 4.0. | |
South Korea Data Center Storage Market Analysis by Mordor Intelligence
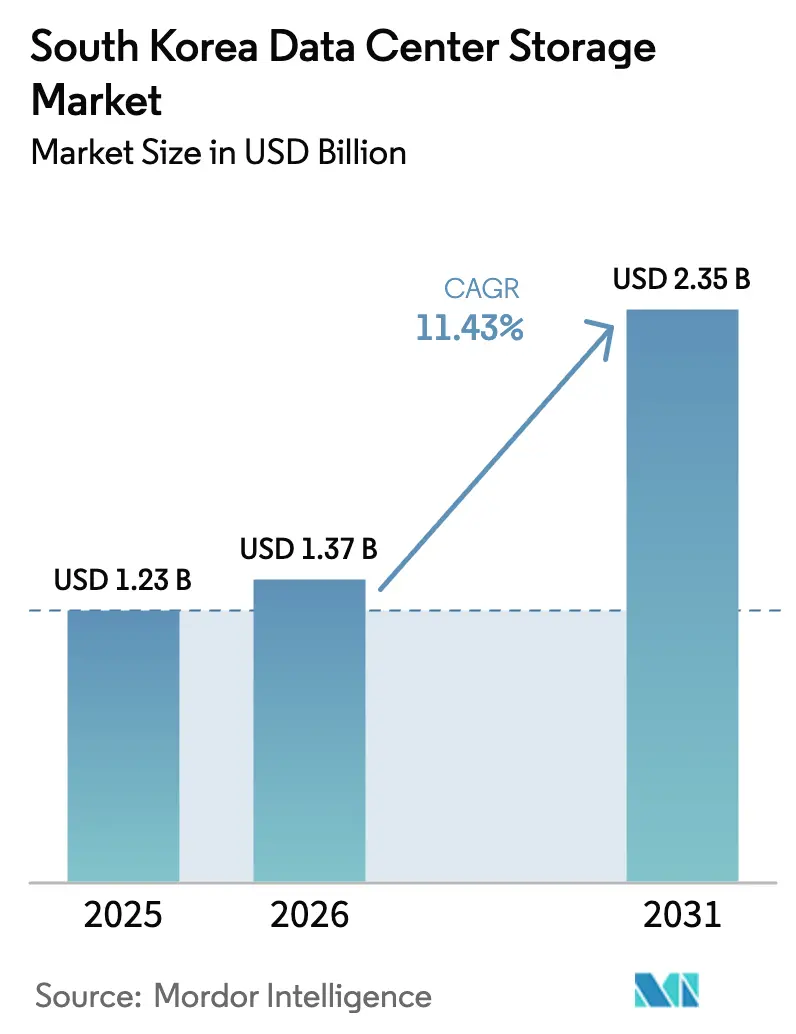
The South Korea data center storage market size was valued at USD 1.23 billion in 2025 and estimated to grow from USD 1.37 billion in 2026 to reach USD 2.35 billion by 2031, at a CAGR of 11.43% during the forecast period (2026-2031). Escalating AI and hyperscale workloads, a far-reaching semiconductor investment program, and the government’s Cloud-First Policy are together redefining storage architecture choices for enterprises and cloud providers bloomberg.com. Strength in domestic NAND manufacturing lets Korean vendors roll out higher-density flash earlier than foreign peers, compressing cost per terabyte and nudging buyers toward all-flash and NVMe configurations. At the same time, power-grid bottlenecks around Seoul and stricter Personal Information Protection Act (PIPA) rules add both urgency and complexity to data-center site selection. Supply-chain volatility—enterprise SSD quotes rose 20–25% in 2024—compels CIOs to balance performance gains with CAPEX discipline even as AI model sizes balloo
Key Report Takeaways
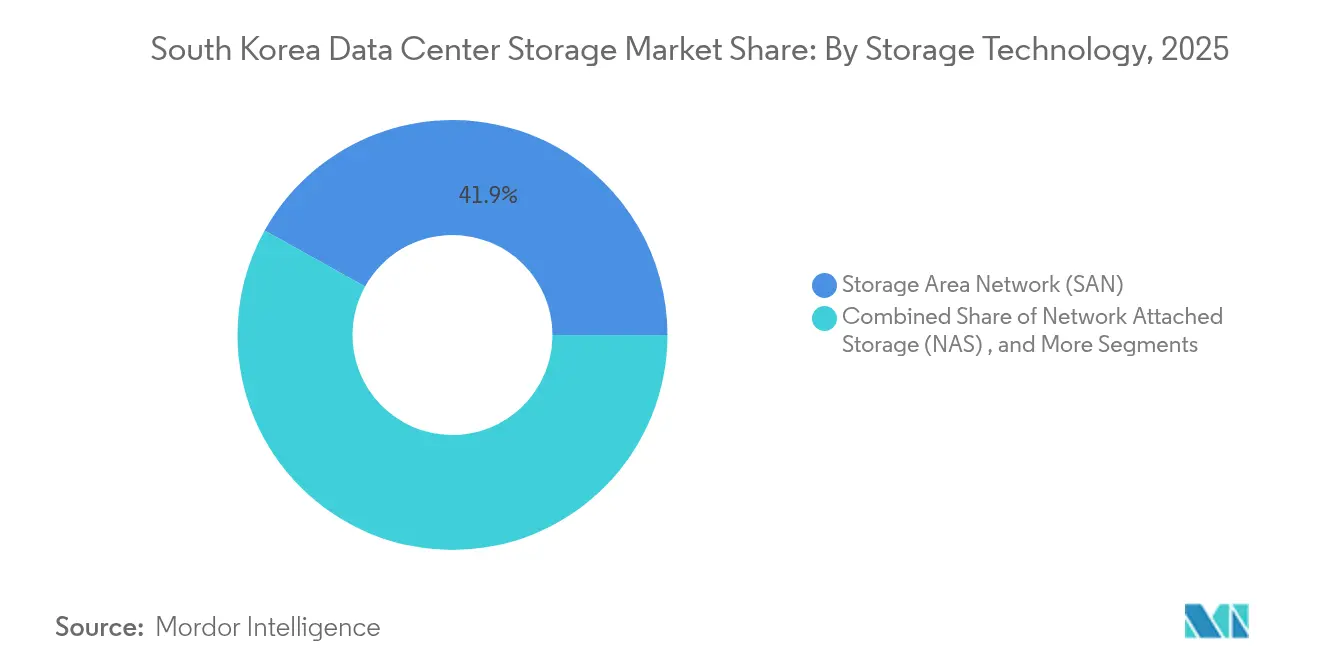
- By storage technology, Storage Area Network held 41.92% of South Korea data center storage market share in 2025, while object and tape storage is projected to expand at 12.88% CAGR to 2031
- By storage type, legacy HDD arrays accounted for 46.32% share of the South Korea data center storage market size in 2025; all-flash arrays are advancing at a 13.85% CAGR through 2031.
- By data-center type, colocation facilities led with 54.12% revenue share in 2025; hyperscaler and cloud-service deployments record the fastest 16.74% CAGR to 2031.
- By end user, IT & telecommunications captured 36.78% of South Korea data center storage market share in 2025, while healthcare & life sciences show a 14.12% CAGR through 2031.
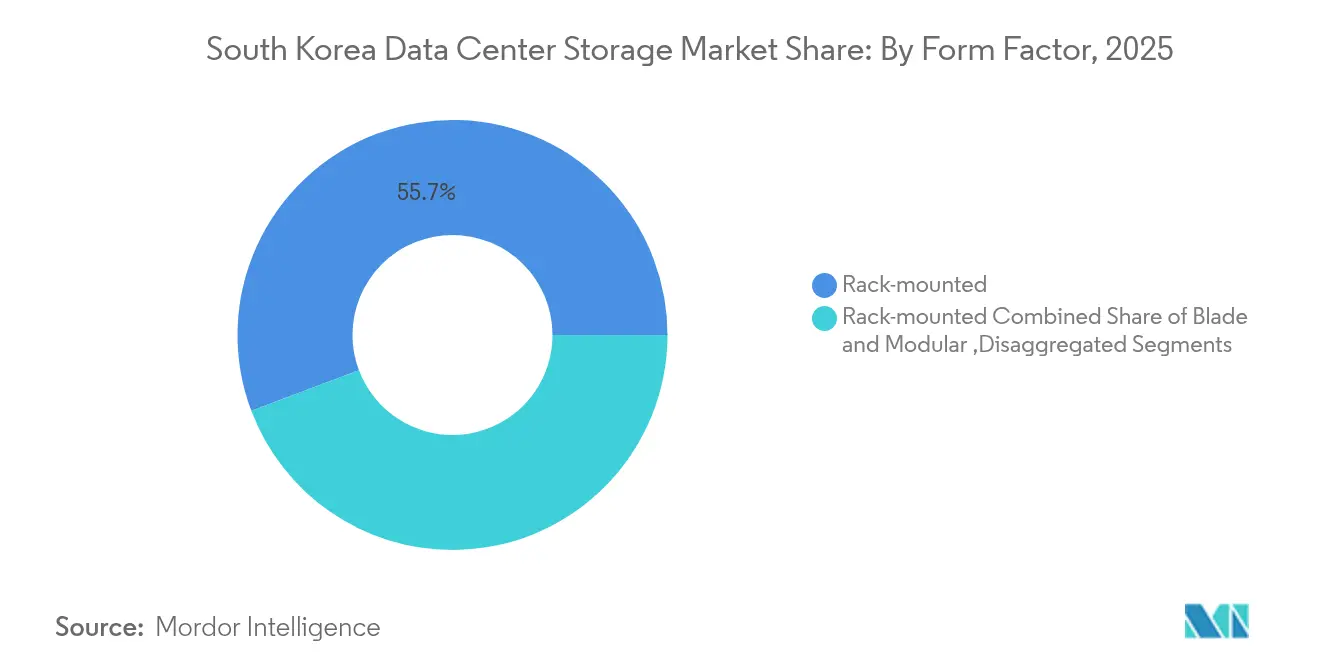
- By form factor, rack-mounted systems dominated with 55.74% share in 2025; disaggregated and composable storage is forecast to climb 15.52% CAGR to 2031.
Note: Market size and forecast figures in this report are generated using Mordor Intelligence’s proprietary estimation framework, updated with the latest available data and insights as of 2026.
South Korea Data Center Storage Market Trends and Insights
Drivers Impact Analysis*
| Driver | (~)% Impact on CAGR Forecast | Geographic Relevance | Impact Timeline |
|---|---|---|---|
| Expansion of IT infrastructure | 2.8% | National, concentrated in Seoul-Incheon corridor | Medium term (2-4 years) |
| Increased hyperscale data-center investment | 3.2% | Global, with focus on Jeollanam-do and Gyeonggi provinces | Long term (≥ 4 years) |
| Rapid shift to all-flash arrays | 2.1% | National, led by financial and telecommunications sectors | Short term (≤ 2 years) |
| AI/ML and big-data workload boom | 2.9% | National, with spillover to regional data centers | Medium term (2-4 years) |
| Nuclear-renewable power mix securing capacity | 1.4% | National grid modernization | Long term (≥ 4 years) |
| Rise of edge micro-data centers in smart-city roll-outs | 1.1% | Urban centers, starting with Songdo and expanding | Medium term (2-4 years) |
| Source: Mordor Intelligence | |||
Expansion of IT Infrastructure
Government allocation of KRW 938.6 billion (USD 678 million) for its Digital Platform Government program is migrating 10,000 public systems to cloud-native stacks, fuelling multi-petabyte storage tenders across ministries.[1] Ninety-five percent of leading manufacturers now plan AI spending inside five years, which anchors sustained rack-mounted demand as factories modernize OT and IT stacks. Rack units still attract 56.2% share because they offer predictable deployment and easy serviceability within brownfield data halls. This expansion also underpins stronger pull-through for software-defined storage, as agencies insist on open-standard orchestration tools that future-proof multi-cloud strategies.
Increased Hyperscale Data-Center Investment
The USD 35 billion Stock Farm Road project in Jeollanam-do, sized for 3 GW, exemplifies Korea’s bid to anchor Asia’s largest AI compute cluster and will single-handedly absorb exabyte-scale object storage on day one. Domestically, Naver’s 294,000 m² GAK Sejong campus and SK Telecom’s gigawatt builds tighten the pipeline for tape and deep-archive tiers, explaining the 13.2% CAGR now forecast for object/tape. Hyperscalers dictate disaggregated storage blueprints so GPU farms can move from training to inferencing without forklift upgrades, accelerating vendor roadmaps for composable NVMe-over-Fabrics gear.
Rapid Shift to All-Flash Arrays
After Samsung lifted enterprise SSD quotes by 20–25% in 2024, CIOs calculated that performance penalties from hybrid stacks outweighed the new‐build premium, tipping adoption toward all-flash despite inflationary silicon costs.[2] KakaoBank’s ICN10 deployment shaved fraud-analytics latency to sub-1 ms by standardizing on flash, a case that now circulates widely among Korean BFSI peers cdotrends.com. Samsung’s 400-layer V-NAND delivers step-function density jumps that keep TCO in check even for latency-critical inference clusters. Together these factors drive the 14.4% flash CAGR outlook despite CAPEX headwinds.
AI/ML and Big-Data Workload Boom
Seoul National University Hospital’s Korean medical LLM ingested 38 million clinical notes, pushing storage vendors to guarantee line-rate throughput for both structured and unstructured data pipelines.[3]Naver benchmarked JuiceFS against Alluxio and selected the former for POSIX compliance to streamline 1,000-node GPU training clusters, illustrating how software layers steer hardware choices. NVMe interface shipments now climb 14.6% CAGR as AI practitioners saturate PCIe 5.0 lanes in pursuit of higher model-update cadence storage-newsletter.com. Pure Storage and SK Hynix show that QLC flash can curb energy draw by 40% while sustaining AI inference bandwidth, a data-center CFO talking point that shortens payback windows.
Restraints Impact Analysis*
| Restraint | (~) % Impact on CAGR Forecast | Geographic Relevance | Impact Timeline |
|---|---|---|---|
| High upfront CAPEX for enterprise arrays | -1.8% | National, particularly affecting SME adoption | Short term (≤ 2 years) |
| Grid-level power-supply constraints | -2.1% | Seoul metropolitan area and industrial zones | Medium term (2-4 years) |
| Tightening Korean data-sovereignty laws | -1.2% | National, with cross-border data flow restrictions | Long term (≥ 4 years) |
| Volatile NAND/DRAM price cycles | -1.6% | Global supply chain impacts on local procurement | Short term (≤ 2 years) |
| Source: Mordor Intelligence | |||
High Upfront CAPEX for Enterprise Arrays
Memory-price rallies lifted DDR4 by 50% in 2025 and compounded SSD mark-ups, stretching payback periods for SMB smart-factory pilots despite government grants. LS Group illustrates the squeeze: IoT rollout budgets ballooned to KRW 1.13 billion (USD 817,000) per site, sidelining undercapitalized suppliers even as top-tier firms accelerate flash rollouts. Without mezzanine leasing or OPEX alternatives, adoption gaps could persist, shaving 1.8 percentage points off CAGR in 2026–2027.
Grid-Level Power-Supply Constraints
Electricity demand from data centers will double by 2030, yet KEPCO’s 2023 debt of KRW 202.5 trillion (USD 146 billion) leaves limited headroom for substation upgrade. Sites around Seoul already face moratoriums on new 30+ MW halls, forcing operators to scout costlier regions or co-build captive renewables. Samsung’s hydrogen pilot with Korea Southeast Power is promising but capital-intensive, so near-term capacity additions risk delay, clipping a further 2.1 percentage points from headline growth.
*Our forecasts treat driver/restraint impacts as directional, not additive. The impact forecasts reflect baseline growth, mix effects, and variable interactions.
Segment Analysis
By Storage Technology: SAN Dominance Faces Object-Storage Disruption
SAN retained a 41.92% slice of South Korea data center storage market in 2025 because mission-critical financial and telecom workloads still favor deterministic latency delivered by Fibre Channel fabrics. The arrival of 400-layer V-NAND lets array makers ship petabyte shelves that slot into existing rack plans without undue power hits, a feature that keeps SAN in the conversation for stateful containers and virtual-machine farms. In contrast, hyperscalers bulk-order erasure-coded object repositories to feed transformer models, driving a 12.88% CAGR for that class through 2031. Because model checkpoints and training corpora live longest, operators gravitate to low-cost cold tiers—often HDD or tape fronted by SSD caches—to stretch TCO windows.
Object storage also gains ground inside regulated enterprises that now run analytics on click-stream and IoT exhaust deferred from performance tiers. Naver’s GAK Sejong campus exemplifies the blend: flash-backed SAN for high-traffic search indices, object buckets for AI training and CDN origin. Samsung SDS seeds the same architecture inside its public cloud, promising near-line datasets at half per-terabyte cost relative to SAN. Given that supply chains sit mere kilometers from assembly plants in Gyeonggi, local integrators can prototype custom controllers faster than offshore rivals. Over the forecast horizon, hybrid deployments—SAN front-ends fused with object back-ends—will underpin data-lifecycle policies that temper cost spikes while keeping inference pipelines warm.

By Storage Type: All-Flash Arrays Accelerate Despite Cost Pressures
Legacy HDD arrays still held 46.32% of South Korea data center storage market size in 2025 as cold-data lakes and compliance archives cling to spinning media economics. Yet, AI adoption patterns show that every GPU added compounds the need for sustained IOPS; hence, all-flash shipments chart a 13.85% CAGR to 2031. Samsung’s own elastic cloud service cut model-training epoch times 35% after swapping hybrid trays for QLC-based Pure Storage DirectFlash modules, validating energy TCO math even with premium SSD pricing.
Flash momentum benefits from government carbon pledges: new data halls must show ≥40 % energy-use reduction versus 2022 baselines, and flash’s watt-per-TB edge helps meet those audits. The cost gap narrows as 4-bit QLC cells and 3D stacking climb past 400 layers, slashing dollars per gigabyte in domestic fabs. Hybrid arrays remain popular stopgaps, blending SATA HDD and NVMe cache where workloads show seasonal I/O spikes. Over time, intra-array tiering engines will quietly retire HDD trays, inching the ratio toward flash-heavy footprints by decade’s end.
By Data Center Type: Hyperscalers Drive Infrastructure Transformation
Colocation plants contributed 54.12% of invoiced revenue in 2025 because domestic enterprises still treat capex-light tenancy as default, and tax schemes reward wholesale leasing. Nevertheless, hyperscalers chart the steeper 16.74% CAGR; Alphabet, Microsoft, and Amazon rush to carve sovereign enclaves that meet Korean PIPA constraints while keeping network round-trip under 30 ms to Tokyo. South Korea data center storage market size tied to hyperscalers could surpass USD 1.19 billion by 2031 if the 3-GW Jeollanam-do build stays on schedule.
Operators at that scale jettison monolithic frames in favor of open-rack and composable disaggregated storage pooled across liquid-cooled GPU aisles. Samsung SDS, LG CNS, and Megazone Cloud leverage local supply contracts to meet customization asks—NVMe-oF fabrics, air-sealed HDD pods, or tape silos with barium-ferrite media. Edge micro-sites pop up along 5G hubs where latency budgets dip below 5 ms for autonomous-vehicle telemetry; these deployments still favor direct-attached flash enclosures given cost and space constraints.
By End User: Healthcare Emerges as AI-Driven Growth Leader
IT-telecom customers continued to capture 36.78% of South Korea data center storage market share in 2025, anchoring bandwidth-hungry OTT video and 5G core workloads. Yet hospitals and genomics labs post the headline 14.12% CAGR, turbocharged by multi-modal imaging and large-language-model diagnostics. Seoul National University Hospital alone added 12 PB of flash-tier capacity in 2025 to house anonymized radiology scans for federated-learning pilots.
Regulators clear cloud pathways for de-identified health data, nudging providers toward hybrid environments where sensitive patient identifiers remain on-prem while model artifacts live in compliant public regions. BFSI firms follow suit, mirroring zero-trust micro-segmentation that fences PII on flash-tier SAN while moving Monte Carlo risk archives to object cold tiers offshore. Collectively, vertical diversification insulates vendors from telecom investment cycles, ensuring broadened revenue streams.
By Form Factor: Disaggregated Architecture Gains Momentum
Rack-mount SKUs retained 55.74% bookings in 2025—brownfield retrofits still favor bolt-in rails—but disaggregated sleds jump 15.52% CAGR on hyperscale pull. Compute Express Link (CXL) and NVMe-oF let operators pool flash as a fungible fabric resource, translating to 30–40 % better drive utilization during model spin-ups. Samsung demoed CXL 2.0 composability at MemCon 2024, wiring 32 compute nodes to a shared 2 PB flash shelf over 256-lane PCIe 5.0, a topology now entering volume trials.
Blade systems continue niche duty in government chassis where supplier lists lock spec; however, liquid-cool blocks and rear-door heat exchangers make high-density sleds safe even at 60 kW/rack, a must for AI racks at ICN10. Over the forecast horizon, software-defined orchestration stacks will abstract away physical form factors, but composability’s capex-lite scaling propels its share in new halls.
By Interface: NVMe Adoption Accelerates for AI Workloads
SAS/SATA retained 47.05% interface mix in 2025 thanks to proven error-handling and hot-swap comfort among ops teams. But every PCIe generation doubles lane bandwidth, and NVMe-only designs jump 14.28% CAGR through 2031. Samsung’s 9100 PRO PCIe 5.0 NVMe 2.0 SSD hits 14 GB/s sequential reads, turning it into de-facto standard for GPU local scratch during transformer training.
Fibre Channel shores up mainframe and trade-matching clusters needing deterministic lossless links, but its incremental roadmap stalls compared with PCIe. iSCSI lingers for departmental NAS oversubscribed on 25 GbE topologies. Looking ahead, NVMe-TCP and NVMe-RoCE overlays will blur block vs. file semantics, giving developers a uniform API across tiers and sites.
Geography Analysis
South Korea data center storage market skews heavily to the Seoul–Incheon corridor where financial exchanges, telco cores, and IX hubs cluster. Colocation landlords there report 92 % occupancy, leaving land and megawatt premiums that nudge greenfield builds to Sejong or Pyeongtaek. Naver’s GAK Sejong campus spans 294,000 m² and anchors 65 EB of capacity, signalling how secondary cities scale once grid hooks and dark-fiber routes firm up.
Jeollanam-do’s USD 35 billion, 3-GW AI campus will tilt gravity southwards by 2028 and could alone lift local South Korea data center storage market size by USD 420 million under steady-state replacement cycles. Regional planners sweeten land grants and nuclear baseload guarantees to offset metro latency penalties, while KEPCO works 765-kV backbones into coastal zones. Along the Yellow Sea, Songdo’s smart-city grid embeds Rittal micro-data centers at intersections, each hosting 120 TB for traffic lidar and CCTV retention.
Cross-border data-flow friction influences siting: new PIPA amendments demand that residency exceptions undergo quarterly privacy audits, so overseas SaaS firms lean on local sovereign AZs with transparent key-management. Subsea cable backhauls to Los Angeles and Singapore remain robust, yet enterprise architects now adopt multi-region active-active patterns that keep user PII pinned to Korea even as stateless micro-services roam, a nuance that benefits domestic cloud operators.
Regulatory Landscape
South Korea data center storage deployments are shaped by privacy and cloud-adoption directives, alongside rules that are increasingly specific to AI workloads. The Personal Information Protection Act (PIPA) and related data-sovereignty requirements push enterprises and global cloud providers to design for local data residency, stronger key management, and auditable access controls. That, in turn, affects how storage tiers (flash, object, and archive) get placed across domestic regions and sovereign availability zones.
A key 2026 policy anchor is the Special Act on the Promotion of the Artificial Intelligence Data Center Industry (AIDC Special Act), passed by the National Assembly on May 7, 2026, with an effective date in February 2027 after a grace period. The Act introduces a one-stop permitting approach that bundles power-grid impact reviews, energy-use consultations, and building permits. It also includes measures such as exemptions from certain grid impact assessments for AIDC projects outside the Seoul metropolitan area, which feeds directly into siting decisions and the storage footprint of new AI-focused facilities.
Value Chain Analysis
The South Korea data center storage value chain runs from upstream memory and component supply (NAND, DRAM, controllers) through system design and manufacturing (SSD and drive modules, storage arrays, and composable NVMe fabrics). Downstream, OEMs, system integrators, and cloud operators integrate these systems into colocation, hyperscale, and enterprise environments. Domestic semiconductor strength, led by Samsung and SK hynix, supports faster iteration on higher-density flash and improves local access to enterprise-grade media, while global OEMs such as Dell Technologies, HPE, NetApp, Huawei, and Hitachi Vantara compete through platforms, software, and channel-led deployment models.
On the downstream side, government-led cloud migration and AI infrastructure programs influence procurement patterns and partner ecosystems. The K-Cloud Project (2023-2030) and related initiatives emphasize localization of AI data center hardware and cloud software, with participation from large groups (for example, SK Group, GS Group, and Naver) and NPU validation efforts involving startups such as FuriosaAI and Rebellions Inc. A policy goal to raise the localization rate of AI data center equipment and solutions to 20% by 2030 increases the role of local suppliers and integrators in storage qualification, interoperability testing, and lifecycle services.
Competitive Landscape
Market rivalry intensifies as global OEMs square off against vertically integrated Korean memory giants. Samsung and SK Hynix not only fab NAND and DRAM but increasingly bundle controllers and firmware, letting them tweak QoS profiles for AI inference far faster than Dell Technologies or HPE can iterate. The top five vendors jointly accounted for roughly 62 % of 2024 revenue, a position that still leaves room for disruptors in composable fabrics and edge arrays.
Domestic integrators enjoy favorite-supplier status on government cloud migration lots: Samsung SDS grew cloud segment revenue 35.3 % YoY in Q3 2024 on the back of Digital Platform Government deals. Megazone Cloud eyes a USD 7 billion IPO to bankroll more sovereign AZs, putting pressure on global CSPs to localize services and bid with local SI partners. Meanwhile, Pure Storage opened a Seoul R&D pod and licensed SK Hynix QLC dies, tightening symbiotic ties between foreign system IP and Korean silicon roadmaps.
White-space plays center on AI-specific storage appliances that ingest PB-scale datasets into GPU superpods without network oversubscription. Penguin Solutions used SK Telecom’s USD 200 million equity to co-design such appliances around 800 GbE fabrics, carving a niche against mainstream OEMs. Software-defined entrants like VAST Data and Weka line up channel pacts with LG CNS to complement hardware incumbents, ensuring a fragmented yet innovation-heavy field.
South Korea Data Center Storage Industry Leaders
-
Dell Inc.
-
Hewlett Packard Enterprise
-
NetApp Inc.
-
Huawei Technologies Co. Ltd.
-
Hitachi Vantara LLC
- *Disclaimer: Major Players sorted in no particular order
Market Opportunities and Future Outlook
AI data center construction and regional diversification create whitespace for storage architectures built around GPU-heavy training and inference. That includes object storage for training corpora and checkpoints, NVMe-based performance tiers, and policy-driven sovereign deployments. A concrete market signal is the national AI data center buildout plan targeting 18.4 GW by 2035, with Phase 1 at 8.4 GW by 2029 and large announced investment envelopes (including 550 trillion KRW cited in public reporting). The plan also outlines a Phase 2 expansion of 10 GW between 2030 and 2035 and names regional hubs such as Ulsan, Donghae, and Sejong to ease Seoul-area grid congestion.
The AIDC Special Act passed in May 2026 adds an additional execution tailwind for faster project delivery and new site pipelines outside the Seoul metropolitan area, supported by streamlined, one-stop permitting and selective grid-assessment relief. For storage vendors and integrators, this shifts opportunity toward multi-tier deployments that can be replicated across new regional campuses, including composable NVMe-over-Fabrics designs, software-defined storage stacks, and long-retention archives for regulated verticals that need PIPA-aligned controls while scaling AI datasets.
Recent Industry Developments
- June 2026: ST Telemedia Global Data Centres (STT GDC) opened STT Seoul 1 data center in Gasan-dong, Seoul (30MW IT load) developed in JV with Hyosung Heavy Industries. The opening expands SK data center capacity for cloud and AI workloads. It signals rising regional cloud and AI infrastructure capacity and SKT GDC's local scale ambitions.
- January 2026: FADU (Taiwan-based) secured a 47 billion won (USD 35 million) order for finished SSD products from Macnica Galaxy. The contract supplies material storage components for AI data-center stacks. It demonstrates demand tailwinds for Korean-sourced SSDs and local supply-chain integration with hyperscalers.
- July 2025: Hammerspace formally launched operations in South Korea to deploy its Global Data Platform for AI and HPC infrastructure. The entry of an international data platform vendor into SK market expands competitive options for AI and HPC storage in SK. It enhances local competitive dynamics.
Research Methodology Framework and Report Scope
Market Definition and Coverage
This market covers spending in South Korea on storage systems and related storage media used inside data centers to store, protect, and serve digital workloads, including deployments by enterprise, colocation, and cloud environments.
Scope exclusions: We exclude end-user device storage and on-premise office storage that is not installed in a data center environment.
Segmentation Overview
- By Storage Technology
- Network Attached Storage (NAS)
- Storage Area Network (SAN)
- Direct Attached Storage (DAS)
- Object and Tape Storage
- By Storage Type
- Traditional HDD Arrays
- All-Flash Arrays (AFA)
- Hybrid Storage
- By Data Center Type
- Colocation Facilities
- Hyperscalers/Cloud Service Providers
- Enterprise and Edge
- By End User
- IT and Telecommunication
- BFSI
- Government and Public Sector
- Media and Entertainment
- Healthcare and Life Sciences
- Manufacturing
- By Form Factor
- Rack-mounted
- Blade and Modular
- Disaggregated / Composable
- By Interface
- SAS / SATA
- NVMe
- Fibre Channel and iSCSI
Data Sources, Market Sizing, and Validation
Desk Research
Desk research started by building a fact base on South Korea data growth drivers, data center build activity, and storage demand signals. Public sources used for directional checks included Statistics Korea (KOSIS), Ministry of Science and ICT publications, Bank of Korea macro series, Korea Customs Service trade statistics, and OECD ICT indicators.
We also reviewed supplier filings, investor presentations, and reputable press coverage to track product mix shifts like HDD versus SSD, and transitions to NVMe in higher performance racks. To tighten assumptions, we referenced paid subscriptions for company financials and intelligence, news and financials, and patent databases, which helped confirm investment cycles and the timing of technology change. These desk sources are illustrative only, and many other sources were also used for data collection, validation, and clarification.
Primary Interviews and Surveys
Primary work focused on validating what is actually being bought and deployed in South Korean facilities, and how budgets are split across flash, hybrid, and HDD-heavy tiers. We spoke with a mix of operators, integrators, channel partners, and large end users across major demand centers, and then used their feedback to refine pricing assumptions, refresh cycles, and utilization assumptions that were not clear in public datasets.
Distribution of primary research fieldwork respondents
| Company type | Respondent position |
|---|---|
| Top tier: 28% | CXOs: 13% |
| Mid tier: 53% | Functional/Unit leaders: 28% |
| Smaller Players: 19% | Managers: 59% |
Market-Sizing & Forecasting
Sizing was built using a top-down and bottom-up approach. The top-down view reconstructed the demand pool from South Korea data center expansion, IT load additions, and storage intensity per deployed workload. We then supported this with bottom-up approximations, including sampled price per TB by storage class and channel checks on shipment mix, to adjust totals when a single data source looked overstated.
Key model inputs included data center capacity additions and occupancy ramp patterns, the split of flash versus HDD by tier, typical refresh cycles for enterprise and cloud environments, and price movement by interface and form factor (for example, NVMe versus SAS, and high capacity HDD trends). For forecasting, we used scenario analysis linked to AI and cloud build plans, then checked the direction of each scenario with expert views on procurement lead times, budget shifts, and expected price normalization. Where smaller deployments were harder to observe in public figures, we used conservative penetration assumptions and re-checked through interviews until the implied spend matched procurement behavior.
Data Validation & Update Cycle
Model outputs were validated through consistency checks against independent signals like data center build momentum, import patterns for storage-related hardware classes, and observed shifts in flash adoption. Large variances triggered a second pass on assumptions, followed by peer review, and selective re-contact with interviewees when explanations were not clear.
Reports are refreshed annually, and interim updates are made when material events change demand or pricing, such as major capacity announcements, policy moves, or sharp currency swings. Before delivery, an analyst performs a final update sweep so clients receive the latest aligned set of inputs and outputs.
Mordor Intelligence's South Korea Data Center Storage Market Sizing Compared With Other Published Estimates
Published market sizes can vary even when the topic sounds identical, because teams often draw the boundary of what counts as data center storage differently. Differences also come from how pricing is treated, which year is used as the base, and whether the estimate ties back to observable deployment and refresh behavior.
By tracking refresh cycles, interface mix shifts, and realized price per TB checks, Mordor Intelligence keeps the model anchored to data center-installed storage spending in South Korea, instead of blending in adjacent enterprise storage that may sit outside true data center environments.
Benchmark comparison
| Source | Market Size | Gaps in Research Methodology |
|---|---|---|
| Mordor Intelligence | USD 1.23 B (2025) | |
| Industry Association A | USD 1.09 B (2024) | Uses an earlier base year and tends to understate newer all-flash and NVMe spend, especially where projects are approved late in the year and show up after the cut-off. |
| Regional Consultancy B | USD 1.35 B (2025) | Broadens the scope by counting a wider set of enterprise storage purchases that are not consistently deployed in data center facilities, and applies a smoother ASP curve without channel-level price checks. |
The spread in the table is mainly explained by boundary choices and how quickly pricing and product mix are updated in the model. When scope is kept tight to storage installed in data centers, and pricing is updated using repeatable checks, the resulting market size stays easier to trace back to demand and procurement drivers.
Key Questions Answered in the Report
What is the South Korea data center storage market size in 2026?
The market is valued at USD 1.37 billion in 2026.
What compound annual growth rate (CAGR) is forecast for 2026-2031?
The market is projected to expand at an 11.43% CAGR through 2031.
Who are the key players in South Korea Data Center Storage Market?
Dell Inc., Hewlett Packard Enterprise, NetApp Inc., Huawei Technologies Co. Ltd. and Hitachi Vantara LLC are the major companies operating in the South Korea Data Center Storage Market.
Which storage type is growing the fastest?
All-flash arrays lead with a 13.85% CAGR as enterprises prioritize low-latency AI workloads through 2031.
Why are hyperscale operators investing heavily in South Korea?
Sovereign-AI requirements, a USD 35 billion 3 GW campus in Jeollanam-do, and government Cloud-First incentives make the country a strategic hub for Asia-Pacific deployments.
Which end-user vertical shows the highest growth momentum?
Healthcare and life sciences, driven by AI imaging and medical large-language-model projects, posts a 14.12% CAGR through 2031.
What key restraints could slow market expansion?
High upfront CAPEX for flash arrays and grid-level power constraints around Seoul reduce near-term deployment velocity.
- Data Center Power Market Power systems across the global market, covering component, tier and facility size.
- Data Center Server Market Servers across all regions, split by tier, facility size and facility type.
- Artificial Intelligence (AI) Data Center Market Global AI facilities demand, split by facility type, component and tier.
- South Korea Data Center Server Market Servers in South Korea, split by data-center tier, form factor and application / workload.
- South Korea Hyperscale Data Center Market Hyperscale sites demand across South Korea, covering facility type, component and tier.
- South Korea AI Data Center Market South Korea AI facilities, split by facility type, component and tier.
- South Korea Data Center Physical Security Market South Korea's physical security, split by component, data-center tier and facility type.
- China Data Center SSD Market SSDs demand across China, covering form factor, interface and nand technology.
- Mexico Hyperscale Data Center Market Hyperscale sites demand across Mexico, covering facility type, component and tier.
- United States Data Center Server Market Servers demand across the US, covering data-center tier, form factor and application / workload.
- South America Hyperscale Data Center Market Hyperscale sites demand across South America, covering facility type, component and tier.