
Market Overview
| Study Period | 2021 - 2031 |
|---|---|
| Forecast Data Period | 2026 - 2031 |
| Historical Data Period | 2021 - 2024 |
| Growth Rate | 3.18 % |
| Market Concentration | Medium |
Major Players *Disclaimer: Major Players sorted in no particular order Image © Mordor Intelligence. Reuse requires attribution under CC BY 4.0. | |
South And Central America Smart Grid Network Market Analysis by Mordor Intelligence
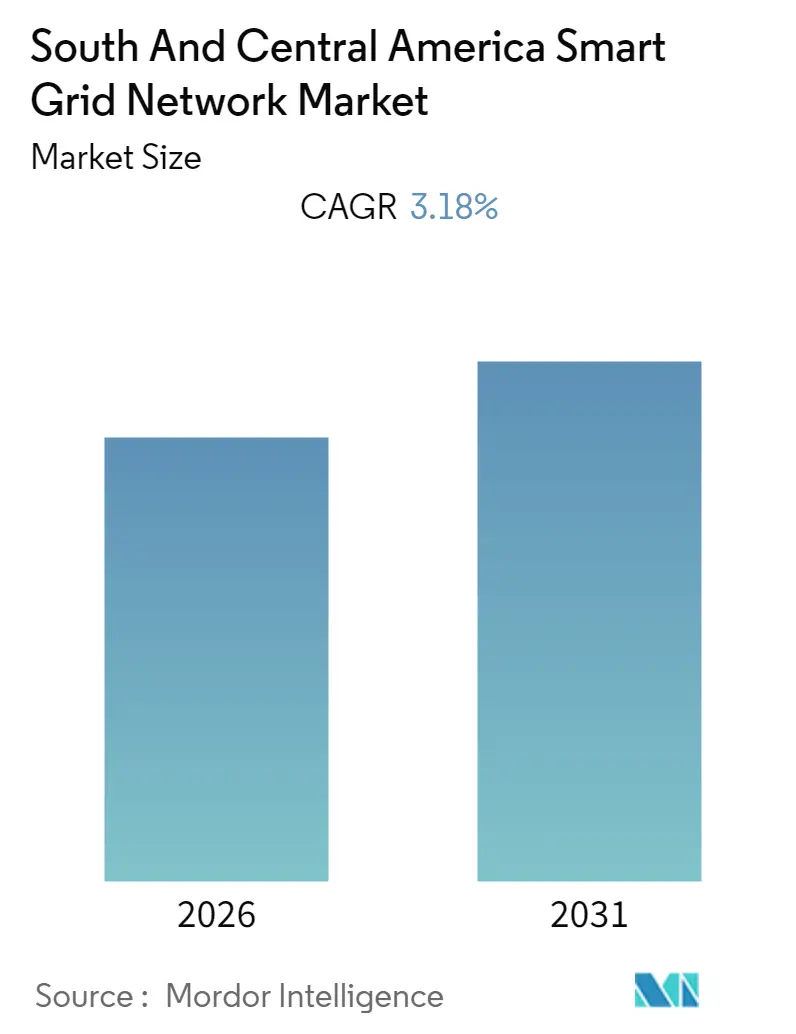
The South and Central America Smart Grid Network Market size is expected to register a CAGR of 3.18% during the forecast period.
- Advanced Metering Structure devices are fundamental devices in the modernization of the grid network. With sound installation, AMS is expected to witness considerable growth in the forecast period.
- In January 2018, the Colombian Ministry of Mines and Energy established a target for advanced metering infrastructure (AMI) to be deployed by 2030 to cover 95% of consumer units in urban centers and 50% of rural units, equivalent to 11 million units. This is going to create vast market opportunities for market players.
- Brazil is the largest producer of electricity in the entire South, and Central America has the potential to be the largest market for the smart grid in the forecast period. With more than 500 TWh of electricity in 2018, Brazil is expected to drive the smart grid market in South America.
Note: Market size and forecast figures in this report are generated using Mordor Intelligence’s proprietary estimation framework, updated with the latest available data and insights as of 2026.
South And Central America Smart Grid Network Market Trends and Insights
Advanced Metering Infrastructure to Witness a Significant Growth
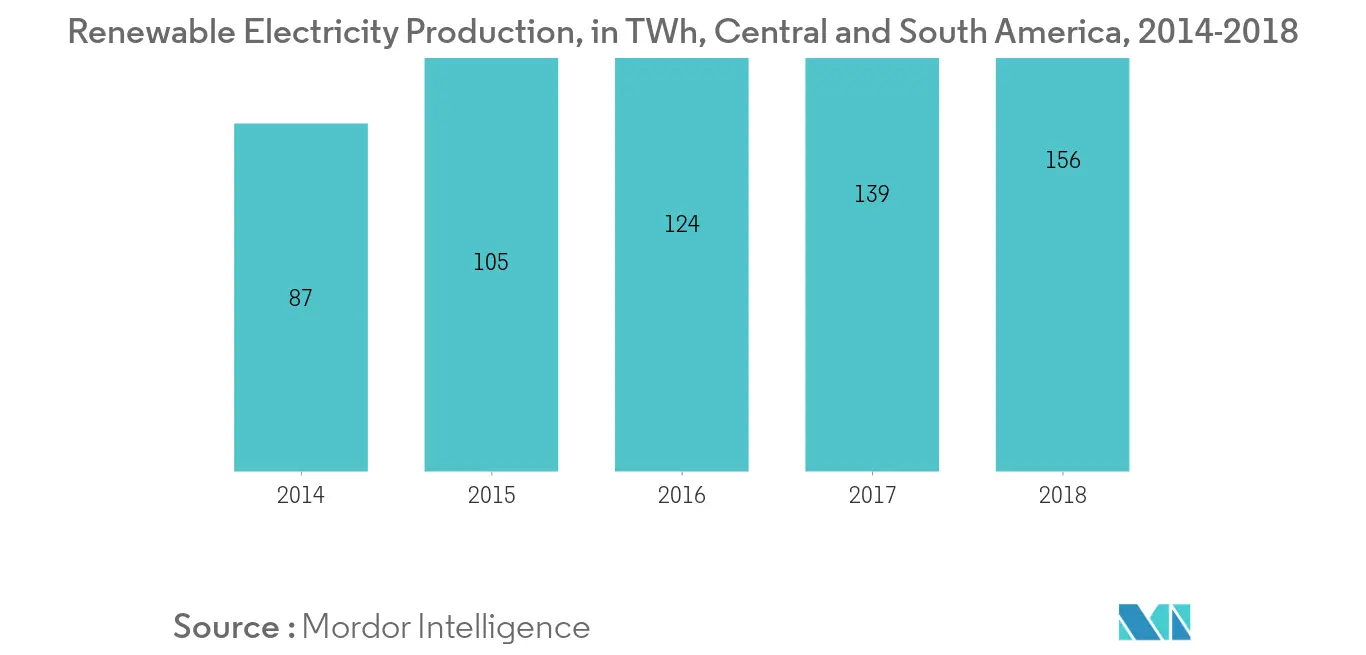
- Advanced metering infrastructure (AMI) or smart metering is an integrated system of smart meters, which are expected to be installed widely with the growth of renewable electricity in the region to more than 150 TWh in 2018.
- In Chile, according to the Energy Ministry, the installation of more than 6.5 million smart meters by 2025 is planned. By this, Chile is expected to increase its share in the smart grid significantly.
- In 2019, the Eletrobras Distribution Rehabilitation project initiated distributing AMI meters with telemetering capability to low voltage (LV) users on a large-scale. This resulted in benefitting four million consumers in six states of Brazil and increasing the AMI market significantly.
- In January 2018, the Colombian Ministry of Mines and Energy established a target for advanced metering infrastructure (AMI) to be deployed by 2030 to cover 95% of consumer units in urban centers and 50% of rural units, equivalent to 11 million units. This is going to create vast market opportunities for market players
- With multiple advantages of modifying grids, more countries of Central and South America are accepting the smart meters and smart grid technology, which is anticipated to grow further in the forecast period.
Brazil to Emerge as a Largest Market for Smart Grid in the Region
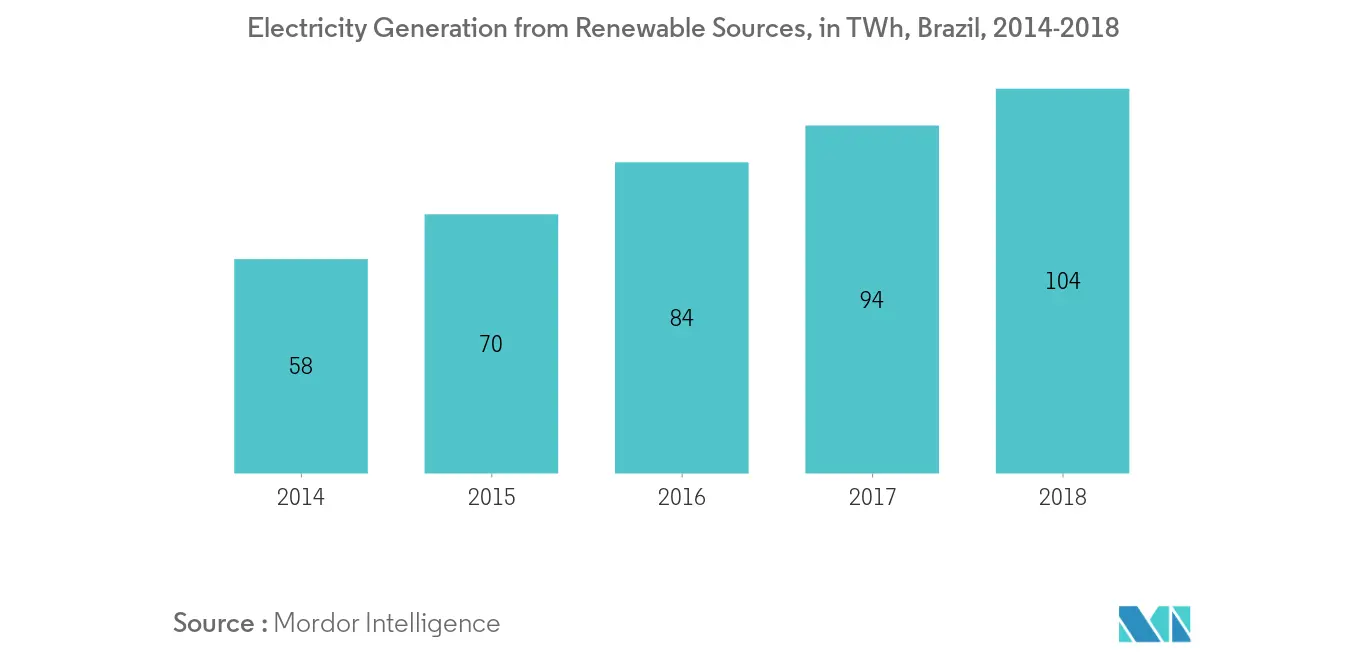
- In 2018, Brazil generated 588 TWh of electricity out of which more than 100 TWh is generated from renewable resources. Large scale modification of the grid network is required to incorporate developing renewable energy
- With a vast network of a country-wide interconnected grid of 130,000 km of high voltage transmission lines, Brazil is expected to invest USD 41 billion by the end of 2024 in the development and modification of the transmission sector.
- In 2018, Enel Group acquired the Eletropaulo company, which distributes electricity to the 23 municipalities of the metropolitan area of Sao Paulo, working towards digitalization and automation of the grid network.
- In 2019, the United States Trade and Development Agency (USTDA) awarded a grant to Grupo Equatorial Energia to develop a smart grid network improving the delivery of electricity to more than 2.4 million customers in the state of Maranhão.
- Brazil, with its enormous resources and ambitious renewable projects, is expected to grow in the smart grid market considerably in the forecast period.
Regulatory Landscape
Brazil is tightening its policy framework for digital distribution and flexibility resources. Normative Ordinance (Portaria Normativa) MME No. 111/2025 set general guidelines for the gradual digitalization of low-voltage distribution networks, and ANEELs 2026-2027 regulatory agenda (91 activities) includes rulemaking linked to smart grids, including electricity storage, curtailment, and market opening, following Law 15.269/25 that formalizes storage as a regulated activity.
Grid access and metering rules are also shifting in ways that affect smart-grid investment decisions. Brazils National Policy for Access to the Transmission System (PNAST) moved toward batch-based access seasons (replacing first-come-first-served), with the first access season scheduled in October 2026, and Portaria Normativa MME 126/2026 requires distribution concessionaires to submit a cost-benefit analysis for smart meter implementation by February 29, 2028, creating a clearer compliance pathway for AMI and related digital assets.
Value Chain Analysis
The value chain spans (i) policy and planning bodies, (ii) utilities and grid operators, (iii) EPC and system integrators, (iv) OEMs for meters, communications, substation equipment, and automation software, and (v) installation, commissioning, and O&M service providers. On the demand side, distribution concessionaires and transmission developers anchor procurement, with Brazil's digitalization guidance under MME Normative Ordinance No. 111/2025 feeding into multi-year programs for AMI rollout, grid monitoring, and automation, while large transmission builds in Brazil and Chile expand the addressable scope for control, protection, substation digitalization, and communications layers.
Hardware and software flows typically start with device manufacturing (smart meters, sensors, substation equipment), then integration of head-end systems, MDM, and SCADA/ADMS upgrades, followed by field deployment and lifecycle services. Recent activity shows the chain being pulled through multiple workstreams, including Hangzhou Hexing Electrics' amendment for additional smart meters in Parana (part of a 1.3 million unit turnkey program), Brazils Tangara transmission upgrades adding 2,300 MVA of transformation capacity through transformer and 500 kV line works, and Chiles Kimal-Lo Aguirre HVDC construction start, each requiring engineering services, grid-telecom work, protection systems, and data platforms.
Competitive Landscape
The South and Central America Smart Grid Network Market is partially consolidated. Some of the major companies include Enel Group, Honeywell International Inc., Itron Inc., Siemens AG, Schneider Electric SE, and others.
South And Central America Smart Grid Network Industry Leaders
-
Enel Group
-
Honeywell International Inc.
-
Siemens Ag
-
Schneider Electric Se
-
Itron Inc.
- *Disclaimer: Major Players sorted in no particular order

Market Opportunities and Future Outlook
Regulatory mandates and cost-recovery structures are creating near-term procurement lanes for AMI, communications, and data platforms across key countries. In Brazil, MME Normative Ordinance No. 126 (January 2026) introduced annual mandates for distributors to install smart metering systems in 2% of consumer units per year over 24 months starting March 1, 2026, alongside requirements tied to multi-year investment planning for digital assets and loss reduction. Peru has also put a financing mechanism in place via Ministerial Resolution No. 421-2025, allowing smart meter costs to be recovered through monthly proration over a 15-year useful life, which supports utility-led rollout economics.
Transmission access reform and flexibility integration are also opening space for planning software, monitoring, and grid-control solutions that tie distribution digitalization to transmission constraints. Under Brazils PNAST access-season approach, ONS reported 367 registrations totaling 20.31 GW approved in 2026, increasing the operational need for connection-studies transparency, congestion visibility, and network analytics. In parallel, Colombias Decree 0393 (April 2026) integrated public policy guidelines for energy storage systems (SAE) into both the National Interconnected System (SIN) and Non-Interconnected Zones (ZNI), strengthening demand for protection, control, and telemetry solutions that enable storage participation and grid stability.
Recent Industry Developments
- June 2026: Enel launched the Urban Futurability digital transformation program in Vila Olimpia, Sao Paulo, backed by an investment of about R$ 125 million and more than 40 AI and grid digitalization initiatives. The program supports advanced grid monitoring, automation, and data platforms within dense urban networks, and it provides a replicable reference architecture for other concessions.
- December 2025: Enel Sao Paulo reported reaching 2 million smart meters installed in its concession area, representing roughly a quarter of its customer base. The milestone points to scaled AMI deployment in Brazil and expands downstream demand for meter data management, communications infrastructure, and operational analytics tied to loss reduction and service quality.
- March 2024: Siemens announced a partnership with CPFL Energia to digitalize parts of the electricity sector in Sao Paulo, including the replacement of 1.6 million conventional meters with smart meters by 2029 and use of Gridscale X MDM software. The agreement increases competitive intensity among AMI and software suppliers and accelerates utility adoption of standardized data and integration layers for large meter fleets.
Research Methodology Framework and Report Scope
Market Definition and Coverage
For this study, the smart grid network market covers spending on the communication and control network layer that enables smart grid functions across the power system in South and Central America. This includes utility-side networks, field device connectivity, and supporting integration services.
Scope exclusions: It excludes electricity generation assets and pure telecom carrier revenue that is not directly tied to utility smart grid projects.
Segmentation Overview
- Technology Application Area
- Transmission
- Demand Response
- Advanced Metering Infrastructure (AMI)
- Other Technology Application Areas
- Geography
- Brazil
- Argentina
- Chile
- Rest of South and Central America
Data Sources, Market Sizing, and Validation
Desk Research
Desk research was first used to map demand drivers and the utility investment cycle, then to set reasonable bounds for what can be deployed in each country over the study period. We referenced public sources such as energy regulator publications, national statistics offices, and utility planning documents, and then used grid reliability and outage dashboards where those were available.
To anchor assumptions, we also reviewed sources such as IEA and IRENA publications on grid modernization and renewable integration, ITU indicators for telecom and broadband readiness, and regional development bank notes on transmission and distribution investment priorities. Company annual reports, investor presentations, and reputable press were used to understand project pipelines and the direction of pricing. Select paid subscriptions were used only for company financial intelligence, patent scanning, and shipment-level import-export checks where equipment flows materially affect the buildout picture. These sources are illustrative, and many additional public documents were reviewed for data collection, validation, and clarification.
Primary Interviews and Surveys
Expert interviews and surveys with utility executives, grid planning leaders, technology specialists, and procurement managers across South and Central America test rollout timing, project conversion, network design, and realized pricing. We use these findings to check secondary data, fill country-level gaps, and adjust assumptions across the defined geography. Final inputs are compared with regulator filings, project awards, and utility plans.
Distribution of primary research fieldwork respondents
| Company type | Respondent position |
|---|---|
| Top tier: 28% | CXOs: 18% |
| Mid tier: 47% | Functional/Unit leaders: 30% |
| Smaller Players: 25% | Managers: 52% |
Market-Sizing & Forecasting
Sizing was built using a top-down approach where utility capex signals, modernization targets, and program-level rollout plans were translated into an addressable smart grid network spend pool by country, then consolidated for the region. To keep the totals realistic, the outputs were corroborated with selective bottom-up approximations, including sampled project bill-of-material checks, typical ASP ranges for key network elements, and limited supplier and channel roll-ups where disclosure allows.
Key inputs used in the model include AMI rollout pace, feeder automation and distribution monitoring intensity, transmission and distribution investment levels, connectivity mix (wireline versus wireless), and local currency movement against the USD, since many network components are priced with imported content. Forecasting relied mainly on scenario analysis, where base, delayed, and accelerated deployment paths were set using expert consensus on regulatory follow-through, financing availability, and utility execution capacity. When bottom-up visibility was thin in smaller countries, gaps were handled through proxy penetration ranges tied to meter and substation counts, followed by a reasonableness check against utility budgets.
Data Validation & Update Cycle
Model totals were cross-checked against independent signals such as public procurement awards, announced rollout milestones, and import patterns for relevant equipment categories, then reviewed for year-to-year jumps that do not match utility planning cycles. We re-contacted sources when pricing shifted, tenders were delayed, or policy moves created a material variance versus the expected path.
Before sign-off, outputs pass through multi-step analyst review with variance notes documented at the country and application level, followed by a final consistency pass across assumptions. Reports are refreshed annually, and interim updates are made when major events change project timing or budget direction, followed by a fresh update sweep right before delivery.
Mordor Intelligence's South and Central America Smart Grid Network Market Estimate Compared With Other Published Estimates
Published market values for smart grid networks in South and Central America often differ because the boundary between network-specific spending and broader smart grid infrastructure is not handled the same way, and because currency conversion and pricing updates are applied on different schedules.
When annual refresh timing is not aligned to local tender cycles, the resulting market size can swing, especially in years with delayed AMI awards or sudden FX movement. A separate driver is ASP logic, where some models assume a straight-line price decline while others hold prices flat even when solution scope changes (for example, added cybersecurity or integration work). These differences are further amplified if validation relies only on desk signals. By re-basing FX assumptions to the same conversion window used for tender pricing and re-checking ASP movement with regional channel feedback, Mordor Intelligence keeps the estimate closer to what utilities are actually contracting in a given year.
Benchmark comparison
| Source | Market Size | Gaps in Research Methodology |
|---|---|---|
| Mordor Intelligence | USD 0.00 B (2024) | |
| Regional Consultancy A | USD 2.20 B (2024) | This figure appears to treat the market as the broader smart grid stack, where software, services, and non-network grid upgrades can be counted together, which inflates network-only totals for the same year. |
| Industry Publisher B | USD 4.90 B (2025) | The scope is presented as Latin America smart grid infrastructure, which is wider than smart grid network, and the year is different, so FX timing and the inclusion of generation-to-consumption applications widen the gap versus a network-layer definition. |
The comparison points to two practical reasons behind the spread, which are scope width and the timing of pricing and currency conversions. Using a network-layer definition, plus repeatable checks against project scope and recent tender pricing, produces a market size that is easier to reconcile to what gets deployed and paid for year by year.
Key Questions Answered in the Report
What is the current South and Central America Smart Grid Market size?
The South and Central America Smart Grid Market is projected to register a CAGR of 3.18% during the forecast period (2026-2031)
Who are the key players in South and Central America Smart Grid Market?
Enel Group, Honeywell International Inc., Siemens Ag, Schneider Electric Se and Itron Inc. are the major companies operating in the South and Central America Smart Grid Market.
What years does this South and Central America Smart Grid Market cover?
The report covers the South and Central America Smart Grid Market historical market size for years: 2020, 2021, 2022, 2023 and 2024. The report also forecasts the South and Central America Smart Grid Market size for years: 2026, 2027, 2028, 2029, 2030 and 2031.