
South America Tourism Vehicle Rental Market Size and Share
Market Overview
| Study Period | 2019 - 2031 |
|---|---|
| Forecast Data Period | 2026 - 2031 |
| Base Year Market Size (2025) | USD 4.25 Billion |
| Market Size (2026) | USD 4.51 Billion |
| Market Size (2031) | USD 6.10 Billion |
| Growth Rate (2026 - 2031) | 6.21 % |
| Market Concentration | Medium |
Major Players *Disclaimer: Major Players sorted in no particular order Image © Mordor Intelligence. Reuse requires attribution under CC BY 4.0. | |
South America Tourism Vehicle Rental Market Analysis by Mordor Intelligence
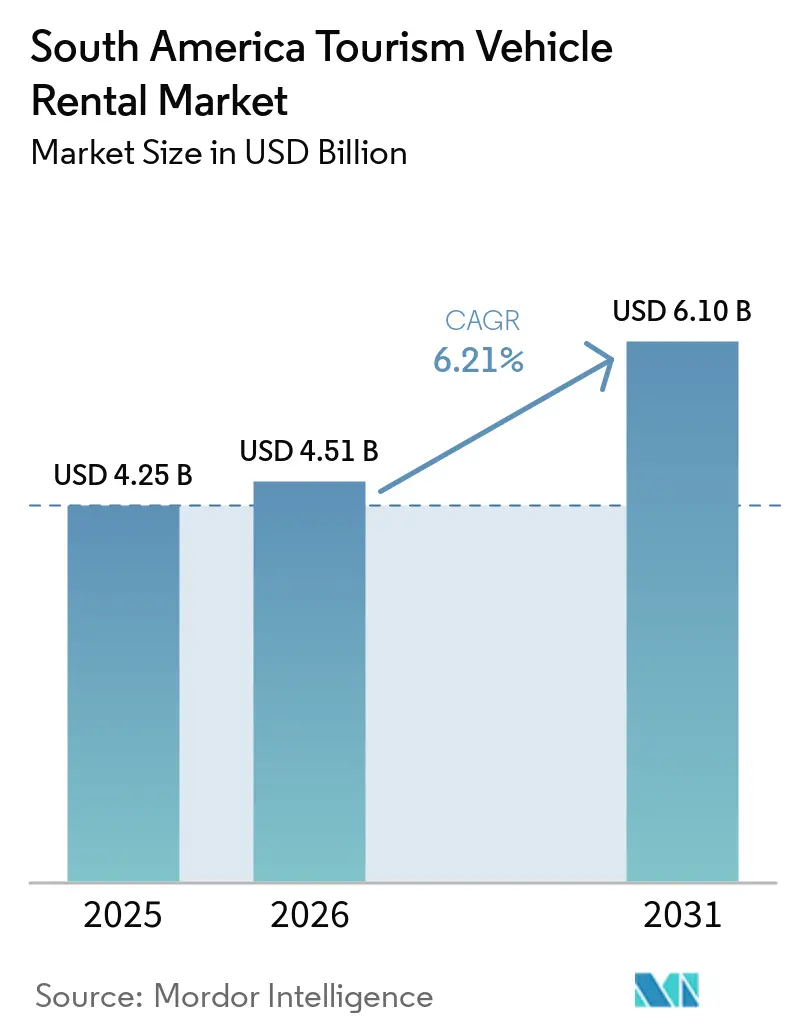
The South America tourism vehicle rental market size was valued at USD 4.25 billion in 2025, is estimated at USD 4.51 billion in 2026, and is projected to reach USD 6.10 billion by 2031, growing at a CAGR of 6.21% from 2026 to 2031. International travel recovery is supporting rental demand, especially as travelers opt for flexible routes rather than fixed transport. South America recorded growth in international tourist arrivals, while the Americas as a whole received a substantial number of visitors, supporting the region’s tourism base. Airport locations remain central because they connect rental fleets with arriving visitors and regional road trips. The South American tourism vehicle rental market also depends on fleet renewal, as travelers increasingly expect reliable vehicles and digital booking options. Higher borrowing costs and currency pressure may limit fleet investment, particularly for operators with narrow funding options. The South American tourism vehicle rental market, therefore, favors companies that combine local branch coverage, efficient pricing, and access to funding.
Key Report Takeaways
- By vehicle type, economy cars held 43.47% revenue share in 2025, while luxury cars are forecast to grow at a 7.32% CAGR through 2031.
- By booking mode, online platforms held 54.29% revenue share in 2025 and are forecast to grow at an 8.19% CAGR through 2031.
- By rental duration, hourly rentals accounted for 41.78% of revenue in 2025, while monthly subscriptions are forecast to grow at an 8.22% CAGR through 2031.
- By end user, self-driven rentals held 65.23% revenue share in 2025, while chauffeur-driven rentals are forecast to grow at a 7.73% CAGR through 2031.
- By customer type, leisure travelers held 46.12% revenue share in 2025, while international tourists are forecast to grow at a 7.44% CAGR through 2031.
- By application, airport rentals held 39.28% revenue share in 2025, while adventure and eco-tourism rentals are forecast to grow at a 7.93% CAGR through 2031.
- By country, Brazil accounted for 37.23% of revenue in 2025 and is forecast to grow at a 7.39% CAGR through 2031.
Note: Market size and forecast figures in this report are generated using Mordor Intelligence’s proprietary estimation framework, updated with the latest available data and insights as of January 2026.
South America Tourism Vehicle Rental Market Trends and Insights
Drivers Impact Analysis*
| Driver | (~) % Impact on CAGR Forecast | Geographic Relevance | Impact Timeline |
|---|---|---|---|
| International Tourism and Road-Trip Recovery | +1.8% | Brazil, Chile, Peru, Colombia, South America-wide | Short term (≤ 2 years) |
| Online and Mobile Booking Conversion | +1.2% | Brazil, Colombia, Chile, Peru | Medium term (2-4 years) |
| Airport and Low-Cost Airline Connectivity | +0.9% | Brazil, Chile, Colombia | Short term (≤ 2 years) |
| Fleet Renewal and Telematics Utilization | +0.7% | Brazil, Chile, Colombia | Long term (≥ 4 years) |
| Integrated Platforms and Loyalty Programs | +0.6% | Brazil, Argentina, Chile | Medium term (2-4 years) |
| Event-Led and Nature-Based Tourism Corridors | +0.5% | Chile, Peru, Colombia, Argentina | Medium term (2-4 years) |
| Source: Mordor Intelligence | |||
International Tourism and Domestic Road-Trip Recovery
International tourism is expanding the pool of travelers who need independent ground transport across the tourism and vehicle rental markets in South America. Brazil’s international arrivals increased by 37% in 2025, according to UN Tourism data, reflecting stronger cross-border travel to a major destination [1]UN Tourism, “International Tourist Arrivals Up 4% in 2025 Reflecting Strong Travel Demand Around the World,” UN Tourism, unwto.org.. Longer visitor stays can support longer rental periods and higher revenue per agreement. Visitors increasingly use rental vehicles to reach destinations beyond large cities. This pattern supports longer bookings in coastal, mountain, and nature-focused routes. Chile, Peru, Colombia, and Brazil benefit when travelers build multi-stop itineraries. The South American tourism vehicle rental market gains when road travel becomes part of the visitor experience rather than only a local transport option.
Online and Mobile Booking Conversion
Digital reservations have become central to how travelers compare vehicles, prices, insurance options, and pickup locations. Online platforms accounted for most of the bookings in 2025, confirming that pre-trip planning is increasingly conducted through digital channels. Mobile applications support this shift by allowing travelers to manage reservations during their journeys. Integrated travel platforms can place rental inventory alongside flights, accommodation, and local services. Clear pricing and well-organized booking information also matter because travelers need to compare total costs before arrival. These changes favor operators that can maintain reliable digital inventory and provide localized service information across the tourism vehicle rental market in South America.
Airport and Low-Cost Airline Connectivity Expansion
Airport connectivity serves as a direct channel for demand, as many visitors arrange vehicle rentals shortly after landing. South American aviation continues to expand scheduled seat capacity, while low-cost carriers are increasing their capacity at a faster pace. Low-cost airlines can improve access to secondary destinations and strengthen rental demand beyond major gateways. Airport concession agreements also establish service, insurance, and staffing requirements that formal operators must meet [2]Aviacionline, “Driven by Low-Cost Carriers and Argentina’s Boom, Latin American Aviation Hits Record Capacity,” Aviacionline, aviacionline.com.. These standards can favor companies with the resources to operate across multiple national markets. Consequently, the South American tourism vehicle rental market is closely linked to airport capacity, airline route development, and the quality of terminal access.
Fleet Renewal and Digital Fleet Management
Fleet renewal supports vehicle availability and service quality in the South American tourism-vehicle-rental market. Brazil’s rental sector continues to acquire vehicles, reducing the average fleet age. Rental companies in Brazil are also increasing registrations of electrified vehicles. Digital pricing tools and vehicle data enable companies to align available supply with seasonal demand, particularly in tourism corridors where booking patterns change rapidly. Fleet modernization also supports travel in protected areas that require suitable vehicles. Operators with modern fleets and responsive pricing capabilities hold a stronger position in the South American tourism vehicle rental market.
Restraints Impact Analysis*
| Restraint | (~) % Impact on CAGR Forecast | Geographic Relevance | Impact Timeline |
|---|---|---|---|
| High Interest Rates and Fleet-Financing Costs | -0.8% | Brazil, Argentina, Colombia | Short term (≤ 2 years) |
| Currency Volatility and Vehicle Import Constraints | -0.6% | Argentina, Brazil, Colombia, Chile | Medium term (2-4 years) |
| Ride-Hailing and Alternative Mobility Substitution | -0.5% | Brazil, Colombia, urban markets | Long term (≥ 4 years) |
| Electric Vehicle Residual Value, Charging, and Maintenance Risk | -0.3% | Brazil, Chile | Long term (≥ 4 years) |
| Source: Mordor Intelligence | |||
High Interest Rates and Fleet-Financing Costs
High borrowing costs limit rental companies’ ability to purchase vehicles and expand their fleets. Because fleet acquisition requires significant capital investment, higher financing expenses can reduce returns on each vehicle. Limited vehicle purchases may constrain availability during seasonal peaks and major events. Smaller regional operators face greater pressure because they have fewer financing options than large fleet operators or franchise networks. This constraint affects the South American tourism vehicle rental market by increasing the importance of fleet utilization and vehicle selection.
Ride-Hailing and Alternative Mobility Substitution
Ride-hailing platforms compete most directly with short trips in dense urban areas. City-to-airport journeys and point-to-point travel are the rental occasions most likely to benefit from this alternative. The pressure is lower for multi-day, rural, cross-border, and outdoor itineraries where a dedicated vehicle is more useful. Operators can reduce exposure by serving longer rentals, subscriptions, and specialized trips. Regulatory changes can also affect the availability of ride-hailing services, adding uncertainty for travelers who depend on such platforms. The tourism vehicle rental market in South America retains a defensible role for itineraries that require continuous access to a vehicle.
*Our forecasts treat driver/restraint impacts as directional, not additive. The impact forecasts reflect baseline growth, mix effects, and variable interactions.
Segment Analysis
By Vehicle Type: Economy Volume Supports Premium Options
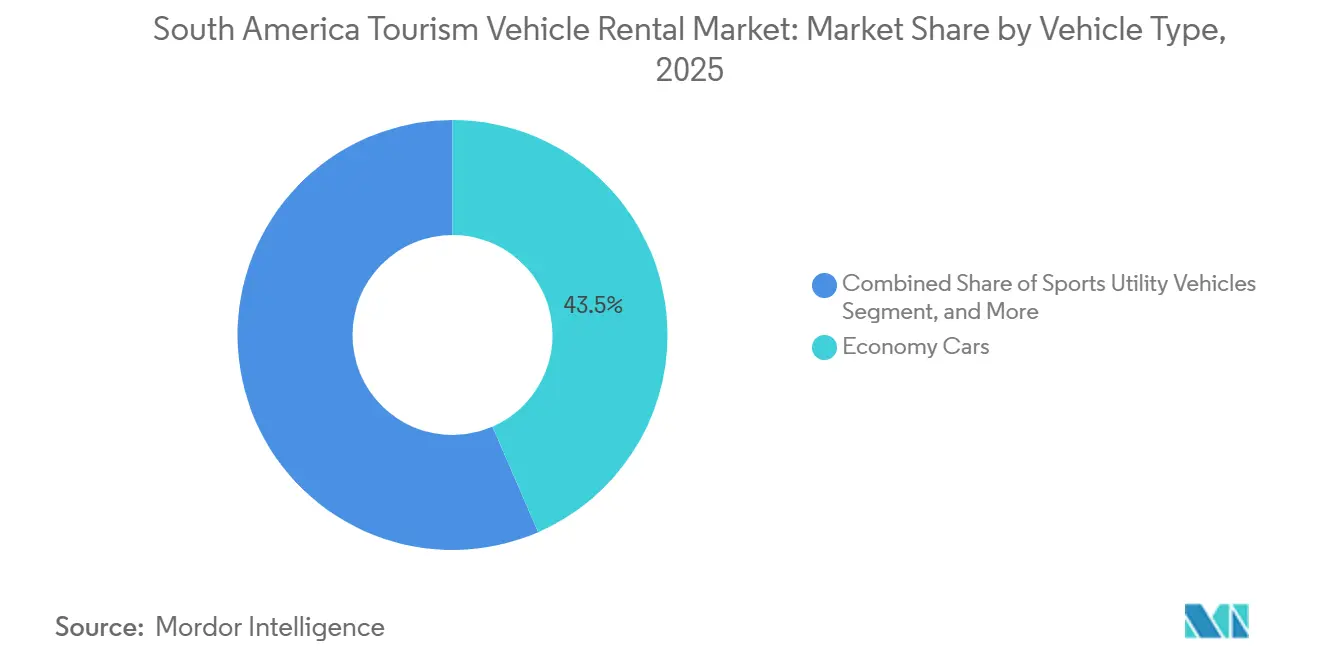
Economy cars accounted for 43.47% of the South American tourism vehicle rental market share in 2025, making them the largest vehicle category. Their affordability suits many leisure travelers and helps operators maintain broad availability. SUVs and vans address family travel, groups, and journeys that need additional space. Motorhomes and specialty vehicles support outdoor routes in Patagonia and the Amazon basin. Luxury cars are forecast to register a 7.32% CAGR through 2031. Premium inbound tourism, event hospitality, and chauffeur-driven services support this faster growth.
Economy cars generate the recurring rental volume that supports fleet renewal in the South American tourism vehicle rental market. Luxury and executive vehicles enable operators to serve visitors seeking more tailored services. Specialized fleets require maintenance, insurance, and deployment practices that differ from those for standard airport rental vehicles. As operators expand vehicle options, hybrid and electric models may enter the economy and mid-range rental fleets. Localiza announced an agreement with BYD to procure hybrid and electric vehicles for rental and related applications. The agreement includes the Song Plus, Song Pro, Dolphin, and Dolphin Mini models.



By Booking Mode: Digital Channels Lead Reservations
Online platforms accounted for 54.29% of the tourism vehicle rental market share in South America in 2025 and were the leading booking mode. The same channel is forecast to grow at an 8.19% CAGR through 2031. Travelers can reserve vehicles before departure and compare terms across locations. Mobile applications add flexibility during the booking, pickup, and return process. Offline agencies still serve travelers who arrange a vehicle in person. Their role is narrowing as digital reservation behavior becomes more familiar.
Digital distribution can improve advanced visibility of demand and support more efficient fleet allocation. It can also reduce dependence on counter-based reservations at airport locations. Travel platforms, loyalty programs, and embedded mobility services can place rental choices beside other travel purchases. Operators need accurate availability and transparent pricing across these channels. The booking change does not remove the importance of branch operations, since vehicles still need to be delivered and serviced locally. It does, however, make digital service quality a key part of competition in the tourism vehicle rental market in South America.
By Rental Duration: Subscriptions Extend Customer Relationships
Hourly rentals captured 41.78% of revenue in 2025, the largest share by rental duration. These bookings reflect short airport transfers and urban travel needs. Daily and weekly arrangements remain important for conventional leisure itineraries. Monthly subscriptions are forecast to expand at an 8.22% CAGR through 2031, the highest rate among duration categories. The subscription format bundles a vehicle with services that are otherwise charged separately. It can appeal to extended-stay visitors, digital nomads, and temporary corporate relocations.
Longer-duration plans can create more predictable revenue than individual day-rate transactions. They also reduce reliance on short trips where ride-hailing platforms are strongest. The tourism vehicle rental industry in South America can use subscriptions to bundle insurance, maintenance, taxes, and roadside support into a single payment. Localiza’s Meoo platform and KINTO ONE Personal were cited in the supplied research as examples of all-inclusive monthly plans. These offers address customers whose travel periods do not fit conventional daily pricing. The model may strengthen customer retention when the vehicle is needed for several weeks or months.
By End User: Self-Drive Leads, Chauffeur Service Grows Faster
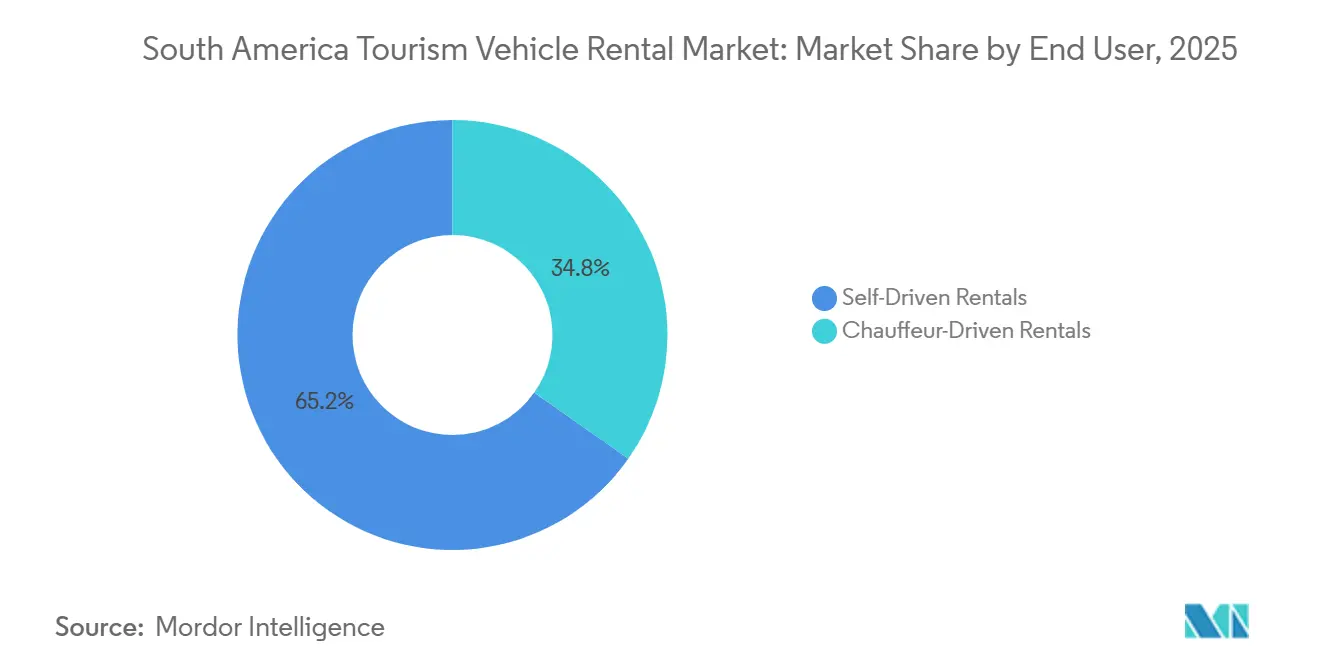
Self-driven rentals represented 65.23% of the tourism vehicle rental market share in South America in 2025. Many travelers value the control and itinerary flexibility that self-drive arrangements provide. The category suits independent road trips and multi-stop leisure travel. Peru’s Sacred Valley, Chile’s Carretera Austral, and Brazil’s Chapada Diamantina suit flexible road travel. Digital booking also makes self-drive services easier for international visitors. The segment supports travel beyond fixed guided-tour schedules. It remains the central service format for the South American tourism vehicle rental market.
Chauffeur-Driven Rentals are projected to grow at 7.73% through 2031. Premium leisure and corporate travel support the format. Travelers may use chauffeurs for airport transfers, executive travel, and curated local mobility. This service can align rental operators with hotels, airport lounges, and cruise terminals. The service is smaller than self-drive rentals but can generate higher revenue per trip. It can also provide a differentiated offer in premium tourism corridors. The South American tourism vehicle rental industry can use chauffeur services to address higher-service travel needs.
By Customer Type: Leisure Demand is the Base, International Travel Adds Yield
Leisure travelers accounted for 46.12% of revenue in 2025 and formed the largest customer group. Their demand supports vacation routes, airport arrivals, and domestic road trips. Business and domestic travelers provide additional activity outside holiday periods. International tourists are forecast to grow at a 7.44% CAGR through 2031. These visitors may need multilingual booking support and clear local driving guidance. They can also require insurance, navigation, one-way returns, and cross-border permissions.
International arrivals support the tourism vehicle rental market in South America when visitors' itineraries extend beyond a single city. The Americas continue to welcome a significant volume of international arrivals, reinforcing the importance of inbound travel for ground mobility providers. Operators with airport presence and online distribution can engage travelers before arrival. Leisure customers remain critical, as they account for the largest share of existing demand. International visitors can increase revenue per transaction by selecting optional services. A diverse customer mix also helps operators reduce reliance on any single trip purpose.
By Application: Airport Rentals Provide Scale, Outdoor Travel Adds Specialization
Airport rentals generated 39.28% of revenue in 2025 and were the leading application in the South American tourism vehicle rental market. Airport locations serve travelers at the point where many journeys begin. City and intercity rentals support travelers after they leave the terminal. Adventure and eco-tourism rentals are forecast to grow at a 7.93% CAGR through 2031. These rentals often require 4x4 capability, stronger tires, high ground clearance, or roof racks. The service need creates an opening for operators with dedicated outdoor fleets.
Airport concessions remain strategically important because they influence customer access and brand visibility. Eco-tourism routes can support rates that differ from standard airport use because they need more specialized equipment. Brazilian rental fleets have expanded their adoption of electrified vehicles. However, limited charging infrastructure may constrain electric vehicle use on remote routes, supporting the relevance of hybrid models for certain applications. Heritage and nature-based itineraries also favor professionally maintained rental vehicles over informal alternatives. Therefore, the South American tourism vehicle rental market can develop airport and outdoor travel applications in parallel.
Geography Analysis
Brazil held 37.23% of regional revenue in 2025 and is projected to grow at 7.39% through 2031. This represented the largest share of the South American tourism vehicle rental market by country. Brazil’s large tourism industry, mature rental infrastructure, and extensive air network support its leading position in the regional market. The country maintains a substantial rental vehicle fleet, and rental companies continue to acquire vehicles to expand their operations. Fortaleza, Natal, and Salvador drive seasonal rental demand, while São Paulo and Rio de Janeiro generate year-round demand from urban and business travelers.
Chile and Argentina offer distinct opportunities beyond Brazil. Chile continues to attract a significant number of foreign visitors, supporting demand for vehicle rentals. SIXT has expanded into Chile through a franchise arrangement that includes airport locations and city branches. Argentina supports demand from airport-based travel and winter tourism. KINTO Share has established a growing presence in Argentina through its cumulative rental activity. Colombia and Peru also contribute to regional demand through inbound tourism and road-based travel.
The Rest of South America includes Bolivia, Uruguay, Paraguay, Ecuador, and other smaller markets. Uruguay continues to attract international arrivals, while Bolivia’s Salar de Uyuni and Andean routes require specialized vehicle formats. Paraguay combines corporate travel demand with inbound leisure travel. Although these countries generate lower rental volumes than Brazil, they offer opportunities for companies with regional networks. Cross-border routes can connect Chile and Argentina, as well as Peru and Bolivia. Consistent branch policies and flexible vehicle return options can help operators serve these routes more effectively—the South American tourism vehicle rental market benefits when operators can support travel across national borders.
Competitive Landscape
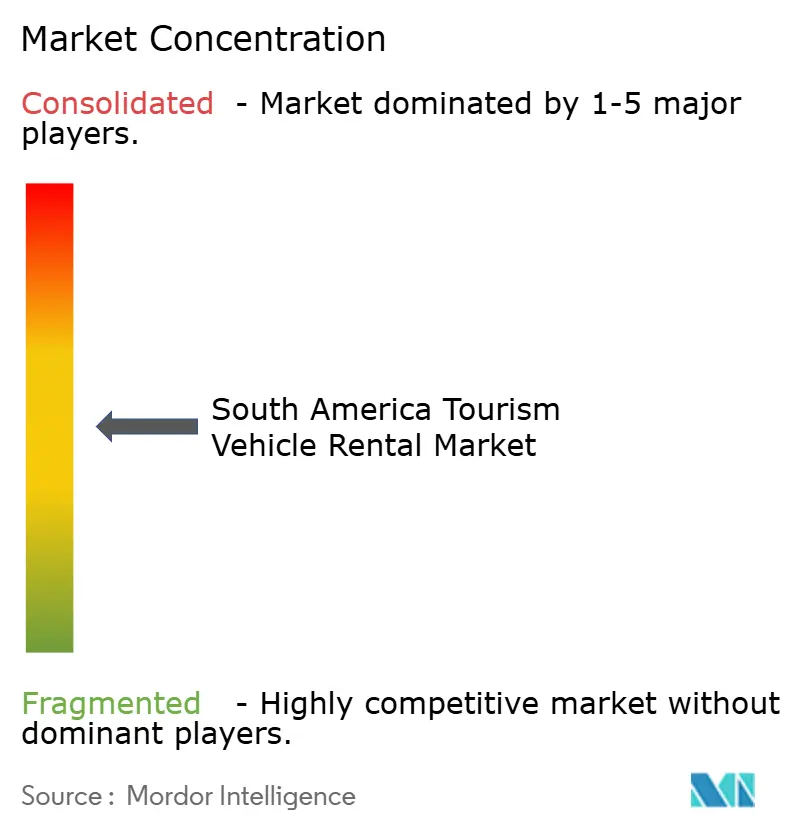
The South American tourism vehicle rental market is moderately concentrated, with large Brazilian operators accounting for a significant share of regional fleet capacity. Localiza operates a substantial rental vehicle fleet across Brazil. Movida and Unidas are other major Brazilian fleet operators. Their scale enables extensive branch networks, regular fleet replacement, and access to airport locations. High interest rates make fleet financing a critical competitive factor. Operators with greater access to capital can maintain coverage even as smaller companies limit vehicle purchases.
Fleet technology is emerging as an operational differentiator in the South American tourism vehicle rental market. Localiza’s agreement to acquire BYD hybrid and electric vehicles illustrates its fleet renewal strategy. The company also identifies telematics as part of its fleet management approach. These systems can support vehicle utilization monitoring and maintenance planning. Electric vehicle adoption also raises considerations regarding charging infrastructure, maintenance, and vehicle resale values. Operators need to align new vehicle technologies with the availability of local infrastructure and intended rental applications.
SIXT is expanding through franchise launches in Chile, the Cayman Islands, El Salvador, and Nicaragua, increasing its regional presence. Franchise expansion can increase geographic coverage without requiring the same level of fleet-financing investment in each country. Large operators also compete through airport concessions, loyalty programs, and online distribution channels. Outdoor travel presents an opportunity for more structured regional offerings, as tourism routes require specialized fleets and support services. This strategy requires consistent insurance coverage, digital booking capabilities, and customer assistance across dispersed tourism corridors.
South America Tourism Vehicle Rental Industry Leaders
Enterprise Rent-A-Car
Budget Car Rental
Localiza Rent a Car S.A.
Hertz Global Holdings, Inc.
National Car Rental
- *Disclaimer: Major Players sorted in no particular order

Recent Industry Developments
- July 2026: The City of Rio de Janeiro and GOL Linhas Aéreas announced plans to reposition Galeão International Airport as GOL’s international hub, including the launch of a new direct route to JFK. The Municipal Program for the Promotion of New International Air Routes supports the route, which is expected to increase inbound visitor volumes from North America and create growth opportunities for car rental operators at the terminal.
- February 2026: Localiza Rent a Car announced a strategic fleet supply agreement with China’s BYD to acquire 10,000 hybrid and fully electric vehicles over the next two years. The agreement covers the Song Plus, Song Pro, Dolphin, and Dolphin Mini models for use across daily rentals, monthly subscriptions, corporate fleet management, and the Seminovos used-car channel. The deal follows more than one year of joint operational testing.


South America Tourism Vehicle Rental Market Report Scope
The scope of the report includes Vehicle Type, Booking Mode, End User, Customer Type, Application, and Country. By Vehicle Type, the market is segmented into Economy Cars, Sports Utility Vehicles, Luxury Cars, Vans, Motorhomes (RVs), and Specialty Vehicles. By Booking Mode, the market is segmented into Online Platforms and Offline Rental Agencies. By rental duration, the market is segmented into Hourly Rentals, Daily Rentals, Weekly Rentals, and Monthly Subscriptions. By End User, the market is segmented into Self-Driven and Chauffeur-Driven. By Customer Type, the market is segmented into Leisure Travelers, Business Travelers, Domestic Tourists, and International Tourists. By Application, the market is segmented into Airport Rentals, City Rentals, Intercity Rentals, and Adventure and Eco-Tourism Rentals. By Country, the market is segmented into Brazil, Argentina, Chile, Colombia, Peru, and the rest of South America. The report offers market size and forecasts for all the above segments in value (USD).
| Economy Cars |
| Sports Utility Vehicles |
| Luxury Cars |
| Vans |
| Motorhomes (RVs) |
| Specialty Vehicles |
| Online Platforms |
| Offline Rental Agencies |
| Hourly Rentals |
| Daily Rentals |
| Weekly Rentals |
| Monthly Subscriptions |
| Self-Driven Rentals |
| Chauffeur-Driven Rentals |
| Leisure Travelers |
| Business Travelers |
| Domestic Tourists |
| International Tourists |
| Airport Rentals |
| City Rentals |
| Intercity Rentals |
| Adventure and Eco-Tourism Rentals |
| Brazil |
| Argentina |
| Chile |
| Colombia |
| Peru |
| Rest of South America |
| By Vehicle Type | Economy Cars |
| Sports Utility Vehicles | |
| Luxury Cars | |
| Vans | |
| Motorhomes (RVs) | |
| Specialty Vehicles | |
| By Booking Mode | Online Platforms |
| Offline Rental Agencies | |
| By Rental Duration | Hourly Rentals |
| Daily Rentals | |
| Weekly Rentals | |
| Monthly Subscriptions | |
| By End User | Self-Driven Rentals |
| Chauffeur-Driven Rentals | |
| By Customer Type | Leisure Travelers |
| Business Travelers | |
| Domestic Tourists | |
| International Tourists | |
| By Application | Airport Rentals |
| City Rentals | |
| Intercity Rentals | |
| Adventure and Eco-Tourism Rentals | |
| By Country | Brazil |
| Argentina | |
| Chile | |
| Colombia | |
| Peru | |
| Rest of South America |


Key Questions Answered in the Report
What is the forecast for tourism vehicle rental in South America?
The tourism vehicle rental South America market is forecast to reach USD 6.10 billion by 2031, expanding at a 6.21% CAGR from 2026 to 2031. Growth is supported by international arrivals, domestic road travel, airport access, and online reservations. The outcome also depends on vehicle availability, financing conditions, and operators’ ability to provide dependable coverage across airports and tourism corridors. The largest demand channels remain leisure travel and airport-linked mobility, while specialized outdoor trips create a separate need for capable vehicles.
Which vehicle category has the largest revenue share?
Economy cars held the largest share at 43.47% in 2025, reflecting their importance to leisure travelers and price-conscious self-drive trips.
Why are online reservation channels important?
Online platforms held 54.29% of bookings in 2025 and are forecast to grow at an 8.19% CAGR through 2031. These channels allow travelers to compare vehicles and terms before arriving. They also help operators forecast demand and place inventory across airports, cities, and leisure destinations, while mobile tools make it easier for customers to adjust bookings during travel. Strong digital presentation can also support transparent pricing, clear service information, and earlier customer engagement before visitors arrive in a destination.
Which rental duration is growing fastest?
Monthly subscriptions are forecast to grow at an 8.22% CAGR through 2031, ahead of other rental-duration categories. Hourly rentals remained the largest duration category at 41.78% of 2025 revenue. Subscription plans can serve extended-stay visitors and temporary relocations by combining a vehicle with insurance, maintenance, and roadside support, reducing the need to renew a conventional daily agreement. The format may also provide a more stable relationship than short bookings that are sensitive to urban ride-hailing alternatives.
Which country leads regional tourism vehicle rentals?
Brazil led with a 37.23% revenue share in 2025 and is forecast to grow at a 7.39% CAGR through 2031.
Page last updated on:





