
Market Overview
| Study Period | 2020 - 2031 |
|---|---|
| Forecast Data Period | 2026 - 2031 |
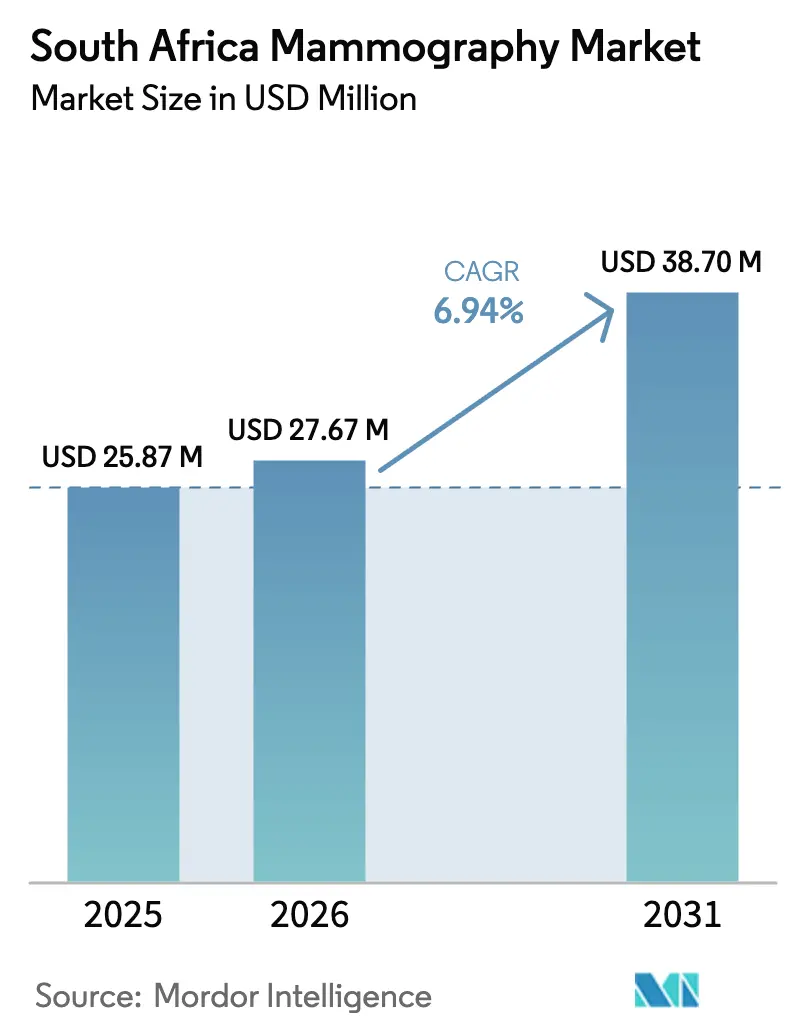
| Base Year Market Size (2025) | USD 25.87 Million |
| Market Size (2026) | USD 27.67 Million |
| Market Size (2031) | USD 38.7 Million |
| Growth Rate (2026 - 2031) | 6.94 % |
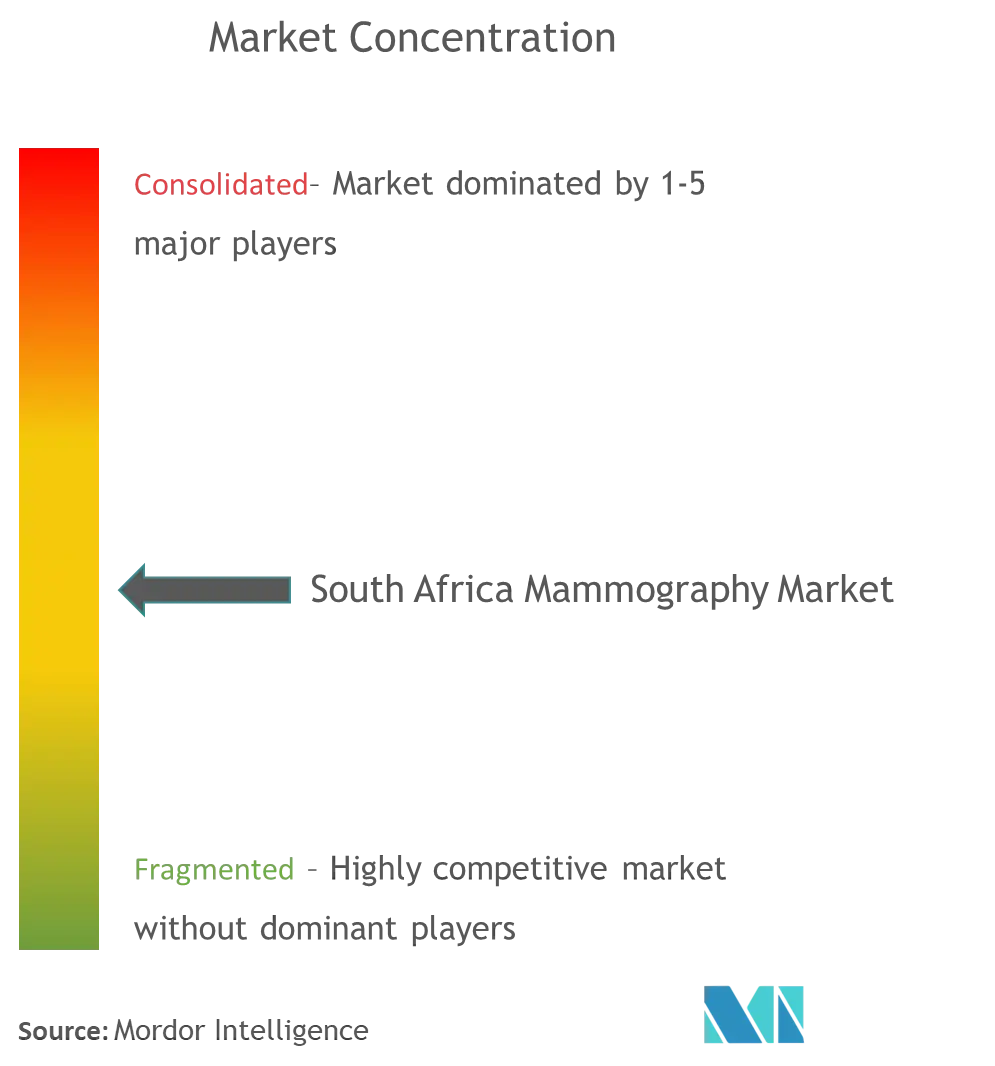
| Market Concentration | Medium |
Major Players *Disclaimer: Major Players sorted in no particular order Image © Mordor Intelligence. Reuse requires attribution under CC BY 4.0. | |
South Africa Mammography Market Analysis by Mordor Intelligence
South Africa mammography market size in 2026 is estimated at USD 27.67 million, growing from 2025 value of USD 25.87 million with 2031 projections showing USD 38.7 million, growing at 6.94% CAGR over 2026-2031. This growth reflects the combined influence of the May 2024 National Health Insurance (NHI) Act, an accelerating analog-to-digital replacement cycle, and sustained investment in 3-D tomosynthesis platforms. Demand is further strengthened by rising breast-cancer incidence, corporate ESG funding for women’s health programs, and hospital strategies that prioritize AI-ready imaging infrastructure. Procurement momentum is strongest in Gauteng, Western Cape, and KwaZulu-Natal, yet mobile screening units targeting rural provinces provide the fastest volumetric upside. Regulatory scrutiny from SAHPRA favors established vendors with complete quality documentation, steering public tenders toward globally recognized suppliers while still allowing niche entrants to win on service flexibility. Workforce shortages in radiography and medical physics continue to tighten capacity, which in turn amplifies interest in algorithm-based productivity tools.
Key Report Takeaways
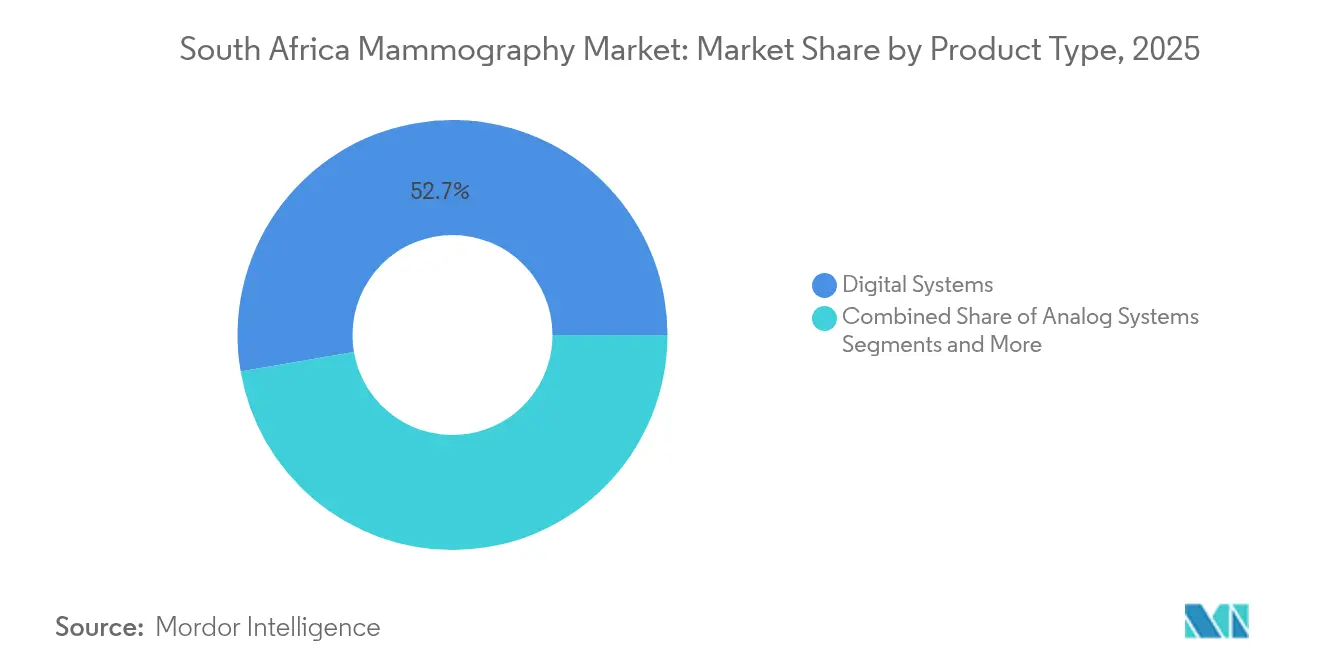
- By product type, digital systems captured 52.72% revenue share in 2025 while breast tomosynthesis is projected to rise at a 7.86% CAGR to 2031.
- By technology, 2-D full-field digital mammography held 47.65% of South Africa mammography market share in 2025 whereas 3-D tomosynthesis is on track for a 7.38% CAGR through 2031.
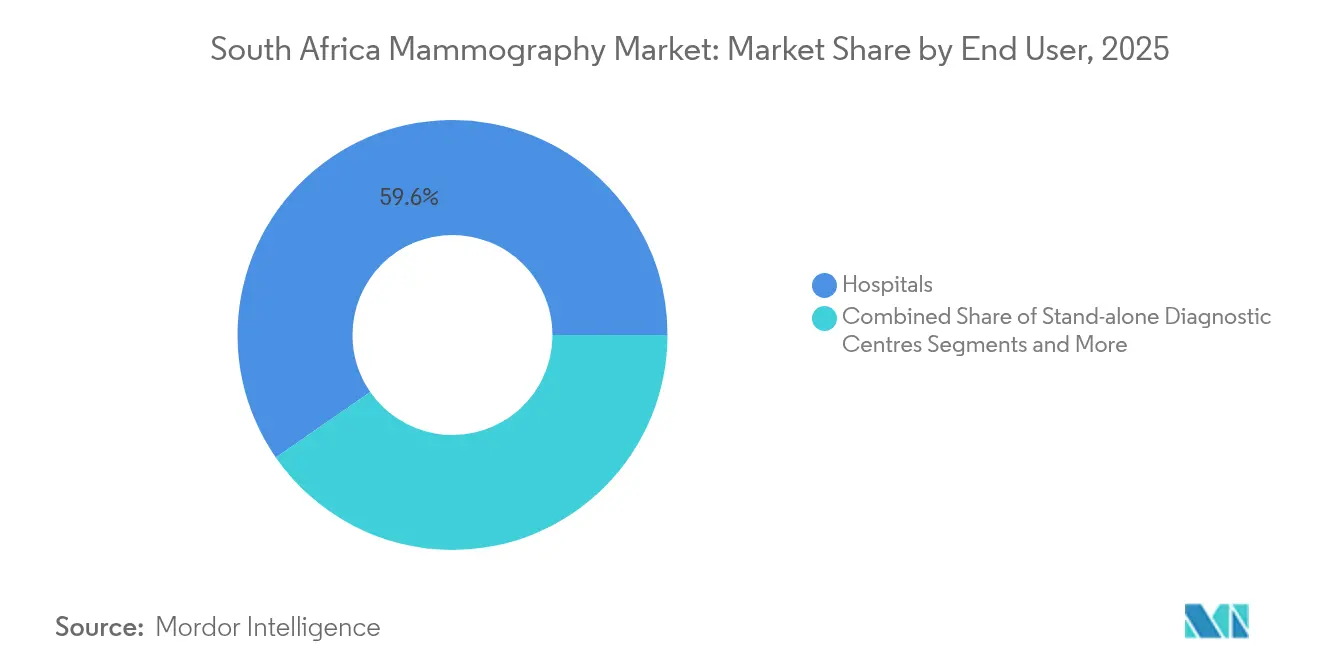
- By end user, hospitals accounted for 59.64% of the South Africa mammography market size in 2025 and mobile screening units are forecast to advance at an 8.05% CAGR to 2031.
Note: Market size and forecast figures in this report are generated using Mordor Intelligence’s proprietary estimation framework, updated with the latest available data and insights as of 2026.
South Africa Mammography Market Trends and Insights
Drivers Impact Analysis*
| Driver | (≈) % Impact on CAGR Forecast | Geographic Relevance | Impact Timeline |
|---|---|---|---|
| Rising breast-cancer incidence in SA | +1.8% | National with urban concentration | Medium term (2-4 years) |
| Government NHI roll-out expanding access | +2.1% | National early gains in Gauteng, Western Cape, KwaZulu-Natal | Long term (≥4 years) |
| Digitization and 3-D tomosynthesis upgrades | +1.5% | National prioritizing tertiary hospitals | Short term (≤2 years) |
| Mobile mammography outreach to rural provinces | +1.2% | Eastern Cape, Limpopo, Northern Cape, North West | Medium term (2-4 years) |
| AI-enabled workflow and decision support | +0.8% | Urban private networks | Short term (≤2 years) |
| Corporate ESG funding for women’s health | +0.6% | National corporate headquarters | Medium term (2-4 years) |
| Source: Mordor Intelligence | |||
Rising Breast-Cancer Incidence in SA
Incidence rates have trended upward since 2024, prompting both public and private providers to scale screening capacity beyond large urban hospitals. Increased awareness campaigns, shifting lifestyle factors, and better diagnostic reporting combine to elevate demand for equipment capable of early lesion detection. The South Africa mammography market therefore benefits from budget prioritization that treats breast imaging as a preventive necessity rather than an optional service. Urban tertiary centers responded first, yet provincial hospitals in secondary cities are now issuing purchase requisitions to match national care guidelines. Procurement urgency is expected to persist through 2030, given projections that breast-cancer prevalence will continue rising faster than other female cancers.
Government NHI Roll-Out Expanding Screening Access
The NHI Act guarantees universal coverage for breast-cancer screening, removing patient-side financial barriers that historically dampened utilization. Centralized equipment tenders bundled with five-year maintenance contracts give hospitals predictable cash-flow horizons, which supports multiyear capital planning. Provincial health departments are allocating ring-fenced funds for mobile units to meet initial rural targets, a move that further enlarges total addressable volume for system suppliers. Parallel policy emphasis on preventive care aligns seamlessly with mammography program objectives, turning the South Africa mammography market into a key beneficiary of the broader universal-health rollout.
Digitization & 3-D Tomosynthesis Upgrade Cycle
Hospitals replacing aging film units routinely select 2-D digital detectors, yet many are skipping directly to 3-D tomosynthesis because published studies confirm superior sensitivity in dense breast tissue [1]. Upgrade momentum is amplified by AI algorithms that require high-resolution digital inputs to achieve peak performance. Vendors respond by bundling analytics software with detector upgrades, creating a value proposition that blends clinical gains with workflow speed. Price premiums remain steep, though total-cost-of-ownership models show acceptable payback when reduced recall rates and shorter exam times are quantified. Replacement demand is forecast to crest between 2026 and 2028 as early adopters reach the end of their initial five-year depreciation schedules.
Mobile Mammography Outreach to Rural Provinces
Portable units bridge care gaps in sparsely populated regions, proving their worth through higher first-time-screen rates among women aged 40–54. Provincial pilots in Northern Cape and Limpopo logged participation gains of 18–22% during 2024–2025 cycles, which now serve as proof points for national scaling. Equipment specifications prioritize rugged chassis, battery backup, and satellite connectivity for cloud-based reads. Private-sector donors frequently underwrite fleet expansion as part of ESG commitments, making mobile programs one of the most reliable growth vectors for the South Africa mammography market.
AI-Enabled Workflow & Decision-Support Adoption
Diagnostic imaging departments face 18.1% radiographer vacancy rates, a shortage that pushes facilities toward software tools capable of automating routine image quality checks and preliminary reads [2]. Early pilot sites report reading-time reductions of up to 35% for screening exams when AI triage flags low-risk studies for single review. Vendors with Food and Drug Administration clearance find their algorithms welcomed by SAHPRA, provided full validation datasets accompany applications. AI readiness therefore functions as both a competitive differentiator and a capacity multiplier, reinforcing adoption intent.
Restraints Impact Analysis*
| Restraint | (≈) % Impact on CAGR Forecast | Geographic Relevance | Impact Timeline |
|---|---|---|---|
| Radiation-dose and over-diagnosis concerns | −0.9% | National influenced by global guidelines | Medium term (2-4 years) |
| High capex and limited reimbursements | −1.4% | National public-sector focus | Long term (≥4 years) |
| Shortage of radiographers and medical physicists | −1.1% | National acute in rural zones | Long term (≥4 years) |
| SAHPRA device-approval backlog | −0.7% | National regulatory framework | Short term (≤2 years) |
| Source: Mordor Intelligence | |||
Radiation-Dose & Over-Diagnosis Concerns
Clinicians remain cautious about screening younger low-risk populations because longitudinal studies question net mortality gains when false positives trigger unnecessary biopsies. Health-technology-assessment panels periodically revisit recommended screening intervals, which can temporarily suppress exam volumes. Vendor responses include lower-dose detector materials and AI-assisted lesion scoring meant to cut false positives. These mitigations ease but do not fully eliminate risk-benefit debates, so a modest drag on unit sales persists.
High Capex & Limited Reimbursements
Premium tomosynthesis systems cost up to 1.7 times more than conventional 2-D platforms, stretching hospital budgets operating on fixed-price diagnostic codes. Public hospitals often rely on multiyear Treasury allocations, which introduces procurement lags that defer volume realization. Private insurers reimburse screening at fee schedules that do not yet differentiate for 3-D value, dampening return-on-investment calculations for smaller clinics. Vendor financing and operating-lease structures partly offset up-front cost barriers but cannot fully resolve payback apprehensions.
*Our forecasts treat driver/restraint impacts as directional, not additive. The impact forecasts reflect baseline growth, mix effects, and variable interactions.
Segment Analysis
By Product Type: Digital Systems Lead the Tomosynthesis Surge
Digital systems anchored 52.72% of total revenue in 2025 as most urban hospitals completed film-to-digital conversions. That dominance is projected to hold through 2031, supported by service contracts that bundle detector calibrations and AI software updates. Breast tomosynthesis recorded the fastest trajectory with a 7.86% CAGR and its share is forecast to approach one-quarter of the South Africa mammography market by decade’s end. Analog units now sell mainly to budget-constrained community clinics and are expected to phase out of tenders after 2027. The segment mix reflects a preference for image quality gains that instantly improve cancer-detection metrics without necessitating parallel infrastructure overhauls. Tomosynthesis popularity also benefits from patient satisfaction scores related to reduced callbacks. Vendors providing hybrid configurations capable of both 2-D and synthesized 3-D images enhance asset utilization for providers juggling mixed-insurance populations. Clinical validation continues to affirm dense-breast advantages, a salient factor given ethnic diversity in South African breast-density profiles .
Healthcare administrators increasingly reference internal audits showing 40% fewer false positives once tomosynthesis displaces legacy 2-D units. That performance has a direct financial impact because public hospitals carry the downstream cost of unnecessary biopsies. Consequently, the South Africa mammography market registers steady upgrades even when capital budgets are restricted. Some facilities adopt a phased replacement, placing tomosynthesis in high-volume centers first and allocating trickle-down digital units to peripheral clinics. Overall, digital products are entrenched as the platform of choice, while tomosynthesis provides the premium upsell path that manufacturers rely on for margin expansion.

By Technology: 3-D Tomosynthesis Disrupts 2-D Dominance
Full-field 2-D digital mammography secured 47.65% share in 2025, reflecting early adoption advantages and lower price points. Nonetheless 3-D tomosynthesis posted a 7.38% CAGR and is forecast to capture an incremental 14 percentage-point share by 2031. Demand is catalyzed by studies that link 3-D modalities to 27% higher invasive cancer detection rates relative to 2-D scans. Providers weigh these performance metrics against higher acquisition and maintenance costs. Early adopters often finance upgrades through public-private partnership grants or donor contributions, circumventing capex ceilings. The South Africa mammography market size attributed to tomosynthesis is expected to surpass USD 10.84 million by 2031, marking a strategic inflection point where 3-D systems shift from premium option to de facto standard.
Emerging niche technologies such as contrast-enhanced mammography populate the “Others” category and target diagnostic work-ups rather than routine screening. Market penetration for these modalities remains below 4% yet offers upside once reimbursement codes mature. AI overlays run seamlessly on both 2-D and 3-D datasets, though algorithm performance metrics rise when fed multi-plane images. Hospitals therefore perceive 3-D compatibility as essential for future-proofing. As SAHPRA accelerates clearance of synthesized 2-D solutions that cut additional exposures, dose-related objections are expected to recede, giving tomosynthesis an even firmer foothold.
By End User: Hospitals Dominate While Mobile Units Accelerate
Hospitals owned 59.64% of installed systems in 2025, leveraging centralized radiology departments and cross-specialty referral networks to maintain patient throughput. These institutions benefit from economies of scale in service contracts and training programs. Stand-alone diagnostic centers comprise a mid-tier segment that attracts cash-pay patients seeking short wait times. Although their aggregate share sits near 25%, expansion has moderated as insurance contracts funnel more volume into integrated hospital pathways.
Mobile screening units represent the most dynamic subsector with an 8.05% CAGR fueled by NHI mandates to reach underserved populations. Transport-grade chassis equipped with onboard generators enable daily clinic rotations across villages lacking electricity access. Early pilots show detection-stage migration toward stage I diagnoses, supplying hard evidence for cost-effectiveness claims. Equipment suppliers that pair rugged hardware with cloud-based image archiving gain a competitive edge because mobile setups rely heavily on teleradiology reads. Consequently, the South Africa mammography market sees diversified revenue streams where hospital renewals guarantee base volume and mobile fleets drive incremental growth.
Geography Analysis
Gauteng alone hosts nearly one-third of active units, buoyed by Johannesburg’s cluster of tertiary hospitals and private oncology centers. Western Cape follows with Cape Town-based academic hospitals that often act as pilot sites for 3-D tomosynthesis studies. KwaZulu-Natal ranks third and benefits from a provincial cancer-registry initiative that allocates dedicated screening budgets. Collectively these provinces anchor core demand for high-specification systems and advanced AI modules.
Eastern Cape, Limpopo, Northern Cape, and North West provinces experienced a double-digit rise in mobile unit deployments during 2024–2025 cycles. Rural geography and dispersed population densities make fixed-site clinics less feasible, so provincial departments emphasize mobile fleets to meet NHI coverage ratios. The South Africa mammography market size allocated to rural mobile programs is small in absolute dollars yet shows the highest forward CAGR, indicating sustained vendor interest despite lower margins.
Inter-provincial procurement schemes are moving toward pooled tenders that stipulate common service-level agreements, aiming to standardize uptime metrics across the national grid. Vendors with province-wide service depots and bilingual training teams score higher on tender evaluations. Geography thus shapes competitive dynamics as keenly as technology specifications, driving manufacturers to invest in logistics hubs beyond major metros.
Regulatory Landscape
Mammography devices and other radiation-emitting diagnostic imaging equipment are regulated in South Africa primarily through SAHPRA, under the Medicines and Related Substances Act, 101 of 1965, and the Hazardous Substances Act, 15 of 1973. Establishments that manufacture, import, export, or distribute mammography systems must hold a SAHPRA medical device establishment license (per SAHPGL-MD-06 v3, 2023), and devices are processed under SAHPRA risk classification rules (Classes A to D), which enable reliance pathways for higher-risk device registration (updated in SAHPGL-MD-04 v5, March 2025).
Operational compliance is closely tied to radiation safety and quality assurance. SAHPRA guidance for users of medical X-ray equipment and its diagnostic X-ray QC guideline (SAHPGL-RDN-XR-01, 2022) shapes acceptance and routine QC expectations, with acceptance testing carried out by SAHPRA-approved, SANAS-accredited inspection bodies. For digital mammography, QC aligns to recognized breast screening quality assurance frameworks (including European QA guidance referenced in local QC requirements), and exams are performed by appropriately trained radiographers, including recognized postgraduate mammography qualification requirements noted in national practice expectations.
Value Chain Analysis
South Africa's mammography value chain is led by imported systems and components, reflecting the broader medical device ecosystem where over 90% of devices are imported. Original equipment manufacturers typically access the market through SAHPRA-licensed local establishments (importers, distributors, and wholesalers) that keep structured communication with the OEM for technical documentation, vigilance reporting, spare parts, and software updates, which is important for QC compliance and for maintaining uptime under service-level commitments.
Demand downstream is driven by public and private procurement and by the ability to deliver installation, commissioning, training, and maintenance nationally. Provincial health department tenders, including bid-based procurement for mammogram units, often bundle supply with commissioning and multi-year maintenance, so local field-service coverage and access to accredited QC and inspection support are central to winning and retaining accounts. The 2024 South African Medical Devices Masterplan workstream highlights localization and refurbishment capability as strategic priorities to reduce import dependence, creating room for local assembly, detector refurbishment, and service depots that can shorten parts lead times and lower lifecycle costs for hospitals and mobile operators.
Competitive Landscape
The market hosts a mix of global imaging majors, mid-sized European manufacturers, and locally anchored distributors. Top vendors collectively account for less than 60% of installed base, signifying moderate concentration. Global players leverage broad product portfolios and existing CT or MRI footprints to cross-sell mammography units. Their advantage lies in established SAHPRA dossiers and in-country engineering teams capable of 24-hour response.
Mid-tier firms differentiate on price and service flexibility, often bundling extended warranties and remote-diagnostic dashboards. These suppliers win share in tenders where total-cost-of-ownership scoring outweighs brand prestige. Local distributors add value via import-duty optimization and rapid parts sourcing, especially in provinces distant from Johannesburg customs depots.
Competitive intensity is shifting toward AI partnerships. Vendors embedding FDA-cleared algorithms earn RFP bonus points for workflow efficiency. For example, one leading supplier bundled a triage algorithm that reduced radiologist read time by one-third at a Durban pilot site, a result now referenced in multiple public-sector tenders. Protection of intellectual property and robust cybersecurity protocols have therefore become principal differentiators alongside detector sensitivity.
South Africa Mammography Industry Leaders
-
Siemens AG
-
GE Healthcare
-
Fujifilm Holdings Corporation
-
Hologic Inc.
-
Planmed OY
- *Disclaimer: Major Players sorted in no particular order
Market Opportunities and Future Outlook
A key whitespace is expanding screening reach beyond major metros while fitting the way the public system prioritizes breast imaging. South Africa's Breast Cancer Policy (2017) emphasizes resource-aware pathways that focus public sector screening on symptomatic patients and higher-risk individuals at specialist breast units, which sustains demand for diagnostic-capable mammography configurations, dependable QC, and rapid turnaround workflows in referral hubs. At the same time, mobile mammography programs have shown scalable outreach in the field, with approximately 7,000 women screened over the past two years through workplace and community deployments, reinforcing the case for ruggedized mobile systems, teleradiology connectivity, and service models built for distributed operations.
Procurement-led opportunities are also centered on provincial department purchasing and service contracts that cover supply, delivery, installation, commissioning, and maintenance of mammogram units. Vendors and partners that can package full lifecycle support, with documentation that aligns to SAHPRA oversight, tend to fit these requirements. In parallel, the 2024 medical devices masterplan direction on localization points to opportunities in-country for refurbishment, parts stocking, and limited local manufacturing or assembly, which can reduce lead times and total cost of ownership for fleets and public hospitals operating under fixed budgets and uptime targets.
Recent Industry Developments
- March 2026: Siemens Healthineers partnered with Movement Health Foundation to pilot a digital platform for navigating cervical cancer screening. The initiative advances digital screening infrastructure in South Africa and strengthens workflow efficiency for clinical teams.
- January 2025: Radhiant Diagnostic Imaging SA Inc. launched the country’s first fully mobile mammography service. This expansion broadens access to screening in underserved regions and may influence tender dynamics in public and private sectors.
- July 2024: Rio Tinto/Richards Bay Minerals with PinkDrive delivered two week breast cancer screening campaigns in KwaZulu-Natal and Eastern Cape. The initiative demonstrates NGO led expansion of screening programs that supplement public sector capacity.
Research Methodology Framework and Report Scope
Market Definition and Coverage
This market covers revenue generated in South Africa from mammography systems and related installations used for breast screening and diagnostic imaging, across healthcare providers that purchase, operate, and maintain these systems in routine clinical use.
Scope exclusions: We exclude broader breast imaging modalities (such as ultrasound or MRI), general radiology consumables, and treatment services that sit outside mammography equipment and its direct system-level revenue.
Segmentation Overview
- By Product Type
- Digital Systems
- Analog Systems
- Breast Tomosynthesis
- Others
- By Technology
- 2-D Full-Field Digital Mammography
- 3-D Digital Breast Tomosynthesis
- Others
- By End User
- Hospitals
- Stand-alone Diagnostic Centres
- Mobile Screening Units
Data Sources, Market Sizing, and Validation
Desk Research
Desk research was used to frame the demand pool and the buying environment for mammography in South Africa, so the model stays grounded in what providers can actually install and operate. We reviewed public health statistics and screening context from sources such as the World Health Organization, the National Department of Health, Statistics South Africa, and the International Agency for Research on Cancer (GLOBOCAN), followed by local context from peer-reviewed clinical journals and radiology society publications.
For supply and pricing, we relied on manufacturer product literature, public tenders and contract notices, importer and trade disclosures where available, and audited company filings and investor presentations that explain order mix and regional priorities. A paid subscription covering company financials and intelligence was used selectively to cross-check entity structures and reporting currency. We also consulted a patent database to understand the pace of technology updates that can affect replacement cycles. The public and secondary sources listed above are illustrative, and we also referred to many other documents and datasets to collect data, validate assumptions, and clarify gaps.
Primary Interviews and Surveys
Primary interviews and surveys helped us test what we saw in public sources, especially around replacement timing, service coverage, and the real share of analog versus digital usage in different care settings. We spoke with a mix of hospital procurement teams, diagnostic center operators, clinical stakeholders, and service partners across South Africa, so assumptions on pricing, utilization, and tender behavior could be adjusted to what is happening in the field.
Distribution of primary research fieldwork respondents
| Company type | Respondent position |
|---|---|
| Top tier: 39% | CXOs: 12% |
| Mid tier: 47% | Functional/Unit leaders: 36% |
| Smaller Players: 14% | Managers: 52% |
Market-Sizing & Forecasting
For sizing, we first rebuilt the addressable demand using a top-down approach that starts from the breast imaging and screening need, and then narrows it to the equipment and upgrade spend that is feasible within South Africa. Those totals were then checked with selective bottom-up approximations, such as sampled system counts by site type, typical replacement cycles, and indicative ASP bands by technology, and then adjusted when interview feedback showed a mismatch.
Key model inputs included the installed base direction (analog-to-digital replacement), adoption of 3-D tomosynthesis for higher sensitivity, typical equipment life and refurbishment patterns, the mix of buying entities (hospitals, stand-alone diagnostic centers, and mobile screening units), and procurement behavior linked to public tender cycles and financing choices. Since pricing moves with exchange rates and configuration choices, we used scenario analysis around ASP progression and upgrade timing, and then aligned the final forecast path to consensus ranges shared by local experts. Where site-level counts were incomplete, gaps were handled by using conservative penetration ranges and then cross-checking against service coverage and utilization signals discussed in interviews.
Data Validation & Update Cycle
Validation was done through multiple checks so outputs do not rely on any one data stream. We compared the modeled totals against independent signals, such as known procurement activity, installed base direction, and reported technology shift in clinical practice, and then flagged outliers for a second analyst review before sign-off.
If material variances showed up, follow-up calls were triggered to recheck pricing, replacement timing, or the assumed mix of 2-D versus 3-D systems. Reports are refreshed annually, with interim updates when meaningful policy, currency, or tender events change near-term assumptions. Before delivery, the model is re-opened for a final pass so clients receive the most current view that can be supported by traceable inputs.
Mordor Intelligence's South Africa Mammography Market Size Compared Against Other Published Estimates
Published market values for mammography in South Africa can look different because groups choose different year cutoffs, convert currency at different points in time, and sometimes treat upgrades and service components as either part of equipment revenue or as separate lines. We also see differences when one estimate emphasizes screening expansion, while another leans more on near-term procurement timing.
When exchange rates moved during the year, the model used a consistent base-year currency timing and then stress-tested ASP bands for 2-D and 3-D system configurations through follow-up checks with local buyers and service-side experts, which is one reason the final total differs in Mordor Intelligence.
Benchmark comparison
| Source | Market Size | Gaps in Research Methodology |
|---|---|---|
| Mordor Intelligence | USD 25.87 M (2025) | |
| Trade Journal A | USD 30.00 M (2023) | Uses a different base year and appears to represent a broader device value view, where refurbished systems and service-led bundles can be counted alongside new system revenue, which lifts the headline value. |
| Industry Data Publisher B | USD 6.12 M (2023) | Likely applies a narrower scope focused on a limited set of system shipments and a conservative ASP assumption, which can understate replacement-driven spend in established hospital and diagnostic center fleets. |
The spread in the table is mainly explained by what gets counted as equipment revenue versus adjacent service or refurbishment value, and by how the base year price level is translated into USD. By keeping the model steps tied to observable buying signals, and then rechecking them with local interviews, we aimed to produce a practical number that can be repeated and updated when procurement or pricing conditions change.
Key Questions Answered in the Report
How big is the South Africa Mammography Market?
The South Africa Mammography Market size is expected to reach USD 27.67 million in 2026 and grow at a CAGR of 6.94% to reach USD 38.7 million by 2031.
Which product segment is expanding the quickest?
Breast tomosynthesis systems are advancing at a 7.86% CAGR, making them the fastest-growing product category.
Who are the key players in South Africa Mammography Market?
Siemens AG, GE Healthcare, Fujifilm Holdings Corporation, Hologic Inc. and Planmed OY are the major companies operating in the South Africa Mammography Market.
Why are mobile screening units important?
Mobile units extend breast-cancer screening to rural provinces where fixed facilities are scarce, and they are forecast to grow at an 8.05% CAGR.