
Market Overview
| Study Period | 2020 - 2031 |
|---|---|
| Forecast Data Period | 2026 - 2031 |
| Base Year Market Size (2025) | USD 1.37 Billion |
| Market Size (2026) | USD 1.43 Billion |
| Market Size (2031) | USD 1.77 Billion |
| Growth Rate (2026 - 2031) | 4.39 % |
| Market Concentration | Medium |
Major Players *Disclaimer: Major Players sorted in no particular order Image © Mordor Intelligence. Reuse requires attribution under CC BY 4.0. | |
South Africa Magnetic Resonance Imaging Market Analysis by Mordor Intelligence
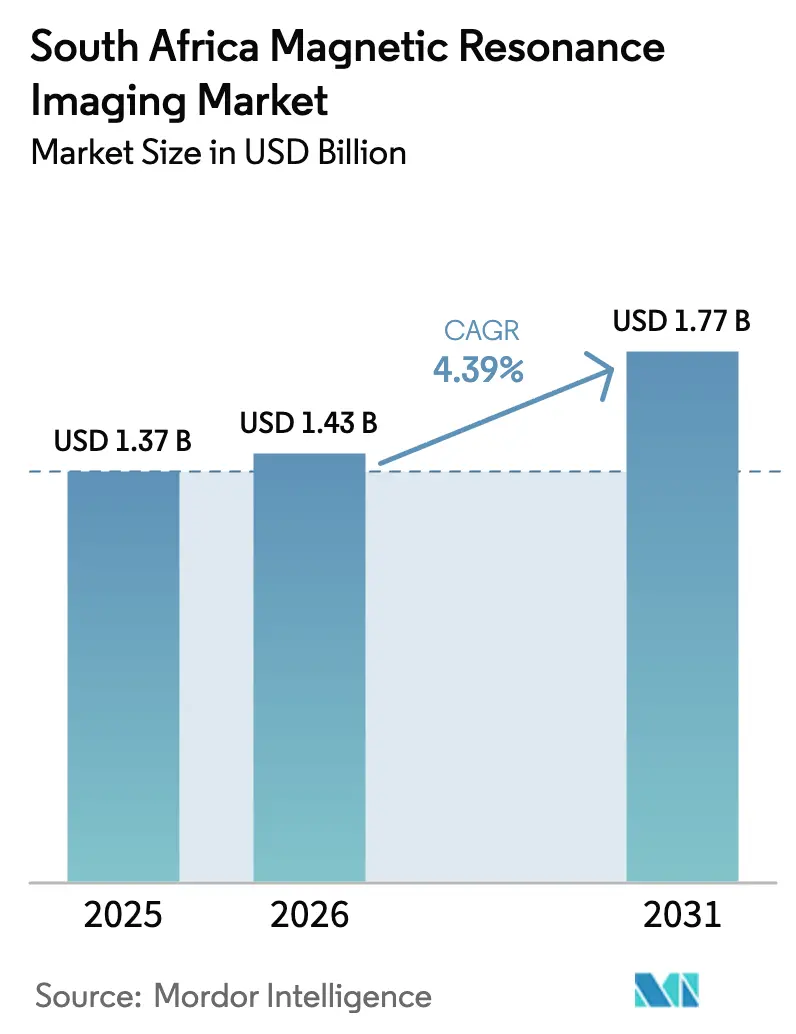
The South Africa magnetic resonance imaging market size was valued at USD 1.37 billion in 2025 and estimated to grow from USD 1.43 billion in 2026 to reach USD 1.77 billion by 2031, at a CAGR of 4.39% during the forecast period (2026-2031). Rising chronic disease prevalence, expanding private insurance coverage, and government commitment to diagnostic infrastructure combine to lift scan volumes in both urban and peri-urban centers. Technological breakthroughs—helium-free magnets, AI-assisted workflow, and low-field accessibility platforms—are lowering total cost of ownership and broadening use cases, particularly in constrained public facilities. Simultaneously, vendor financing and public-private partnership models are accelerating equipment refresh cycles across provincial health systems. Load-shedding risks and a limited radiologist workforce temper near-term growth yet create a strategic impetus for AI adoption and remote reading networks.
Key Report Takeaways
- By architecture, Closed MRI systems led with 54.02% of the South Africa magnetic resonance imaging market share in 2025. Open MRI systems are forecast to expand at a 6.36% CAGR through 2031.
- By field strength, Mid/High-Field 1.5 T commanded 39.10% share of the South Africa magnetic resonance imaging market size in 2025. Low-Field systems (≤0.55 T) are projected to grow at a 5.62% CAGR between 2026-2031.
- By application, Neurology captured 29.02% share of the South Africa magnetic resonance imaging market size in 2025. Cardiology is advancing at a 5.31% CAGR to 2031.
Note: Market size and forecast figures in this report are generated using Mordor Intelligence’s proprietary estimation framework, updated with the latest available data and insights as of 2026.
South Africa Magnetic Resonance Imaging Market Trends and Insights
Drivers Impact Analysis*
| Driver | (~) % Impact on CAGR Forecast | Geographic Relevance | Impact Timeline |
|---|---|---|---|
| Increasing prevalence of chronic diseases | +1.20% | Gauteng, Western Cape, KwaZulu-Natal | Medium term (2-4 years) |
| Technological advancements in MRI hardware and software | +0.80% | Private facilities nationwide | Short term (≤ 2 years) |
| Government imaging-infrastructure investments | +0.70% | Underserved provinces nationwide | Long term (≥ 4 years) |
| Rising private health-insurance coverage | +0.60% | Urban middle-income segments | Medium term (2-4 years) |
| Public-private partnership procurement models | +0.40% | Western Cape, Gauteng | Medium term (2-4 years) |
| Local manufacturing tax incentives | +0.30% | National | Long term (≥ 4 years) |
| Source: Mordor Intelligence | |||
Increasing Prevalence of Chronic Diseases
Non-communicable conditions now dominate South Africa’s disease burden, prompting a surge in demand for high-resolution imaging of stroke, cancer, and diabetes complications. Provincial budgets reflect this priority: Gauteng allocated ZAR 61.3 billion, KwaZulu-Natal ZAR 52.1 billion, and Western Cape ZAR 30.2 billion in FY 2022/23, much of which funded diagnostic capacity upgrades[1]. Urban lifestyle shifts accelerate cardiovascular and oncological caseloads, pushing scan volumes in neurology and cardiology. The Department of Health’s Medical Technology Master Plan explicitly tags MRI as essential to tackle this epidemiological transition. Private hospitals mirror this trend, with Life Healthcare reporting 90% growth in Neuraceq doses that rely on MRI-guided protocols.
Growing Technological Advancements in MRI Hardware & Software
Helium-free magnets, AI-embedded consoles, and portable low-field units are reshaping procurement decisions. Philips BlueSeal systems cut helium use from 1,500 L to 0.7 L, easing operating cost anxiety among hospitals faced with erratic supply chains. United Imaging’s October 2024 installation of a 1.5 T scanner at Dr George Mukhari Academic Hospital showcases appetite for new vendors offering competitive pricing[2]. AI workflow modules promise shorter exams and preliminary reads, vital in a country with only 700 radiologists nationwide. Despite zero daily AI usage today, 95% of radiologists hold favorable adoption views, indicating pent-up demand once reimbursement and clinical governance align.
Government Imaging-Infrastructure Investments
National Health Insurance roll-out earmarks ZAR 77.8 billion for 197 facility projects over five years, positioning MRI procurement as a universal health coverage cornerstone. Yet execution gaps persist—Gauteng reports four of eight scanners out of service, forcing 607-patient backlogs at Chris Hani Baragwanath Hospital. Corrective actions include comprehensive service clauses in new tenders, such as Western Cape’s 3 T MRI with chiller and injector for Red Cross Children’s Hospital[3]. These purchases elevate imaging equity, especially as the province’s public sector operates just 0.59 scanners per million residents versus OECD norms above three.
Rising Private Health-Insurance Coverage
Medical scheme membership confers immediate MRI access, circumventing nine-month public-queue delays. Insurance growth encourages premium scan protocols and AI add-ons, motivating private groups to expand footprints. Mediclinic’s Diagnostic Imaging arm opened eight facilities within 18 months, capitalizing on insured demand for convenient outpatient imaging. Life Healthcare’s focus on molecular-imaging services, enabled by payer coverage, underscores how insurance catalyzes technology adoption beyond urban hubs.
Restraints Impact Analysis*
| Restraint | (~) % Impact on CAGR Forecast | Geographic Relevance | Impact Timeline |
|---|---|---|---|
| High cost of equipment and maintenance | -1.10% | Rural and public facilities nationwide | Long term (≥ 4 years) |
| Lack of reimbursement and lengthy regulatory approvals | -0.70% | Public procurement nationwide | Medium term (2-4 years) |
| Electricity-supply instability | -0.60% | Load-shedding zones countrywide | Short term (≤ 2 years) |
| Shortage of subspecialty radiologists | -0.50% | Rural provinces | Long term (≥ 4 years) |
| Source: Mordor Intelligence | |||
High Cost of Equipment & Maintenance
MRI acquisition often requires 30-40% extra capital for shielding, HVAC, and backup power, stretching budgets of provincial hospitals that already run aging fleets. Western Cape’s public network runs only three scanners for six-million residents, showcasing affordability barriers. In Gauteng, half the provincial inventory sits idle due to lapsed maintenance contracts and spare-part shortages. SAHPRA device licensing further adds cost and time, slowing replacements even when funds are available.
Shortage of Subspecialty Radiologists
With about 700 radiologists countrywide, interpretive capacity is the hidden bottleneck. Distribution skews sharply: Western Cape has 19.9 radiologists per 100k population versus Limpopo’s 1.3. Subspecialty depth in cardiac and neuro imaging is thinner still, curbing advanced protocol uptake. Favorable attitudes toward AI—95% positivity—have yet to translate into daily use, signaling opportunity for workflow automation vendors. Private groups are investing in teleradiology platforms to pool scarce expertise across sites, but public-sector roll-out lags behind due to connectivity and credentialing hurdles.
*Our forecasts treat driver/restraint impacts as directional, not additive. The impact forecasts reflect baseline growth, mix effects, and variable interactions.
Segment Analysis
By Architecture: Closed Dominance With Open-System Upside
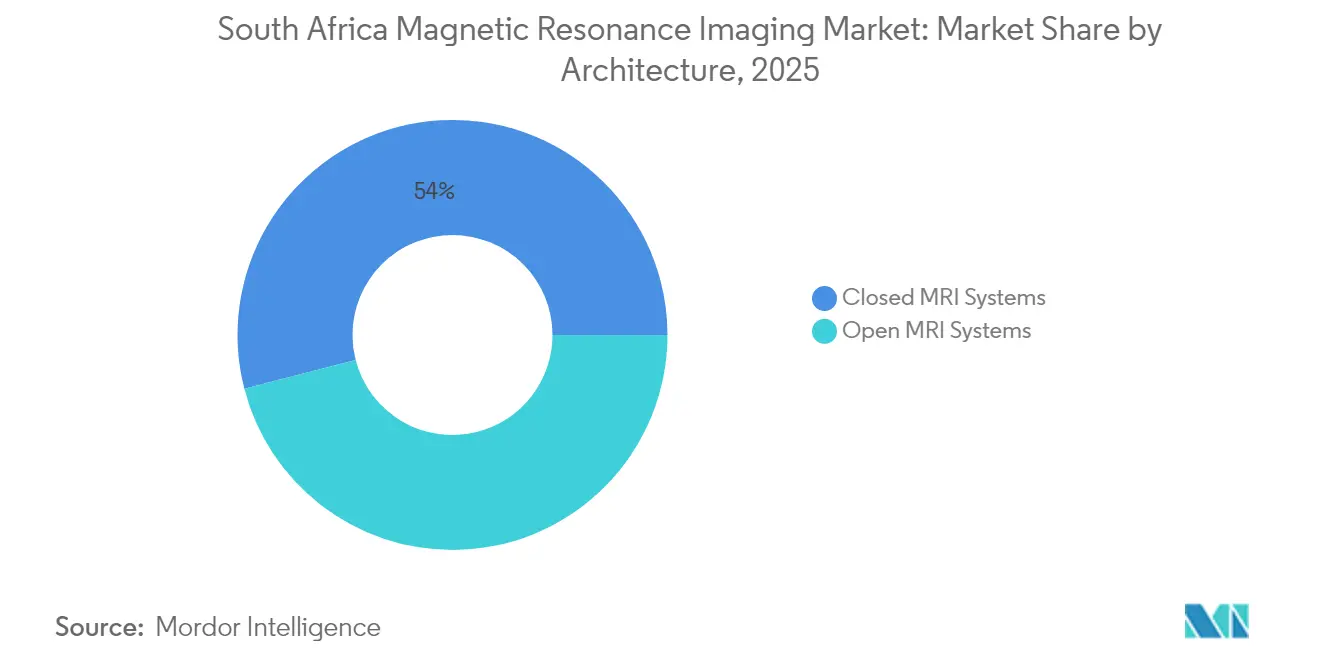
Closed scanners represented USD 0.74 billion of the South Africa magnetic resonance imaging market size in 2025, equating to 54.02% share and anchoring complex neuro-oncology workloads that require high gradient performance. Private tertiary centers lean on closed systems to drive multidisciplinary care pathways, linking MR spectroscopy and functional imaging to surgical planning. Nonetheless, Open MRI systems, smaller at USD 0.63 billion but rising 6.36% CAGR, are carving out niches in pediatrics, bariatric cohorts, and claustrophobic patients.
Open designs also solve floor-loading and room-size constraints in older facilities, easing rural deployment where capital builds are restrictive. Mediclinic selected open magnets for two outpatient clinics launched under its MDI banner, citing shorter install times and patient comfort advantages. As AI guidance removes some image-quality penalties, open platforms are expected to shoulder a growing share of routine musculoskeletal scans, expanding total South Africa magnetic resonance imaging market volume without cannibalizing high-end closed demand.

By Field Strength: Low-Field Renaissance
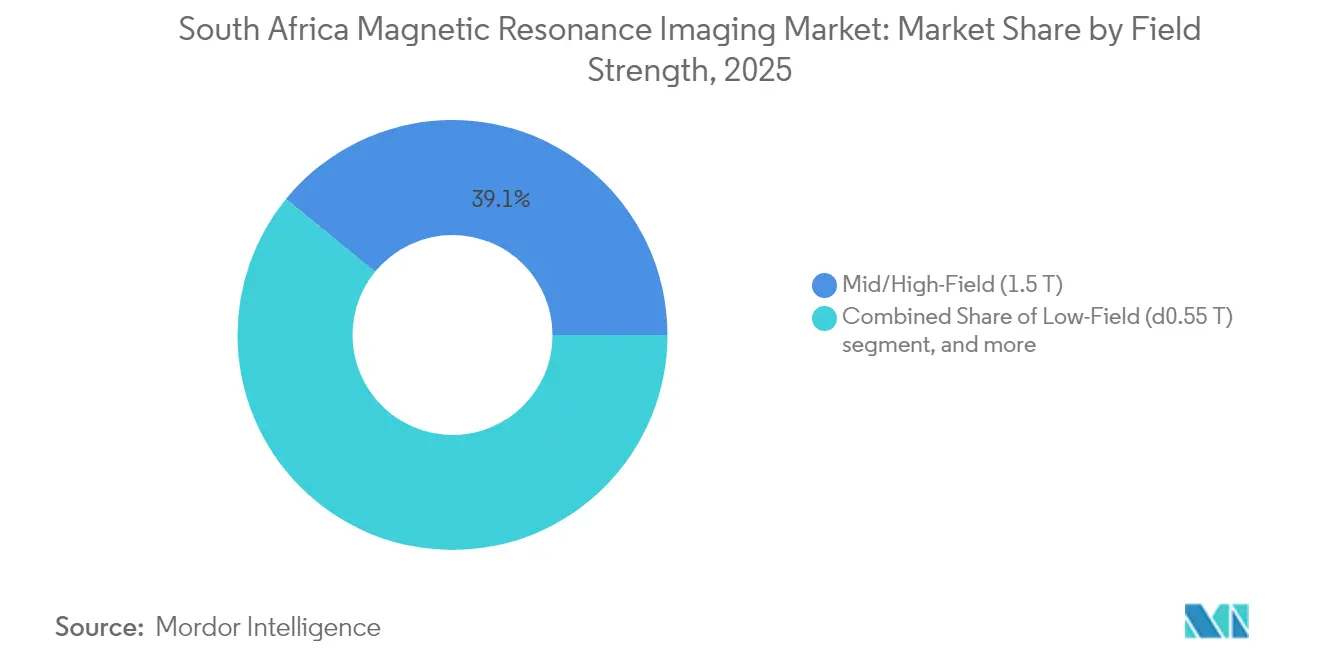
Mid/High-Field 1.5 T units held 39.10% of the South Africa magnetic resonance imaging market share in 2025, valued at USD 0.54 billion, as they balance image clarity against operating cost. Ultra-High-Field 3 T systems dominate academic neurology and cardiac research but add limited volume. Rapid uptake is instead seen in ≤0.55 T low-field units, expanding 5.62% CAGR, favored by community hospitals seeking lower power draw and less stringent siting requirements in load-shedding-prone districts.
United Imaging’s mid-field installation at Dr George Mukhari Academic Hospital exemplifies a hybrid demand curve—cost-sensitive buyers still insist on 1.5 T fidelity, yet require vendor-bundled service to avoid downtime. Low-field vendors target another segment: mobile imaging fleets deployed through public-private partnerships that rotate scanners among rural clinics. This re-energizes previously stagnant geographic nodes, widening the South Africa magnetic resonance imaging market size without stressing specialist headcount, as basic brain and MSK scans can be batch-read centrally.
By Application: Cardiology Momentum
Neurology retained 29.02% of scans and roughly USD 0.40 billion revenue in the South Africa magnetic resonance imaging market size during 2025 thanks to stroke protocols endorsed by national guidelines. Volume includes epilepsy surgery planning and multiple-sclerosis surveillance. Yet cardiology exams are stretching ahead on growth, adding 5.31% CAGR through 2031 as hypertension and ischemic heart disease rise in younger demographics. AI-based cardiac strain analysis and faster cine sequences shorten exam time, creating throughput gains crucial where scanner slots are scarce.
Oncology scans underpin high-margin contrast usage, while musculoskeletal imaging supports trauma centers and sports medicine practices common in urban private hospitals. Gastrointestinal and hepatobiliary protocols remain niche but benefit from low-field abdominal sequences that tolerate motion artifacts, expanding overall utilization across facility tiers.
Regulatory Landscape
MRI equipment in South Africa is regulated by SAHPRA under the Medicines and Related Substances Act, with installation and operation requiring a medical device establishment license. MRI hardware is classified as a Group III electronic product under the Hazardous Substances Act 15 of 1973, shaping documentation, handling, and governance requirements for replacements and upgrades.
SAHPRA supports reliance pathways that can leverage verification by regulators in the US, EU, Australia, Canada, Japan, or WHO pre-qualification to streamline registration and local representation. The 2026 SAHPGL-RDN-NM-06 guideline anchors installation, licensing, and ongoing compliance within SAHPRA's medical devices framework, and ISO 13485 evidence is required for license renewals.
Value Chain Analysis
The MRI value chain in South Africa remains heavily import-reliant, with global OEMs such as Siemens Healthineers, Philips, GE HealthCare, and Canon Medical supplying systems and software through local distributors and service partners. These partners provide installation, frontline maintenance, and B-BBEE-compliant tender participation. The import dependency increases exposure to FX movements, shipping lead times, and parts availability, so bundled service levels and local spares become a key uptime differentiator.
Procurement flows through two channels: decentralized public procurement across nine provincial tender systems governed by the Preferential Procurement Policy Framework Act, and centralized private procurement led by Netcare, Mediclinic, and Life Healthcare, which collectively dominate private imaging capacity. Downstream value creation focuses on site readiness (shielding, HVAC, power backup), radiographer training, service engineering, and clinical reporting, while workflow automation and remote support gain traction amid subspecialist radiologist shortages and load-shedding downtime.
Competitive Landscape
Global majors Siemens Healthineers, Philips, and GE Healthcare maintain entrenched relationships with flagship private hospitals, leveraging multiyear service contracts that bundle coil upgrades and software unlocks. Their combined installed base surpasses 60 active units, giving them scale for parts logistics and engineer redeployment. Yet price-sensitive public tenders are increasingly contested by United Imaging and Canon Medical, whose turnkey packages include operator training and three-year service at no extra premium, winning awards such as the Dr George Mukhari installation in October 2024.
Strategic differentiation centers on helium-free cooling, AI post-processing, and remote diagnostics. Philips’s BlueSeal gains mindshare among CFOs fixated on volatile helium import costs, while Siemens’s syngo VirtualCockpit answers the radiologist scarcity dilemma by enabling remote scanner steering. Local distributors add value via B-BBEE compliance and on-site response times under four hours, a critical tender criterion. Market fragmentation persists; the top five vendors collectively hold around 55-60% of active units, leaving meaningful runway for challenger brands that can undercut on price without sacrificing uptime guarantees.
Private hospital groups form the heaviest-weighted buyer bloc. Netcare’s ZAR 1.5 billion capex for FY 2024 earmarks multiple high-field replacements and new sites, reinforcing vendor lock-in yet establishing technology showcases such as AI cardiac workflows at the Kingsway facility. Life Healthcare’s divestiture of Alliance Medical for ZAR 10.2 billion frees balance-sheet capacity to redeploy into domestic imaging, while Mediclinic’s MDI sprint evidences demand for mall-based walk-in centers that decouple scans from inpatient episodes.
South Africa Magnetic Resonance Imaging Industry Leaders
-
Siemens Healthineers AG
-
Koninklijke Philips NV
-
Canon Medical Systems Corporation
-
GE Healthcare
-
Esaote SpA
- *Disclaimer: Major Players sorted in no particular order

Market Opportunities and Future Outlook
Diagnostic imaging market size is USD 387.6 million in 2026. Life Healthcare and GE HealthCare launched digital PET-CT scanning in Cape Town in March 2026, and expanding the PET-CT network into KwaZulu-Natal is an active late-2026 project. Life Healthcare outlined a capital expenditure plan for FY2025 covering imaging and theatre expansion, which signals continued capacity upgrades across both private and public segments and supports ongoing MRI demand.
Public-private partnerships and vendor financing models are accelerating MRI refresh cycles across provincial health systems. At the same time, procurement decisions increasingly reflect helium-free magnets, AI-assisted workflow, and low-field platforms, aligning capacity expansion with diagnostic infrastructure funding and a stronger push toward integrated imaging networks for service resilience in the near term.
Recent Industry Developments
- May 2026: Koninklijke Philips NV: Regional leadership confirmed active negotiations for helium-free, sealed-magnet MRI technology in South Africa. The move emphasizes cost and uptime considerations while expanding access to advanced imaging in SA. This supports broader access and cost containment in SA diagnostic imaging portfolio.
- May 2026: GE Healthcare: GE Healthcare unveiled a new suite of software development and collaboration tools for MR research at ISMRM 2026 in Cape Town. The rollout expands the MR software ecosystem and supports remote collaboration across SA research networks. It strengthens GE’s position in SA MR workflow optimization and research integration.
- March 2026: Gauteng Department of Health: Completed the handover of two new MRI machines at Steve Biko Academic Hospital for urgent and elective oncology and paediatric imaging. This expands public sector MRI capacity in a high-need market segment. It increases public hospital MRI stock, influencing tender dynamics and equipment refresh cycles.
Research Methodology Framework and Report Scope
Market Definition and Coverage
For this study, the market covers revenue linked to MRI systems used in South Africa for clinical imaging, including system sales and the typical configuration value tied to installation and commissioning at the point of purchase.
Scope exclusions: We exclude standalone contrast agents, general radiology IT software sold separately, and routine service contracts that are priced and renewed independent of the scanner purchase.
Segmentation Overview
- By Architecture
- Closed MRI Systems
- Open MRI Systems
- By Field Strength
- Low-Field (≤0.55 T)
- Mid/High-Field (1.5 T)
- Very-High-Field (3 T)
- Ultra-High-Field (7 T +)
- By Application
- Neurology
- Oncology
- Musculoskeletal
- Cardiology
- Gastroenterology
- Other Applications
Data Sources, Market Sizing, and Validation
Desk Research
Desk work starts with mapping demand-side signals that explain why scanners are bought and how intensively they are used. We reference public health and demographic statistics, such as Statistics South Africa, along with epidemiology and noncommunicable disease indicators published by the World Health Organization. To ground policy and capacity context, we also use material from the National Department of Health and regulator updates from SAHPRA where relevant to imaging equipment.
On the supply side, we review customs and trade releases (for example, national trade statistics and shipment classifications for medical equipment) to sense import direction and pricing bands. We also use hospital and radiology group publications, annual reports, and investor presentations to confirm procurement cycles and refresh triggers. Where a detail is hard to reconcile from public releases, paid subscriptions for company financials and patent databases are used as supporting evidence rather than as the main sizing input. The sources listed here are illustrative only, and many other public documents and datasets were also used for collection, cross-checks, and clarification.
Primary Interviews and Surveys
Primary work focuses on how MRI purchasing decisions are made in South Africa and what really drives revenue per installed system. We spoke with a mix of hospital procurement and biomedical engineering teams, radiology managers, and distributor channel contacts, which then helped us confirm utilization, replacement timing, and the usual feature mix for new installations. Since this is a country market, the views were balanced across public and private settings to make sure our assumptions did not tilt toward one care pathway.
Distribution of primary research fieldwork respondents
| Company type | Respondent position |
|---|---|
| Top tier: 39% | CXOs: 12% |
| Mid tier: 43% | Functional/Unit leaders: 40% |
| Smaller Players: 18% | Managers: 48% |
Market-Sizing & Forecasting
Sizing begins with a top-down build that reconstructs the addressable MRI spend from the installed base, expected replacement cycles, and annual additions needed to serve imaging demand. Once that pool is formed, it is split using practical fingerprints such as the typical share of closed versus open systems, the mix of field strength in active sites, and the application pattern driven by neurology, oncology, and musculoskeletal caseloads.
To keep the totals realistic, selective bottom-up checks are used, including sampled price points by field strength, distributor channel checks on tender and private purchase patterns, and a sanity check against likely annual unit shipments implied by import activity. Where the bottom-up view has gaps (for example, private purchases not visible in public procurement), we carry a conservative range for unit volumes and then anchor the final value back to what interviews indicate for average selling price movement.
For forecasting, we use scenario analysis supported by a light multivariate view of the inputs that most consistently explain demand in this market, which include private insurance coverage trends, public sector budget cycles, load-shedding related downtime risks that shift utilization, and the pace of scanner upgrades toward 1.5T and 3T. Growth rates are then adjusted after validation calls, since experts often highlight timing differences between budget approval, site readiness, and actual installation.
Data Validation & Update Cycle
After the model is built, we run several checks so the numbers do not depend on one assumption. Outputs are compared with independent signals like implied annual unit installations, replacement cadence consistency, and whether the price mix matches what buyers describe as the common configuration. If an anomaly shows up, such as growth that is not aligned with procurement timing or utilization constraints, the underlying drivers are reviewed and, when needed, the team re-contacts sources to recheck the assumption.
Before sign-off, the work goes through analyst review steps that include variance checks across years and a final consistency scan across segments. Reports are refreshed annually, and interim updates are completed when material events can shift demand, such as policy changes or major supply constraints. Right before delivery, a fresh review pass is done so clients receive the latest updated view.
Mordor Intelligence's South Africa Magnetic Resonance Imaging Market Sizing Compared With Other Published Estimates
Different sources can show different market values for South Africa MRI because they do not always measure the same revenue pool, and they also do not treat pricing and replacement timing in the same way. Some estimates focus only on scanner hardware units, while others include broader imaging spend, which naturally changes the final number.
The main gap comes from whether the estimate counts only MRI system shipments versus the wider MRI revenue tied to configured system value, where Mordor Intelligence keeps the scope aligned to MRI systems by architecture, field strength, and clinical application, and then updates price mix assumptions with local channel checks.
Benchmark comparison
| Source | Market Size | Gaps in Research Methodology |
|---|---|---|
| Mordor Intelligence | USD 1.37 B (2025) | |
| Industry Publisher A | USD 0.01 B (2023) | This figure appears to track MRI systems as a narrow equipment market, which can understate value when configured system pricing, installation-linked revenue at purchase, and mix shifts toward higher-field systems are not fully reflected. |
| Trade Dataset Summary B | USD 0.29 B (2024) | This type of estimate often leans on import value as a proxy for market size, which can miss locally bundled components, multi-year delivery timing, and the difference between declared trade value and the end buyer price paid across public and private channels. |
Overall, the spread is mainly explained by how far the scope extends beyond unit shipments and how pricing is converted into revenue when system mix changes. By tying the total to installed base movement, replacement timing, and a realistic ASP path, the model stays traceable to inputs that can be rechecked year after year.
Key Questions Answered in the Report
What is the forecast value of the South Africa magnetic resonance imaging market in 2031?
The market is projected to reach USD 1.77 billion by 2031.
Which architecture type is growing fastest in South Africa MRI?
Open MRI systems are expanding at a 6.36% CAGR through 2031.
How large is the radiologist workforce relative to MRI demand?
About 700 radiologists nationwide create interpretive capacity constraints for growing scan volumes.
Which application segment shows the highest growth outlook?
Cardiology leads growth with a 5.31% CAGR expected through 2031.
Why are low-field scanners gaining traction?
They cost less to buy and operate, fit sites with unreliable power, and improve rural access.
What policy program is funding new public-sector MRI capacity?
National Health Insurance allocates ZAR 77.8 billion for 197 facility upgrades over five years.