Market Overview
| Study Period | 2020 - 2031 |
|---|---|
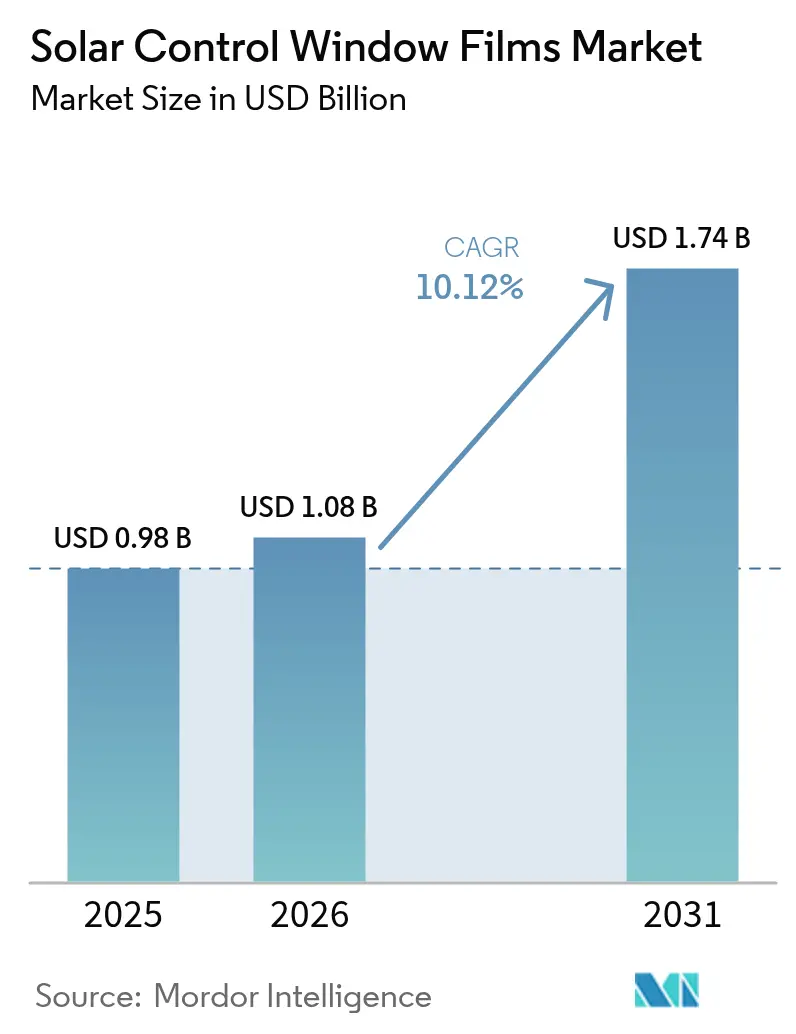
| Market Size (2026) | USD 1.08 Billion |
| Market Size (2031) | USD 1.74 Billion |
| Growth Rate (2026 - 2031) | 10.12% CAGR |
| Fastest Growing Market | Asia Pacific |
| Largest Market | Asia Pacific |
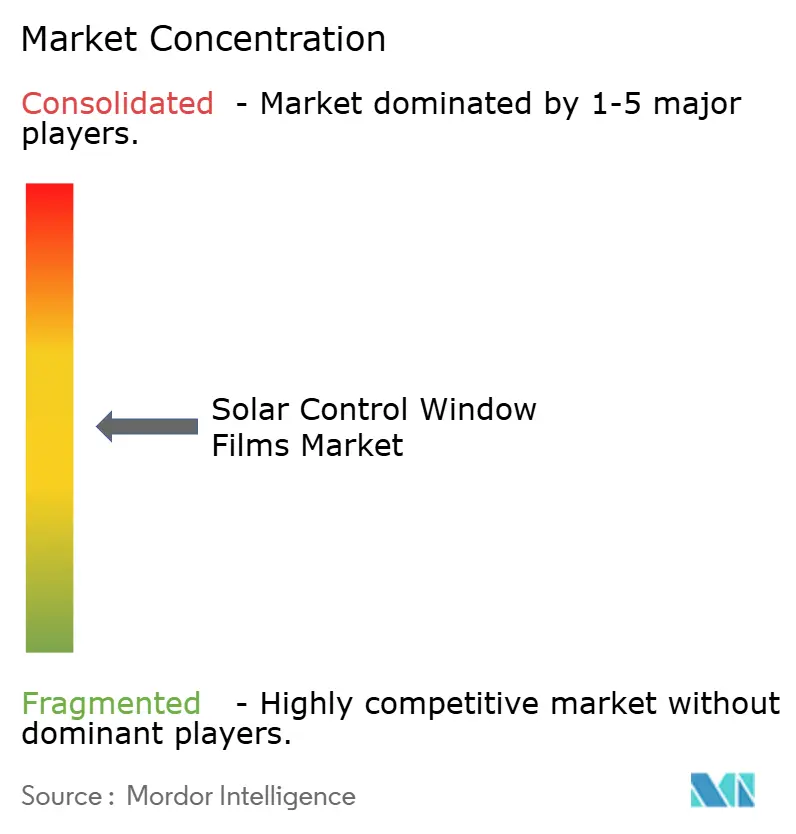
| Market Concentration | Medium |
Major Players *Disclaimer: Major Players sorted in no particular order Image © Mordor Intelligence. Reuse requires attribution under CC BY 4.0. | |
Solar Control Window Films Market Analysis by Mordor Intelligence
The Solar Control Window Films Market size was valued at USD 0.98 billion in 2025 and estimated to grow from USD 1.08 billion in 2026 to reach USD 1.74 billion by 2031, at a CAGR of 10.12% during the forecast period (2026-2031).International decarbonization rules, rising utility costs, and proven payback periods below three years keep demand resilient. Vacuum-coated reflective products dominate current specifications because they combine high infrared rejection with neutral aesthetics, while ceramic–metallic hybrids push performance thresholds in climates with extreme temperature swings. Asia Pacific construction booms, EU net-zero mandates, and US fiscal incentives all converge to keep volumes expanding even when raw-material costs fluctuate. These forces collectively reinforce the solar control window films market as a pivotal lever in the wider energy-efficiency value.
Key Report Takeaways
- By film type, vacuum-coated reflective variants commanded 42.35% of the solar control window films market share in 2025, and the category is advancing at a 10.44% CAGR through 2031.
- By absorber type, ceramic technology led with 45.60% revenue share in 2025; metallic absorbers post the quickest pace at 10.42% CAGR through 2031.
- By the installation stage, new-build projects accounted for 84.20% of the solar control window films market size in 2025 and continue at a 10.41% CAGR.
- By end-user industry, construction held 54.10% of 2025 revenue, while automotive applications are forecast to expand at 11.03% CAGR to 2031.
- By geography, Asia Pacific dominated with 44.40% of 2025 revenue and remains the fastest region at 10.55% CAGR through 2031.
Note: Market size and forecast figures in this report are generated using Mordor Intelligence’s proprietary estimation framework, updated with the latest available data and insights as of 2026.
Global Solar Control Window Films Market Trends and Insights
Driver Impact Analysis*
| Driver | (~) % Impact on CAGR Forecast | Geographic Relevance | Impact Timeline |
|---|---|---|---|
| Growing Emphasis on Reducing Carbon Footprints | +2.8% | Global, with the strongest impact in the EU and North America | Medium term (2-4 years) |
| Net-Zero Building Codes in Europe Driving Low-E Film Adoption | +2.1% | Europe core, spill-over to APAC and North America | Long term (≥ 4 years) |
| Upsurge in the Asia-Pacific Construction Industry | +3.2% | APAC core, with secondary effects in MEA | Short term (≤ 2 years) |
| Awareness of UV Protection and Health Concerns | +1.5% | Global, with premium market concentration in developed economies | Medium term (2-4 years) |
| Rapid E-Commerce Warehouse Construction Requiring Day-Lighting Control in APAC | +1.8% | APAC core, emerging in Latin America | Short term (≤ 2 years) |
| Source: Mordor Intelligence | |||
Growing Emphasis on Reducing Carbon Footprints
Corporate climate pledges elevate the solar control window films market because films shave 5–15% cooling loads and qualify for science-based emission targets. Peak-demand trimming aligns neatly with grid-resilience objectives in hot regions. Real-estate investment trusts also treat glazing upgrades as accretive to asset value rather than as deferred maintenance. As renewable penetration accelerates, demand-side solutions such as films gain prestige for stabilizing load profiles. This positioning solidifies procurement budgets even during capex slowdowns.
Net-Zero Building Codes in Europe Driving Low-E Film Adoption
- The EU’s recast Energy Performance of Buildings Directive compels member states to renovate 3% of public-sector floor area annually and to meet zero-emission standards by 2050. Retro-orientated targets elevate window films by boosting thermal performance without costly frame replacement. Multinationals now replicate the same envelope standards in Asia and North America, exporting European benchmarks worldwide. Lifecycle-carbon clauses also favor thin-film retrofits over high-embodied-carbon glazing swaps. Consequently, suppliers see longer order visibility in public tenders.
Upsurge in the Asia-Pacific Construction Industry
- Urbanization trajectories in China, India, and Southeast Asia accelerate completions in Tier-2 metro corridors where cooling degree-days are rising fastest. National codes referencing ASHRAE 90.1 analogues now mandate solar-heat-gain limits, ensuring that specifications include high-performance glazing. Developers prize vacuum-coated constructions because they meet performance thresholds at modest added cost. The result is a compounding feedback loop: expanding stock magnifies baseline demand while tighter codes raise per-building film intensity.
Awareness of UV Protection and Health Concerns
- Corporate tenants link indoor-environment quality with retention and productivity gains, so they specify films that block 99% of UV yet maintain daylight. WELL and LEED frameworks grant credits when UV transmission is kept below 2%, letting owners monetise health benefits. Premium rents in knowledge hubs justify incremental capex as employers compete for talent. Insurers also discount premiums for buildings demonstrating reduced UV-induced interior degradation, underscoring a multi-pronged ROI case.
Restraint Impact Analysis*
| Restraint | (~) % Impact on CAGR Forecast | Geographic Relevance | Impact Timeline |
|---|---|---|---|
| Substitution Risk from Dynamic Smart Glazing in Premium Commercial Towers | -1.8% | Global, concentrated in premium commercial segments | Long term (≥ 4 years) |
| Warranty-Linked Liability for Delamination in Hot-Humid Climates | -1.2% | APAC and MEA tropical regions, Gulf states | Medium term (2-4 years) |
| Volatile Polyester and Nano-Ceramic Raw Material Prices | -2.1% | Global, with supply chain concentration in Asia Pacific | Short term (≤ 2 years) |
| Source: Mordor Intelligence | |||
Substitution Risk from Dynamic Smart Glazing in Premium Commercial Towers
- Electrochromic and thermochromic units dynamically tint glass, providing glare mitigation that static films cannot match. As manufacturing costs fall, façade consultants increasingly specify these systems for double-skin or unitized curtain walls in prestige projects. Although price premiums remain 3–5 times film installations, long-term energy simulations often favor dynamic controls. Film suppliers respond by sharpening mid-market pitches and expanding retrofit channels where smart glass paybacks extend beyond 12 years.
Warranty-Linked Liability for Delamination in Hot-Humid Climates
- High vapor pressure and relentless UV in tropical latitudes erode adhesives, causing edge lift and optical haze. Large-surface failures spawn multi-tenant claims that can dwarf product revenue, challenging insurer appetite. Premium adhesive chemistries lengthen warranty coverage in Asia Pacific high-rise portfolios, yet price-sensitive owners still gravitate to low-cost films with limited guarantees. Liability risk, therefore, caps penetration in equatorial coastal cities until installer training and specification diligence improve.
*Our forecasts treat driver/restraint impacts as directional, not additive. The impact forecasts reflect baseline growth, mix effects, and variable interactions.
Segment Analysis
By Film Type: Vacuum-Coated Dominance Drives Performance Premium
Vacuum-coated reflective products captured 42.35% of 2025 revenue, and their 10.44% CAGR keeps the solar control window films market size for this segment well ahead of dyed and clear alternatives. Architects value the micro-thin metallic stack that selectively reflects near-infrared while admitting visible light.
Film manufacturers now deploy sputter chambers using silver, indium, and nickel alloys that achieve emissivity below 0.20. In mass-housing retrofits, dyed polyester films still appeal for initial affordability, yet energy-code tightening steadily redirects volume to reflective constructions.


By Absorber Type: Ceramic Leadership Faces Metallic Challenge
Ceramic absorbers held 45.60% of 2025 revenue, reflecting their color stability, high melting point, and negligible radio-frequency interference. Automotive OEMs favor nano-ceramic layers because they avoid signal attenuation for telematics antennas. The solar control window films market share advantage may narrow, however, as refined metallic nanoparticle dispersions cut manufacturing costs and restore conductivity benefits for defogger grids.
Metallic-only films are marching at 10.42% CAGR, aided by sputter stack refinements that curb iridescence. Hybrid architectures now deposit alumina or silica atop silver seed layers, creating composite optical stacks that combine low reflectance with steep infrared rejection. Such progress blurs historic boundaries and pushes the category toward function-specific formulations, glare suppression, anti-graffiti, or photovoltaic overlay.
By Installation Stage: New-Build Concentration Creates Retrofit Opportunity
New-build integration represented 84.20% of 2025 revenue and grew in step with site-based glazing packages, yet retrofit demand remains a trillion-square-foot opportunity. Construction managers like specifying films during curtain-wall fabrication because factory conditions guarantee adhesion, optical clarity, and quality-assurance traceability.
The retrofit channel also benefits from government fiscal stimuli. Asian municipalities grant additional floor-area ratios to owners performing green refurbishments, effectively monetizing energy savings through leasable space bonuses. These carrots rapidly reshape investment calculus in favor of aftermarket films.
By End-User Industry: Construction Stability Versus Automotive Acceleration
The construction sector secured 54.10% of the 2025 volume, giving the overall solar control window films market a firm baseline demand. Office towers, hospitals, and schools specify films for operational-carbon compliance, while new suburban housing selects tinting for privacy and glare control.
Nevertheless, automotive glazing is the fast lane, clocking 11.03% CAGR through 2031 as battery-electric platforms expose cabin-heat resilience as a range determinant. OEM engineering groups now model the impact of 3 °C cabin reduction on kWh draw and integrate low-e films into sunroofs and side windows accordingly. Complementary demand surfaces in distribution warehouses, data centers, and sports arenas, each with unique optical and thermal needs. Warehouse operators in Southeast Asia install films to balance daylight with heat-load thresholds, protecting temperature-controlled zones from refrigeration spikes.

Geography Analysis
Asia Pacific commanded 44.40% of 2025 revenues and is expanding at a 10.55% CAGR, ensuring it remains the gravitational center of the solar control window films market. China’s Green Building Evaluation Standard GB/T 50378 and India’s Eco-Niwas mandate solar-heat-gain coefficients that accelerate high-selectivity film uptake.
Retrofit incentives anchor North America. The Inflation Reduction Act’s enhanced tax deduction accelerates envelope upgrades across federal and private portfolios, and California’s Title 24 revisions elevate exterior-shade coefficient thresholds that thin films meet without altering façade appearance.
Europe maintains mature penetration yet enjoys a second wave of demand tied to the 2030 “Fit-for-55” climate package.


Competitive Landscape
Competition remains moderately fragmented. Strategic moves center on sustainability, branding, and circular design. Toray’s PICASUS series extends into advanced-mobility windshields with nano-layer stacks thinner than one micron, targeting the booming electric-vehicle glass segment. These differentiated strategies defend margins as commodity entrants undercut on price in mass-retrofit bids.
Solar Control Window Films Industry Leaders
3M
Avery Dennison Corporation
Eastman Chemical Company
Saint-Gobain
Garware Hi-Tech Films
- *Disclaimer: Major Players sorted in no particular order

Recent Industry Developments
- January 2025: LINTEC Corporation, under its WINCOS brand, which provides solar control window films, introduced a new window film that incorporates 100% recycled PET resin into the facestock.
- November 2024: Toray Industries, Inc. unveiled a high heat-insulating solar control film using its PICASUS nano-multilayer technology for advanced mobility windshields.


Research Methodology Framework and Report Scope
Market Definitions and Key Coverage
Our study defines the solar control window films market as the value generated from manufacturer-made, multilayer polymer films that are permanently laminated to architectural, automotive, or marine glazing to lower solar heat gain, ultraviolet transmission, and glare. Products considered must be factory coated or sputtered and supplied on rolls; onsite liquid coatings and electrochromic smart glass are outside scope.
Scope Exclusion: aftermarket vinyl wraps meant only for styling or privacy, with no tested solar-rejection rating, are not covered.
Segmentation Overview
- By Film Type
- Clear (Non-reflective)
- Dyed (Non-reflective)
- Vacuum-Coated (Reflective)
- High Performance Films
- Other Film Types
- By Absorber Type
- Organic
- Inorganic / Ceramic
- Metallic
- By Installation Stage
- New-Build
- Retrofit
- By End-user Industry
- Construction
- Automotive
- Marine
- Design
- Other End-user Industry
- By Geography
- Asia-Pacific
- China
- India
- Japan
- South Korea
- Rest of Asia-Pacific
- North America
- United States
- Canada
- Mexico
- Europe
- Germany
- United Kingdom
- Italy
- Spain
- France
- Rest of Europe
- South America
- Brazil
- Argentina
- Rest of South America
- Middle East and Africa
- Saudi Arabia
- South Africa
- United Arab Emirates
- Rest of Middle East and Africa
- Asia-Pacific
Detailed Research Methodology and Data Validation
Primary Research
Mordor analysts interview film converters, regional distributors, glazing contractors, energy-certification consultants, and facility managers across Asia-Pacific, North America, and Europe. These conversations validate thickness mixes, retrofit shares, payback thresholds, and regional mark-ups, filling gaps that secondary sources leave open and letting us cross-check early model outputs.
Desk Research
We start with publicly accessible tier-one datasets, such as UN Comtrade trade flows for HS 392062, International Energy Agency building energy intensity tables, Eurostat construction-permit releases, and U.S. Energy Information Administration cooling-degree statistics, to frame demand pools. Regulations from ASHRAE 90.1 and the EU Energy Performance of Buildings Directive clarify retrofit triggers, while patent abstracts (Questel) signal technology lifecycles. Company 10-K filings, investor decks, and reputable trade press then sharpen average selling prices and route-to-market spreads. This list is illustrative; many additional sources inform the desk stage.
Market-Sizing & Forecasting
A top-down construct begins by reconstructing global film consumption from trade and production data, adjusted for multi-layer yields, wastage, and installation rates. Supplier roll-ups and sampled ASP-by-width checks supply a selective bottom-up lens that fine-tunes totals. Variables that drive the model include new-build floor area completions, automotive production volumes, aftermarket tint penetration ratios, PET substrate price indices, and annual cooling-degree shifts. Multivariate regression projects each driver, and scenario analysis stress-tests high-heat or slow-build futures before figures are finalized.
Data Validation & Update Cycle
Outputs pass variance screens against independent building-energy savings benchmarks; anomalies trigger re-interviews. A second analyst reviews every assumption before sign-off. Reports refresh annually, with interim revisions when material events, such as subsidy changes, arise.
Why Mordor's Solar Control Window Films Baseline Commands Reliability
Published estimates differ because firms pick varying product mixes, regional roll-ups, and update intervals.
Key gap drivers include whether clear privacy films are blended with true solar products, how aggressively price escalators are applied, and if service-life payback horizons are embedded. Mordor's scope mirrors certificated solar-rejection films only, applies dual currency cross-checks, and is refreshed each year, keeping our 2025 baseline firmly anchored.
Benchmark comparison
| Market Size | Anonymized source | Primary gap driver |
|---|---|---|
| USD 0.98 B (2025) | Mordor Intelligence | - |
| USD 1.54 B (2024) | Global Consultancy A | Includes decorative tint and smart glass; older base year |
| USD 1.73 B (2025) | Trade Journal B | Uses list prices without installer discounts; wider film-type scope |
| USD 0.79 B (2022) | Industry Data Firm C | Conservative growth applied and not yet updated for recent efficiency mandates |
These contrasts show that, by selecting a consistent product set, triangulating price decks with installer margins, and revisiting drivers yearly, Mordor Intelligence offers a balanced, transparent baseline that decision-makers can trace and reproduce.


Key Questions Answered in the Report
What is the current value of the solar control window films market?
The market stood at USD 1.08 billion in 2026 and is projected to reach USD 1.74 billion by 2031 at a 10.12% CAGR.
Which region leads demand for solar control window films?
Asia Pacific accounts for 44.40% of global revenue and posts the highest growth at 10.55% CAGR through 2031.
Why are vacuum-coated reflective films gaining popularity?
They offer high infrared rejection with neutral appearance, holding 42.35% market share and expanding at 10.44% CAGR.
How do government incentives influence adoption?
Measures such as the US Inflation Reduction Act’s USD 5.00-per-sq ft deduction and EU net-zero mandates directly raise retrofit and new-build demand.
What restrains wider adoption in tropical climates?
Elevated humidity accelerates adhesive failure, causing delamination that results in costly warranty claims.
Page last updated on:


