Market Overview
| Study Period | 2020 - 2031 |
|---|---|
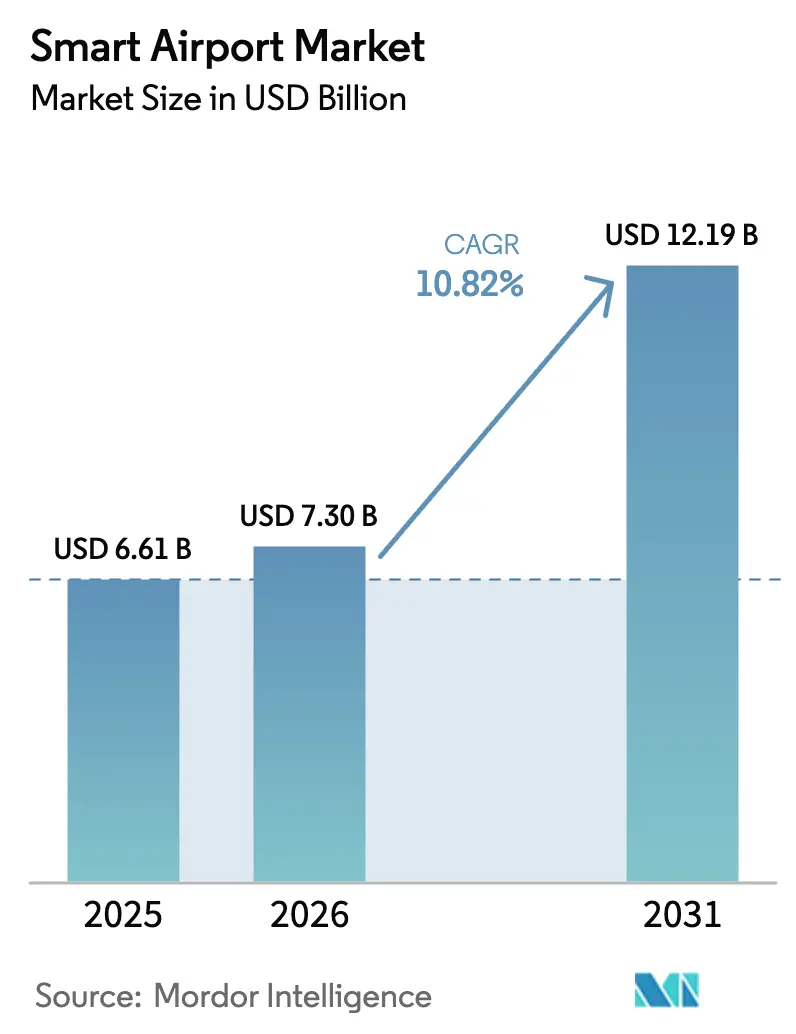
| Market Size (2026) | USD 7.30 Billion |
| Market Size (2031) | USD 12.19 Billion |
| Growth Rate (2026 - 2031) | 10.82% CAGR |
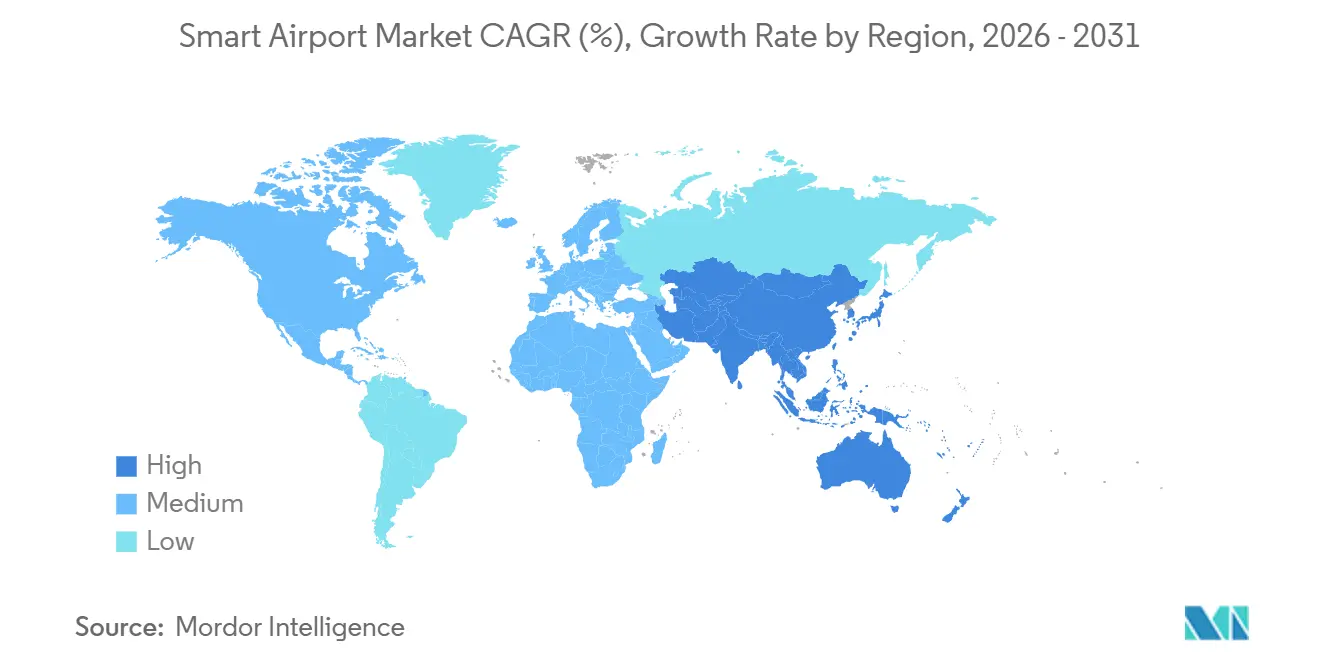
| Fastest Growing Market | Asia Pacific |
| Largest Market | North America |
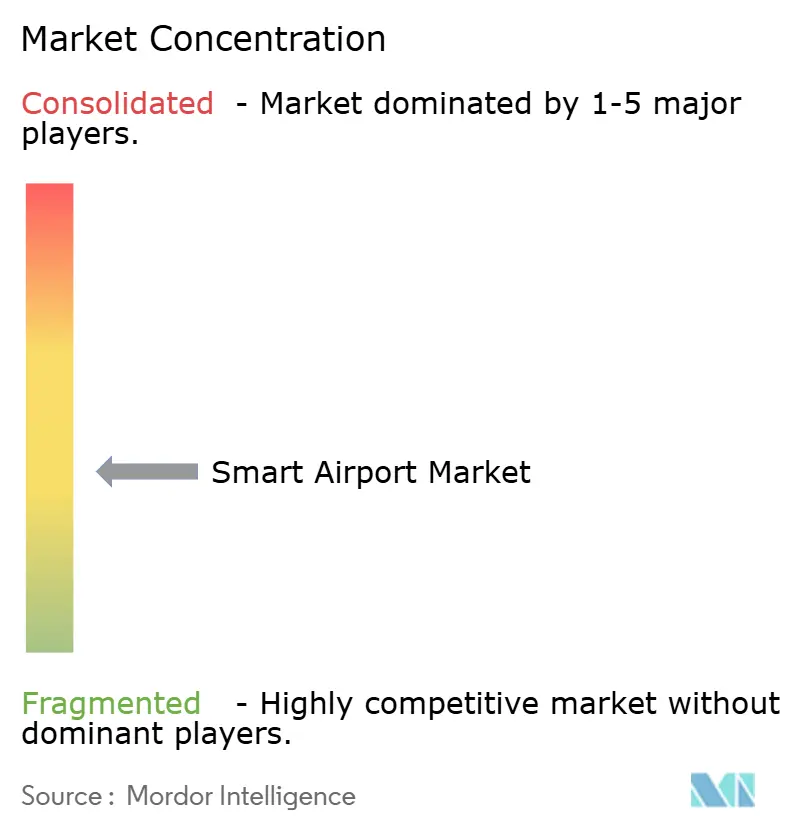
| Market Concentration | Medium |
Major Players *Disclaimer: Major Players sorted in no particular order Image © Mordor Intelligence. Reuse requires attribution under CC BY 4.0. | |
Smart Airport Market Analysis by Mordor Intelligence
The smart airport market size is expected to grow from USD 6.61 billion in 2025 to USD 7.3 billion in 2026 and is forecasted to reach USD 12.19 billion by 2031 at a 10.82% CAGR over 2026-2031. Passenger traffic has returned to pre-pandemic levels, prompting operators to transition from reactive upgrades to predictive, data-driven infrastructure to reduce turnaround times and increase non-aeronautical revenue. According to IATA, initial implementations of biometric e-gates, digital twins, and 5G-enabled IoT networks demonstrate that integrated platforms can delay costly terminal expansions while maintaining passenger satisfaction scores above 90%. Medium-sized hubs are adopting these technologies more rapidly than larger hubs by incorporating modular cloud systems at greenfield sites, thereby avoiding the 30–40% retrofit cost premiums associated with legacy gateways, according to SITA. Services are now surpassing hardware in growth as airports reallocate capital expenditures toward managed contracts that include cybersecurity, analytics, and software updates, a model that aligns vendor incentives with long-term performance, as noted by Accenture. Regulatory requirements, such as the EU Entry/Exit System and TSA Credential Authentication Technology, are driving the adoption of technology even among operators with limited budgets.
Key Report Takeaways
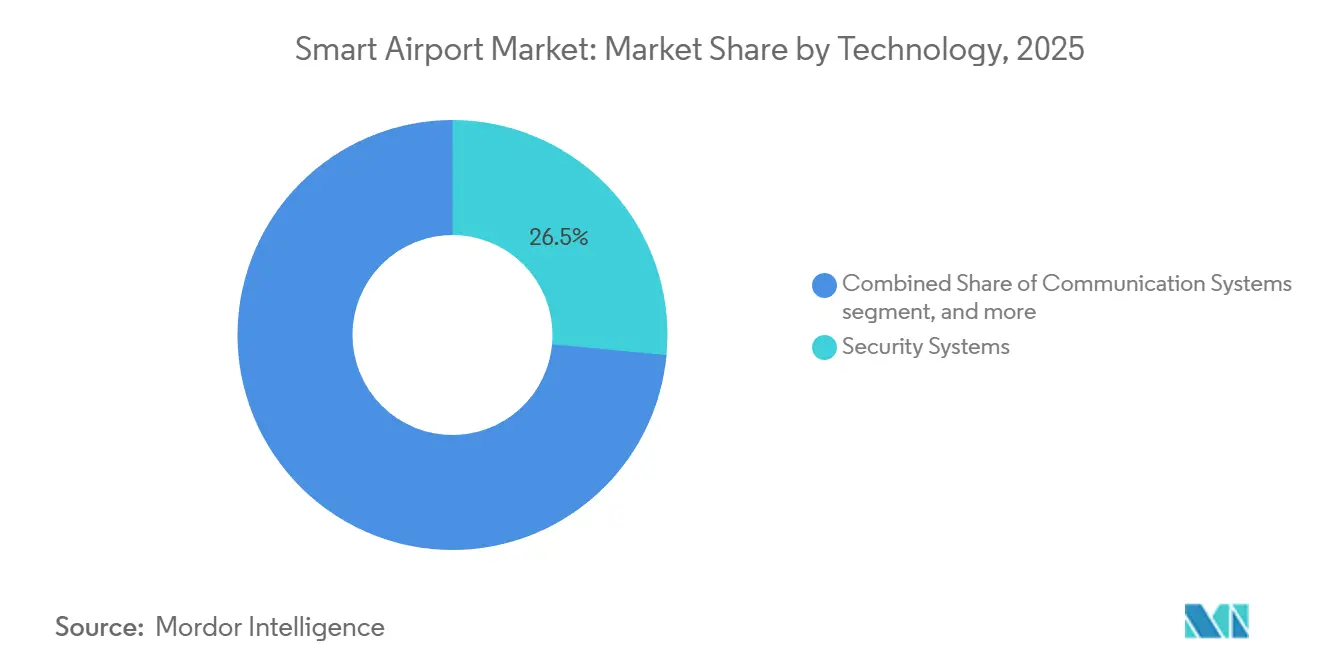
- By technology, security systems accounted for 26.49% of the smart airport market in 2025, while smart retail and hospitality systems are forecasted to expand at a 13.59% CAGR through 2031.
- By solution, hardware commanded 44.78% of the smart airport market share in 2025, while services are projected to advance at a 12.29% CAGR through 2031.
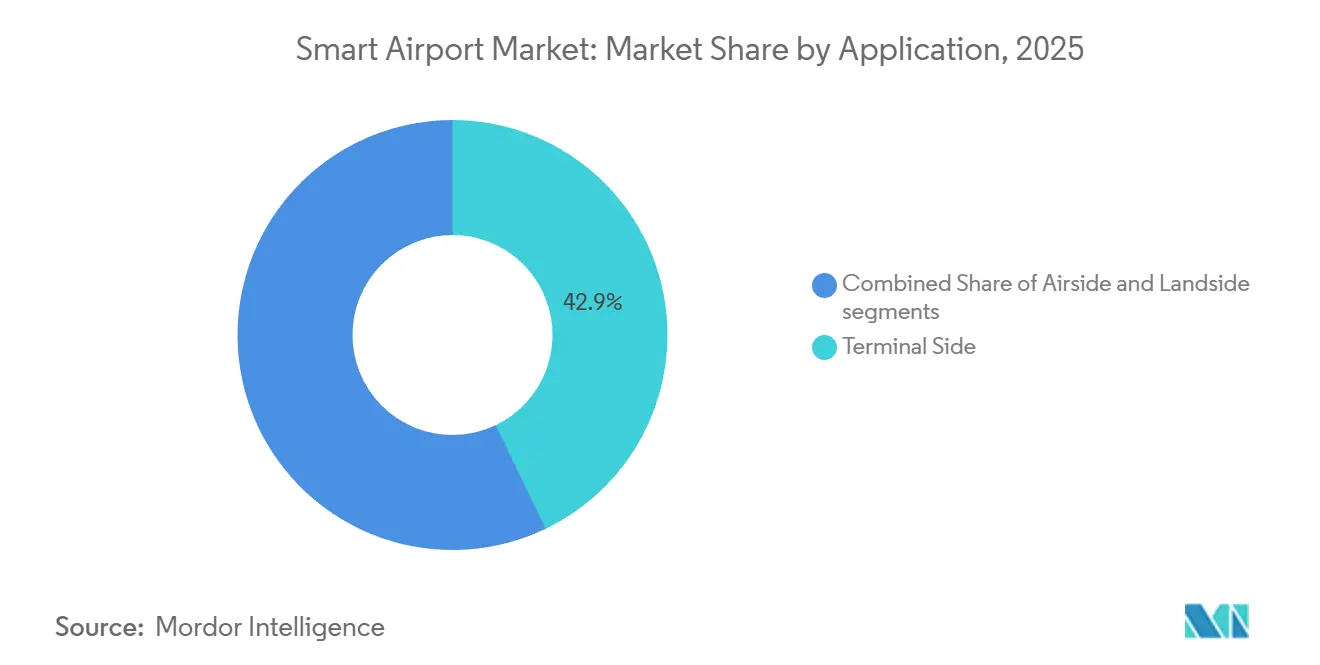
- By application, the terminal side accounted for 42.87% of the smart airport market in 2025; landside activities are projected to grow at a 12.56% CAGR through 2031.
- By airport size, large hubs accounted for 55.85% of the smart airport market share in 2025; however, medium airports posted the fastest gains, with an 11.70% CAGR through 2031.
- By airport technology, Airport 3.0 captured 37.47% of the smart airport market share in 2025, whereas Airport 4.0 platforms are projected to grow at a 13.29% CAGR through 2031.
- By geography, North America accounted for 31.94% of the revenue in 2025; the Asia-Pacific region is the fastest-growing, with an 11.90% CAGR through 2031.
Note: Market size and forecast figures in this report are generated using Mordor Intelligence’s proprietary estimation framework, updated with the latest available data and insights as of January 2026.
Global Smart Airport Market Trends and Insights
Drivers Impact Analysis*
| Driver | (%) Impact on CAGR Forecast | Geographic Relevance | Impact Timeline |
|---|---|---|---|
| Rising passenger volumes accelerating demand for biometric screening and self-service technologies | +2.8% | Global; pioneer sites in Asia-Pacific and Middle East | Medium term (2–4 years) |
| Growing airport IT investments to support digital-first operational models | +2.3% | North America and Europe, expanding to APAC | Short term (≤ 2 years) |
| Mandatory compliance with upgraded security and border-control regulations | +1.9% | Global; strictest in advanced markets | Long term (≥ 4 years) |
| Proliferation of IoT and 5G enabling real-time visibility into airport operations | +1.6% | APAC core; spill-over to North America and Europe | Medium term (2–4 years) |
| Data-driven retail analytics improving non-aeronautical revenue generation | +1.4% | Global, with premium focus in high-traffic hubs | Short term (≤ 2 years) |
| Deployment of digital twins for predictive planning and maintenance optimization | +1.2% | Large airports globally, gradual adoption in medium airports | Long term (≥ 4 years) |
| Source: Mordor Intelligence | |||


Rising Passenger Volumes Boosting Biometric and Self-service Rollouts
Global traffic is expected to reach 8.5 billion journeys in 2024 and is projected to exceed 9.5 billion by 2030, straining checkpoints designed for lower passenger volumes. Biometric boarding has reduced processing times from 45 seconds to less than 10 seconds, improving passenger satisfaction scores by up to 20 percentage points. A 2024 cross-border trial at Narita and Hong Kong demonstrated a 40% reduction in immigration queues, highlighting the scalability of interoperable frameworks across jurisdictions.[1]Hong Kong International Airport, “Cross-Border Biometric Trial,” hongkongairport.com By 2025, global self-bag-drop installations exceeded 1,200, reflecting a 35% annual growth as airlines shifted staff to revenue-generating roles. ICAO Document 9303 now standardizes touchless journeys, reducing the number of contact points by 60–70%.
Growing Airport IT Spending Pivoting to Digital-first Operations
Airports allocated USD 8.9 billion to IT investments in 2024, marking a 12% year-on-year increase, with a focus on cloud migration, predictive maintenance, and baggage tracking. Brussels Airport implemented a digital twin in 2024, coordinating 22 stakeholders and reducing turnaround delays by 18%. Heathrow has committed GBP 2.3 billion (approximately USD 2.9 billion) to 5G networks and autonomous vehicles by 2028. According to Amadeus, 48% of airports surveyed in 2025 had migrated at least one core system to the cloud, with scalability identified as the primary motivation. Atlanta Hartsfield-Jackson utilized predictive analytics to reroute 300 flights during a 2024 storm, saving USD 15 million in delay costs.
Mandatory Security and Border-control Upgrades
The EU Entry/Exit System mandates the installation of 2,500 new e-gates across 27 member states by 2026. In the US, the TSA’s Credential Authentication Technology now operates at 200 checkpoints, enabling ID scans in under five seconds. The ICAO’s 2024 Global Aviation Security Plan introduced risk-based screening, reducing processing times for pre-vetted travelers by half. Gatwick Airport invested approximately GBP 2.2 billion (USD 2.95 billion) to comply with new CT screening regulations, highlighting the significant costs associated with regulatory compliance.
Proliferation of IoT and 5G for Real-time Operational Data
Major airport hubs generate 2–5 terabytes of sensor data daily, resulting in up to 30% reduction in equipment downtime. Changi Airport embedded 10,000 sensors in the construction zones of Terminal 5, cutting project delays by 15%. Munich and Incheon airports are piloting private 5G networks to enable autonomous tugs and live video analytics. Aberdeen Airport’s digital twin technology has improved gate assignment efficiency by 22% under varying weather conditions.
Restraints Impact Analysis*
| Restraint | (%) Impact on CAGR Forecast | Geographic Relevance | Impact Timeline |
|---|---|---|---|
| Significant capital investment and complex system integration requirements | -1.80% | Global, acute at brownfield sites in Europe and North America | Short term (≤ 2 years) |
| Growing concerns over cybersecurity and passenger data protection | -1.30% | Global, regulatory pressure highest in EU and North America | Medium term (2-4 years) |
| Limited availability of skilled professionals for OT-IT system convergence | -1.00% | Global, most severe in Asia-Pacific and Middle East | Medium term (2-4 years) |
| Incompatibility with legacy aviation communication systems | -0.70% | North America, Europe, select Asia-Pacific hubs | Long term (≥ 4 years) |
| Source: Mordor Intelligence | |||
Significant Capex and Complex System Integration Requirements
Innovative airport projects require investments ranging from USD 50 million to USD 500 million per hub, with payback periods of 7–12 years, which can deter investors seeking quicker returns. Retrofitting biometric gates increases costs by up to 40% and delays schedules by two years in brownfield terminals. Changi Airport’s Terminal 5 project, with a budget of SGD 3 billion (USD 2.34 billion), exemplifies the scale of fully integrated ecosystems. Heathrow Airport has included a 20% contingency buffer in its GBP 2.3 billion (approximately USD 3.09 billion) digital roadmap to address unforeseen integration challenges.
Growing Concerns over Cybersecurity and Passenger Data Protection
The 2024 ransomware attack at Seattle-Tacoma Airport disrupted operations for five days, exposing vulnerabilities in interconnected systems.[2]Reuters, “Seattle-Tacoma Ransomware Attack,” reuters.com Similarly, a power outage at Manchester Airport in June 2024 led to IT failures, resulting in approximately 10,000 travelers being stranded. Compliance with GDPR and TSA cybersecurity directives has increased annual IT budgets by 8–12%. Cyber-insurance premiums rose by 15–25% in 2025 as underwriters reassessed risks following high-profile cyberattacks.
*Our forecasts treat driver/restraint impacts as directional, not additive. The impact forecasts reflect baseline growth, mix effects, and variable interactions.
Segment Analysis
By Technology: Security Systems Anchor Spending, Smart Retail Surges
Security systems accounted for 26.49% of the smart airport market in 2025, driven by regulatory requirements for CT scanners and biometric access systems. Smart retail and hospitality are growing at a 13.59% CAGR through 2031. They are expected to capture a significantly larger share of the market by 2031, as analytics enhance per-passenger spending. Communication systems are transitioning to IP-based networks, enabling video streaming to improve situational awareness.
Passenger, cargo, baggage, and ground-handling systems utilize RFID and robotic automation to achieve a 99.50% accuracy rate in baggage delivery. According to SITA's recent press releases, innovative parking solutions reduce landside congestion by 40%. Upgrades in air and ground traffic control, such as remote towers, are reducing staffing costs by up to 40% at regional airports.[3]National Air Traffic Services, “Remote Tower Operations,” nats.aero The focus is shifting from perimeter defense to revenue generation and operational efficiency, reflecting airports' transformation into omni-channel retail hubs that also manage aircraft operations.


By Solution: Hardware Dominates, Services Accelerate on Managed Contracts
Hardware maintained a 44.78% share of the smart airport market in 2025, supported by mandatory scanners, e-gates, and IoT sensors that form the foundation of digital ecosystems. Services, however, are expanding at a CAGR of 12.29%, as operators increasingly adopt managed models that bundle integration, cybersecurity, and updates. Software continues to grow steadily, with cloud platforms enabling functionality independent of proprietary hardware.
The cost of biometric kiosks has decreased to USD 30,000 from USD 50,000 in 2020, compressing equipment margins and encouraging OEMs to focus on recurring-revenue services. Cybersecurity-as-a-service is emerging, with vendors operating multi-airport SOCs to achieve economies of scale that are difficult to replicate in-house. Medium-sized airports are adopting "airport-as-a-service" bundles to avoid capital expenditures of up to USD 50 million, positioning service revenue as the primary growth driver for the sector by 2031.
By Application: Terminal Side Leads, Landside Gains on Curbside Automation
Terminal-side operations accounted for 42.87% of the smart airport market size in 2025, driven by regulatory priorities related to security and boarding. Landside solutions, including smart parking and curbside management, are projected to grow at a CAGR of 12.56% through 2031, as airports capitalize on the first and last mile of passenger journeys.
Dynamic pricing enabled by license-plate recognition increases parking revenue by up to 10%. At the same time, computer-vision curbside systems, such as those implemented at LAX, have reduced illegal stops by 30% and improved traffic flow by 18%. Airside technologies are also advancing, with upgrades in radar and remote-tower tools enabling 20% faster turnaround times and significant fuel savings. The strategic focus is shifting toward creating seamless, end-to-end passenger journeys, from highway exits to boarding gates.
By Airport Size: Large Hubs Retain Share, Medium Airports Modernize Faster
Large hubs captured 55.85% of the smart airport market share in 2025, leveraging their scale to deploy digital twins and autonomous systems across 50–100 gates. Medium-sized airports are experiencing the fastest growth, with a CAGR of 11.70%, as they adopt modular SaaS platforms that provide enterprise-grade capabilities at reduced capital costs.
Greenfield projects, such as Navi Mumbai and Noida airports, are integrating biometrics and IoT technologies from the outset, avoiding the 40% cost penalties associated with retrofitting. Competitive pressures are increasing as airlines prioritize agile hubs that offer faster turnarounds and lower fees, prompting legacy airports to accelerate modernization efforts despite budget constraints.
By Airport Technology: Airport 3.0 Prevails, Airport 4.0 Gains on Autonomous Systems
Airport 3.0 architectures, which integrate basic IoT and centralized operations centers, held a 37.47% market share in 2025. Airport 4.0 platforms are projected to grow at a CAGR of 13.29%, driven by labor shortages and the need for 24/7 operational reliability.
Changi Airport's upcoming Terminal 5 exemplifies Airport 4.0, featuring autonomous baggage handling and AI-driven crowd management systems that dynamically allocate resources. Munich Airport's AI-powered de-icing scheduler has already reduced winter wait times by 25%. The industry is steadily moving toward self-healing operations, where algorithms handle routine tasks, and human intervention is required only for exceptions.
Geography Analysis
In 2025, North America accounted for 31.94% of the smart airport market, driven by the rollout of TSA CAT-2 and FAA NextGen upgrades. High labor costs in the region are driving the rapid adoption of automation. However, brownfield constraints at major airports, such as John F. Kennedy International Airport and Los Angeles International Airport, are increasing retrofit expenses by 40%. Europe leads in biometric border control, with plans to install 2,500 e-gates by 2026 and implement digital-twin pilots, which are expected to reduce delays by up to 22%.
Asia-Pacific is the fastest-growing region, with a CAGR of 11.90% through 2031, supported by greenfield megaprojects such as Beijing Daxing Airport, designed for 100 million passengers, and Navi Mumbai Airport, targeting a capacity of 90 million. The Middle East is also advancing, incorporating Airport 4.0 designs into the USD 35 billion King Salman International Airport, which aims to handle 120 million passengers annually by 2030.
South America and Africa are lagging in absolute spending. Still, they are adopting biometric gates at high-traffic terminals, such as São Paulo Guarulhos and OR Tambo, to accommodate the increasing intra-regional traffic. Regulatory differences persist, with GDPR compliance adding 12% to IT budgets in the EU, while less stringent regulations in parts of Asia are accelerating biometric adoption but raising privacy concerns.

Competitive Landscape
The smart airport market is moderately fragmented, with the top five players holding approximately 35% of the market share, leaving room for niche specialists. Companies like Honeywell, Thales, and Siemens maintain strong positions in hardware-centric security solutions. Meanwhile, cloud-native providers such as Amadeus and SITA are securing multi-airport SaaS contracts valued between USD 50 million and USD 200 million, bypassing traditional legacy systems. Huawei and NEC offer competitive pricing on biometrics and 5G hardware, undercutting the market by up to 30%, although geopolitical issues limit their access to Western markets.
Platform orchestration is becoming more significant than point-product differentiation. For example, SITA’s WorldTracer baggage network, now operational at 550 airports, demonstrates the advantages of network effects, which increase switching costs for airlines. Vendors with active roles in standards-setting bodies, such as ICAO and IATA, influence technical specifications, aligning future demand with their architectures. Cybersecurity-as-a-service is an emerging focus area, with airports allocating 8–12% of their digital budgets to threat monitoring and mitigation. Companies like Accenture and IBM are expanding their global Security Operations Centers (SOCs) to capitalize on this growing expenditure.
Medium-sized hubs present opportunities for disruptors offering modular platforms at costs 40% lower than traditional solutions, challenging incumbents that rely on proprietary hardware and long replacement cycles. The market is shifting toward software-driven ecosystems, where continuous upgrades, interoperability, and recurring revenue streams are becoming key drivers of sustainable competitive advantage.
Smart Airport Industry Leaders
Honeywell International Inc.
Cisco Systems, Inc.
Siemens AG
Thales Group
SITA N.V.
- *Disclaimer: Major Players sorted in no particular order

Recent Industry Developments
- October 2025: The Thales Group secured a EUR 120 million (approximately USD 140.63 million) contract for biometric border control systems as part of its overall development plan, which includes facial recognition. The deployment will consist of 300 e-gates, facial recognition, and iris scanning, which will be integrated into the airport's infrastructure as it is constructed and prepared for its 2030 opening.
- June 2025: Airbus Defence and Space signed a Memorandum of Understanding (MoU) with Cluster 2 to implement smart airport digital solutions in Saudi Arabia. The agreement includes the deployment of the Agnet Turnaround platform, designed for real-time operational coordination, to improve efficiency and performance across 22 airports in the country.
- March 2025: The UK Department for Transport (DfT) allocated EUR 0.45 million (USD 0.62 million) to six British technology companies for the development of innovative airport screening equipment. This investment, supported by airlines and airports, aims to enhance threat detection capabilities, minimize false alarms, and streamline passenger screening processes.
- December 2024: In Saudi Arabia, SITA and Red Sea International Airport (RSI) formed a strategic partnership to implement innovative airport systems in the Main Terminal Building. This collaboration builds on SITA's existing work at the Air Taxi Terminal, introducing integrated solutions for passenger processing, baggage handling, and automated check-in through mobile-enabled SITA Flex and Maestro systems.


Research Methodology Framework and Report Scope
Market Definitions and Key Coverage
Our study defines the smart airport market as the value of integrated hardware, software, and connected services that enable digital passenger processing, automated ground handling, data-driven airside operations, and intelligent landside facilities within commercial airports worldwide. Solutions range from biometric check-ins and IoT baggage tags to cloud-based air/ground traffic control decision platforms.
Scope Exclusions: stand-alone flight booking websites, non-integrated terminal advertising screens, and defense-only air-base systems remain outside our remit.
Segmentation Overview
- By Technology
- Security Systems
- Communication Systems
- Air and Ground Traffic Control
- Passenger, Cargo, Baggage, and Ground Handling
- Smart Retail and Hospitality Systems
- Smart Transport and Parking
- Airport Management Software (AMS) Platforms
- By Solution
- Hardware
- Software
- Services
- By Application
- Landside
- Airside
- Terminal Side
- By Airport Size
- Large
- Medium
- Small
- By Airport Technology
- Airport 2.0
- Airport 3.0
- Airport 4.0
- By Geography
- North America
- United States
- Canada
- Mexico
- Europe
- United Kingdom
- France
- Germany
- Italy
- Spain
- Rest of Europe
- Asia-Pacific
- China
- India
- Japan
- South Korea
- Rest of Asia-Pacific
- South America
- Brazil
- Rest of South America
- Middle East and Africa
- Middle East
- Saudi Arabia
- United Arab Emirates
- Qatar
- Rest of Middle East
- Africa
- South Africa
- Nigeria
- Rest of Africa
- Middle East
- North America
Detailed Research Methodology and Data Validation
Primary Research
To verify assumptions, our team interviewed airport CIOs in North America, Europe, and Asia-Pacific, tier-one system integrators, and ground-service unions. The conversations clarified real upgrade cycles, average smart-gate pricing, and regulatory bottlenecks, anchoring the secondary findings before numbers were locked.
Desk Research
Mordor analysts first built a factual spine with open datasets from bodies such as the International Civil Aviation Organization, Airport Council International, Eurocontrol, U.S. FAA Form 127, and UN Comtrade, which reveal passenger flows, flight movements, and import values for airport IT equipment. We then checked regional investment plans released by airport operators and ministries of transport, and reviewed peer-reviewed journals on aviation IoT security to gauge technology adoption curves. Subscription resources, including D&B Hoovers for company revenues and Dow Jones Factiva for contract announcements, gave spending clues that public filings miss. These sources, together with trade-association white papers and patent counts from Questel, shaped the baseline; many other references supported point validations and are not exhaustively listed here.
Market-Sizing & Forecasting
We reconstructed 2025 demand with a top-down build that starts from scheduled passenger numbers, average spend per traveler on smart-airport systems, and capex-to-opex splits, which are then cross-checked through selective bottom-up roll-ups of supplier revenues and airport project trackers. Key variables like passenger traffic growth, self-service kiosk penetration, mandated biometric gates per terminal, typical system life, and regional construction pipelines feed a multivariate regression that extends the view to 2030. Bottom-up gaps, such as undeclared retrofit budgets in smaller hubs, are bridged with analog airport benchmarks agreed in expert calls.
Data Validation & Update Cycle
Outputs pass three variance screens, colleague peer review, and a senior analyst sign-off. We refresh models each year and reopen them sooner if major stimuli, such as new IATA mandates, large stimulus bills, or disruptive cyber incidents, shift the demand curve. Every delivery therefore reflects the latest verified evidence.
Why Our Smart Airport Baseline Commands Reliability
Published figures vary because firms choose dissimilar scopes, base years, and traffic scenarios.
By aligning variables with real procurement patterns and updating them annually, Mordor Intelligence delivers a balanced, transparent baseline that decision-makers can retrace and reproduce with confidence.
Benchmark comparison
| Market Size | Anonymized source | Primary gap driver |
|---|---|---|
| USD 6.61 B (2025) | Mordor Intelligence | - |
| USD 9.53 B (2025) | Global Consultancy A | Includes broader airport ICT and ticketing platforms; limited primary validation of airport-specific spend |
| USD 8.40 B (2024) | Industry Journal B | Applies pre-COVID traffic multipliers without adjusting for staggered regional recovery |
| USD 3.51 B (2025) | Business Publisher C | Counts hardware only and assumes flat software subscription uptake |


Key Questions Answered in the Report
How fast is global adoption of biometric e-gates progressing?
Over 2,500 new e-gates will be installed in Europe alone by 2026, and large hubs in Asia-Pacific and the Middle East are now contracting multi-hundred-gate deployments that cut processing time to under 10 seconds.
Which region leads near-term growth?
Asia-Pacific posts the highest 11.90% CAGR through 2031, propelled by greenfield megaprojects in China, India, and Saudi Arabia that embed Airport 4.0 designs from inception.
What role do services play in future budgets?
Services, including managed cybersecurity and predictive-maintenance contracts, are expanding at 12.29% CAGR as operators prefer opex models that lower upfront spending by up to 50%.
How are airports monetizing non-aeronautical revenue?
Data-driven retail analytics lift per-passenger spending by 10–15% by tailoring offers to real-time dwell-time and destination data.
What is the biggest operational risk?
Cybersecurity remains the chief risk; the 2024 Seattle-Tacoma ransomware attack halted operations for five days and pushed insurance premiums up 15–25%.
Why are medium airports outpacing large hubs?
Modular cloud platforms let medium airports deploy 70–80% of enterprise functionality at half the capital cost, supporting 11.70% CAGR through 2031.
Page last updated on:


