
Singapore Solid Waste Management Market Size and Share
Market Overview
| Study Period | 2020 - 2031 |
|---|---|
| Forecast Data Period | 2026 - 2031 |
| Base Year Market Size (2025) | USD 3.25 Billion |
| Market Size (2026) | USD 3.55 Billion |
| Market Size (2031) | USD 5.55 Billion |
| Growth Rate (2026 - 2031) | 9.34 % |
| Market Concentration | Medium |
Major Players *Disclaimer: Major Players sorted in no particular order Image © Mordor Intelligence. Reuse requires attribution under CC BY 4.0. | |
Singapore Solid Waste Management Market Analysis by Mordor Intelligence
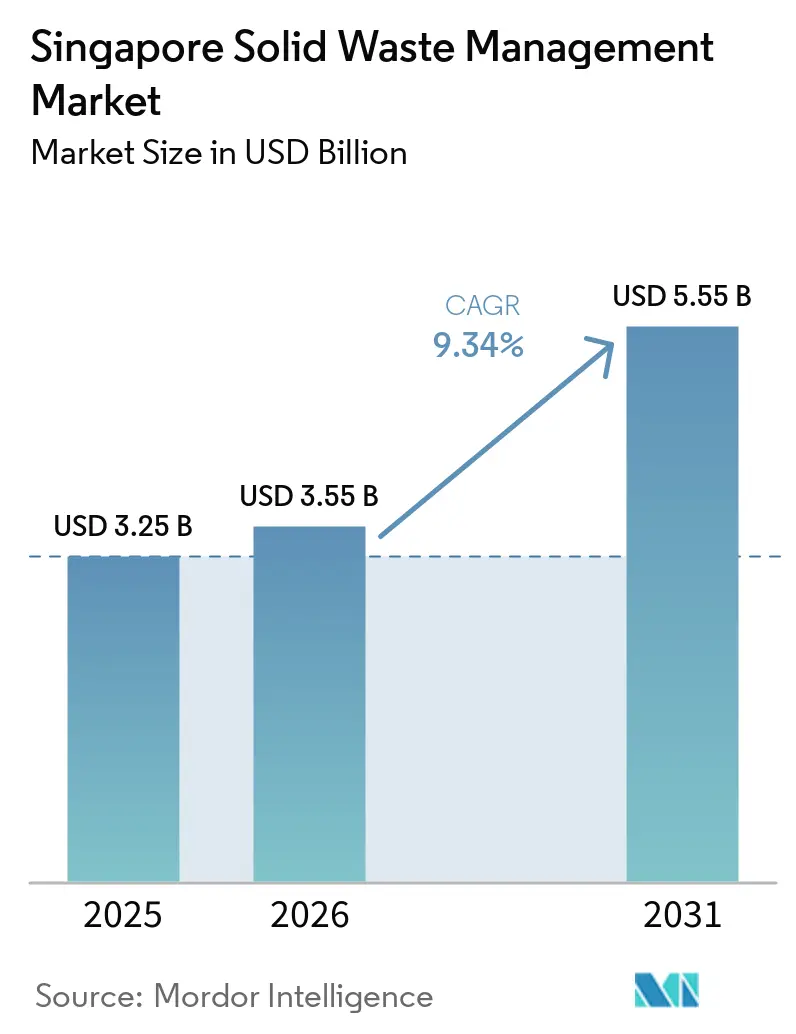
The Singapore Solid Waste Management Market size is expected to increase from USD 3.25 billion in 2025 to USD 3.55 billion in 2026 and reach USD 5.55 billion by 2031, growing at a CAGR of 9.34% over 2026-2031.
The Singapore solid waste management market faces a clear capacity constraint because Semakau Landfill is the country’s only disposal site and is expected to reach capacity by 2035 under current disposal patterns. Singapore disposed of 3.36 million tons of waste in 2025, with an overall recycling rate of 52% and a domestic recycling rate of 11%. This difference points to a need for better sorting, material recovery, and logistics rather than a simple expansion of collection capacity. The progressive commissioning of Tuas Nexus from mid-2026 adds a major integrated facility for waste treatment, resource recovery, food waste processing, and sludge treatment. In the Singapore solid waste management market, operators with regulated collection rights, licensed treatment capacity, and material recovery capabilities are better placed to respond to this change than stand-alone collection providers.
Key Report Takeaways
- By service type, treatment and disposal held 49.7% of the Singapore solid waste management market share in 2025, while recycling and material recovery is forecast to grow at an 11.2% CAGR through 2031.
- By waste type, industrial waste accounted for 40.2% of the Singapore solid waste management market size in 2025, while hazardous waste is forecast to grow at an 11.5% CAGR through 2031.
- By source, the industrial sector accounted for 46% of the Singapore solid waste management market in 2025, while the commercial sector is forecast to grow at a 10.4% CAGR through 2031.
Note: Market size and forecast figures in this report are generated using Mordor Intelligence’s proprietary estimation framework, updated with the latest available data and insights as of January 2026.
Singapore Solid Waste Management Market Trends and Insights
Drivers Impact Analysis*
| Driver | (~) % Impact on CAGR Forecast | Geographic Relevance | Impact Timeline |
|---|---|---|---|
| Semakau Landfill Capacity Optimization Driving Waste Diversion Strategies | +2.5% | Singapore, with major relevance to Tuas and Jurong Island | Short term (≤ 2 years) |
| Tuas Nexus Integrated Facility Reshaping Singapore's Waste Infrastructure | +2.2% | Singapore, concentrated in the Tuas View Basin | Medium term (2-4 years) |
| National E-Waste Collection Network Strengthening Resource Recovery | +1.8% | Singapore, with high-yield nodes in HDB estates and commercial districts | Medium term (2-4 years) |
| High-Density Urban Development Increasing Demand for Automated Waste Conveyance Systems | +1.5% | Singapore, especially Tengah, Punggol, Sengkang, Yishun, and Tampines | Medium term (2-4 years) |
| Green Public Procurement Expanding Demand for Recycled Materials | +1.0% | Singapore, primarily in large construction and ICT tenders | Long term (≥ 4 years) |
| Marine and Port Activities Generating Specialized Industrial Waste Management Requirements | +0.8% | Port of Singapore, Tuas Marine Transfer Station, Jurong Port, and Sembawang Shipyard | Short term (≤ 2 years) |
| Source: Mordor Intelligence | |||
Semakau Landfill Capacity Optimization Driving Waste Diversion Strategies
Semakau Landfill remains the strongest driver for the Singapore solid waste management market because it is the country’s only landfill. The landfill has a total capacity of 28 million cubic meters and has reached the halfway point in cumulative fill.[1]Ministry of Sustainability and the Environment, “Written Reply to Parliamentary Question on Projected Lifespan of Semakau Landfill,” Ministry of Sustainability and the Environment, mse.gov.sg. Singapore disposed of 1.67 million tons of domestic waste and 1.69 million tons of non-domestic waste in 2025. Singapore had a target to reduce daily per-capita waste sent to landfill by 20% by 2026; progress toward this target remained an ongoing policy priority. This strengthens the position of providers that can divert materials through recovery, food waste treatment, or construction and demolition recycling. NEA, the Maritime and Port Authority of Singapore, and the National University of Singapore are studying whether recovered landfill ash can be processed as reclamation fill for Tuas Port Phase 3, which could change ash handling and marine logistics over time.
Tuas Nexus Integrated Facility Reshaping Singapore’s Waste Infrastructure
Tuas Nexus is being developed in phases, with Phase 1 of the Integrated Waste Management Facility expected to be completed progressively from 2027 onwards.[2] Singapore Government, “Country Update on the Implementation of the Basel Convention,” Singapore Government, env.go.jp. Phase 1 comprises a 2,900 tpd WTE facility, 250 tpd MRF, 400 tpd food-waste treatment facility, and 800 tpd sludge incineration facility. Its co-location with the Tuas water reclamation plant allows energy to be shared across the two facilities. The project sets up a scheduled demand base for food waste collection and treatment as regulated premises come into compliance. In the Singapore solid waste management market, route design, collection contracts, and sorting investment will increasingly need to align with the facility’s intake requirements. The engineering contract was awarded to Keppel Seghers Engineering Singapore, China Harbour Singapore Engineering Company, and ST Engineering Marine, demonstrating the breadth of expertise required for the project.
National E-Waste Collection Network Strengthening Resource Recovery
Singapore’s e-waste producer responsibility system has created a regulated channel for collection and recycling since July 2021. ALBA E-Waste Smart Recycling served as the Producer Responsibility Scheme operator from 2021 to June 2026. Updated Basel Convention controls took effect in Singapore in January 2025 and require Prior Informed Consent for cross-border movements of covered e-waste.[3]National Environment Agency, “Singapore’s Waste Generation Continues Its Downward Trend,” National Environment Agency, nea.gov.sg. These controls raise the importance of licensed handling and reduce the scope for informal export routes. Research at NTU’s Singapore-CEA Alliance for Research in Circular Economy is developing methods to recover rare earth elements, tantalum, and platinum group metals from printed circuit boards. This work may support higher-value resource recovery as the technology moves beyond research use.
High-Density Urban Development Increasing Demand for Automated Waste Conveyance Systems
More than 80% of Singapore’s resident population lives in HDB flats, creating a concentrated operating environment for automated waste collection. Pneumatic waste conveyance systems use underground vacuum pipes to move sealed waste to central compaction stations. These systems operate in HDB precincts across Tengah, Punggol, Sengkang, Yishun, Tampines, and other estates. The government bears most of the infrastructure costs and provides a monthly SGD 2 (USD 1.5) grant per dwelling unit to town councils in participating precincts. This support reduces the operating risk associated with district-scale collection systems. In the Singapore solid waste management market, these systems can provide recurring operations and maintenance work that is less exposed to recycled commodity prices.
Restraints Impact Analysis*
| Restraint | (~) % Impact on CAGR Forecast | Geographic Relevance | Impact Timeline |
|---|---|---|---|
| Limited Domestic Market Restricting Economies of Scale for Recycling Investments | -2.0% | Singapore, especially paper, plastics, and packaging recycling | Medium term (2-4 years) |
| Stringent Ash Disposal Requirements Following Waste Incineration | -1.5% | Singapore, affecting waste-to-energy plants and Semakau barge logistics | Medium term (2-4 years) |
| Dependence on Imported Recycling Technologies Increasing Capital Costs | -1.0% | Singapore, with cost exposure in waste-to-energy, material recovery, and advanced sorting | Long term (≥ 4 years) |
| Minimal Land Buffer for Emergency Waste Storage During Peak Generation Events | -0.7% | Singapore, with the greatest exposure in Tuas and Jurong | Short term (≤ 2 years) |
| Source: Mordor Intelligence | |||
Limited Domestic Market Restricts Economies of Scale for Recycling Investments
Singapore’s small domestic market limits the scale of many recycling investments. Most recovered paper, cardboard, and plastics must be exported for further processing because local reprocessing capacity is limited. NEA linked the lower paper and cardboard recycling in 2025 to collection costs, freight pressures, and global commodity price volatility. MSE has also stated that manufacturers are unlikely to redesign products solely for Singapore because of the country’s small market size. This affects the returns available to local recyclers and limits the upstream product design effect available in larger markets. It also helps explain why domestic recycling remained at 11% in 2025 despite household recycling participation reaching 78%. Singapore also depends on overseas engineering and equipment for advanced waste treatment and recovery: the Tuas Nexus delivery consortium combined European environmental engineering, Chinese construction, and local marine integration capabilities. NEA sought information in 2025 on technologies that could reduce emissions and landfill residues from mixed municipal solid waste. Imported systems can raise capital costs and extend payback periods in a single-city operating environment. NEA’s standards for NEWSand, which reuses treated incineration bottom ash as a construction aggregate, support local circularity but still require specialized processing and testing. The Singapore solid waste management market consequently remains exposed to the cost and availability of external technology.
Stringent Ash Disposal Requirements and Minimal Storage Buffer
Waste-to-energy reduces waste volume by up to 90%, but it does not eliminate the need to manage incineration ash. Ash is transferred by barge to Semakau Landfill through the Tuas Marine Transfer Station. This adds handling, transport, and disposal requirements to treatment operations. Toxic industrial waste residues, including fly ash and treatment sludge, must meet Toxicity Leaching Acceptance Parameters before disposal. These rules protect environmental controls but increase the cost floor for operators. They also limit low-cost entry in regulated treatment activities. Singapore has little spare land for emergency waste storage during periods of high waste generation. The constraint is most relevant in the Tuas and Jurong industrial corridors, where waste treatment, logistics, manufacturing, and port activity are concentrated. A disruption in collection, treatment, or barge movements can therefore create an immediate operating issue. This reinforces the need for dependable routing, treatment capacity, and storage planning across the Singapore solid waste management market. It also favors operators with established facilities and proven contingency procedures. The country’s compact geography makes resilience a practical requirement rather than a secondary service feature.
*Our forecasts treat driver/restraint impacts as directional, not additive. The impact forecasts reflect baseline growth, mix effects, and variable interactions.
Segment Analysis
By Service Type: Treatment and Energy Recovery Anchor Market Value
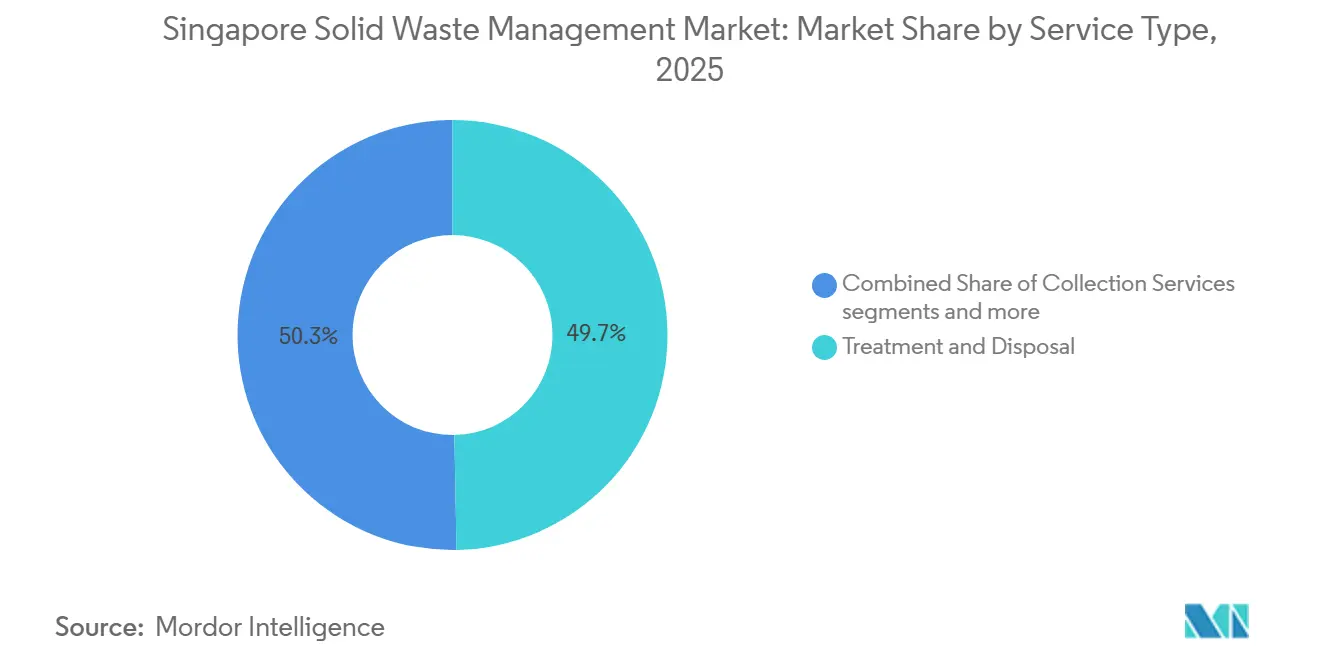
Treatment and disposal held 49.7% of the Singapore solid waste management market share in 2025 because Singapore relies on waste-to-energy treatment before final disposal. The country’s five incineration plants process much of the unsegregated municipal and commercial waste, reducing its volume by up to 90% before the ash is sent to the Semakau Landfill. This reliance reflects limited land availability for conventional landfill disposal. The Singapore solid waste management market size for this service category is driven more by essential treatment demand than by discretionary spending. Tuas Nexus strengthens this position by adding a major waste-to-energy facility starting mid-2026. Collection services, transportation, and logistics remain important, but regulated tenders strongly shape their pricing and contract conditions.
Recycling and material recovery are forecast to grow at an 11.2% CAGR through 2031. E-waste producer-responsibility requirements, food-waste segregation rules, and the Beverage Container Return Scheme support its growth. The scheme began on April 1, 2026, and uses a refundable SGD 0.10 (USD 0.08) deposit for eligible plastic and metal beverage containers ranging from 150 milliliters to three liters. More than 1,000 return points create a separate channel for cleaner, recyclable material. The Singapore solid waste management market will continue to face export and commodity exposure to non-regulated recyclables. The others category, including specialist decontamination, on-site treatment, and hazardous waste handling, can grow alongside semiconductor and pharmaceutical activity.



By Waste Type: Industrial Streams Define Scale, Hazardous Waste Sets Growth Pace
Industrial waste accounted for 40.2% of the Singapore solid waste management market size in 2025. Jurong Island, Tuas, and semiconductor manufacturing sites produce high volumes of waste that require controlled collection and disposal routes. Large industrial premises achieved a 55.2% recycling rate in 2024 under NEA’s mandatory waste reporting framework. This result shows that industrial generators already operate within more formal waste management systems than many smaller premises. The largest segment’s role in the Singapore solid waste management market is therefore linked to both volume and compliance. Its demand base includes petrochemicals, refining, logistics, and advanced manufacturing.
Hazardous waste is forecast to grow at an 11.5% CAGR through 2031. Semiconductor fabrication, pharmaceutical manufacturing, and regulated e-waste residues drive demand for specialist services. Toxic industrial waste rules require licensed collectors and verified handling before disposal. Municipal solid waste remained significant, although domestic waste per person fell to 0.83 kilograms in 2025 from 0.85 kilograms in 2024. Construction and demolition materials have historically had a high recycling rate, whereas agricultural waste recycling remains low due to Singapore's limited agricultural land. Medical waste follows prescribed incineration requirements, and hazardous waste commands a more specialized service need than ordinary collection.
By Source: Commercial Sector at an Inflection Point, Industrial Base Anchors Volume
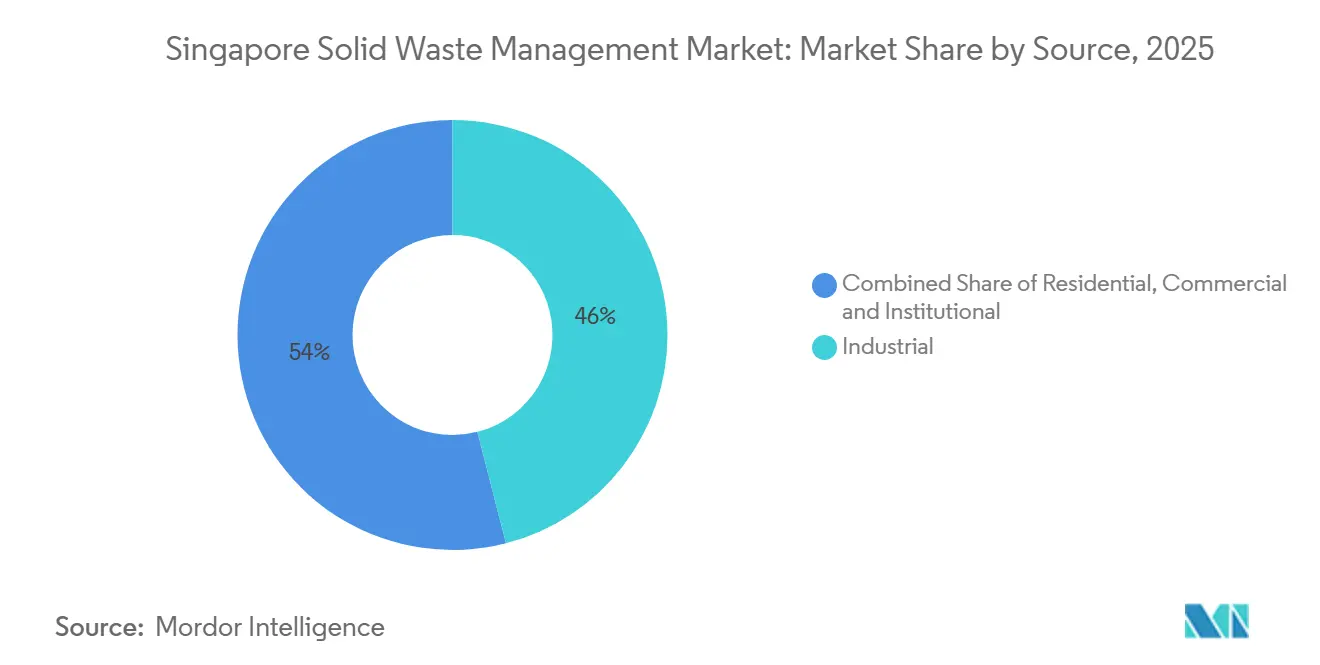
Industrial sources accounted for 46% of the Singapore solid waste management market in 2025. Manufacturing, petrochemical, and logistics activity is concentrated in western industrial zones. Qualifying premises must measure, report, and plan for waste reduction under Singapore’s mandatory waste reporting system. This brings more industrial waste volumes into formal tracking and service arrangements. The industrial base anchors demand across the Singapore solid waste management market. It also supports predictable requirements for collection, treatment, and licensed disposal.
Commercial sources are forecast to grow at a 10.4% CAGR through 2031. Food waste segregation requirements have applied to new large commercial and industrial buildings since March 2024. The recycling rate for large hotels rose from 9.4% in 2023 to 11.2% in 2024, while the rate for large malls rose from 12.1% to 13.3%. Residential waste is managed mainly through public collection, and household recycling participation reached 78% in 2025. Institutional sources include schools, government buildings, and community facilities, where waste management is largely driven by compliance. The Beverage Container Return Scheme may reduce contamination by collecting containers through a dedicated return path.
Geography Analysis
Singapore’s overall recycling rate was 52% in 2025, with the non-domestic rate at 67% and the domestic rate at 11%. The Singapore solid waste management market operates within a 733-square-kilometer city-state with a resident population of 5.9 million. HDB estates house more than 80% of residents, while Jurong Island and the Tuas corridor contain petrochemical, semiconductor, logistics, and treatment infrastructure. The western corridor creates the highest concentration of industrial and hazardous waste requirements. The Central Business District and Orchard generate commercial waste, while port areas have specialized needs for marine waste. Non-domestic waste generated per billion dollars of GDP declined by more than 30% over the past decade, and domestic waste per person declined by 21% over the same period.
The Singapore solid waste management market is distinct within Asia-Pacific because regulation and territorial limits matter more than population scale. Singapore must manage waste within its compact national boundaries and cannot rely on cross-border landfill solutions. This condition supports high investment intensity in treatment, energy recovery, and materials management. Regulated public collection is concentrated among licensed operators serving defined geographic sectors. That structure differs from the more fragmented contractor base for general and hazardous waste, as well as specialist recycling. The compact footprint also allows new collection and recovery systems to be tested across dense residential and commercial districts.
The Tuas Marine Transfer Station is an important geographic link, as it transports incineration ash to the Semakau Landfill by barge. This offshore landfill configuration creates a continuing need for marine waste logistics. Research into recovering landfilled ash for use as reclamation fill at Tuas Port Phase 3 could change the long-term handling of ash. Tuas Nexus further concentrates treatment and resource recovery capacity in the western part of the country. Residential zones remain important for collection and behavior programs, but commercial and industrial zones have stronger reporting and compliance leverage. These differences explain why recovery outcomes are substantially stronger outside the domestic waste stream.
Competitive Landscape
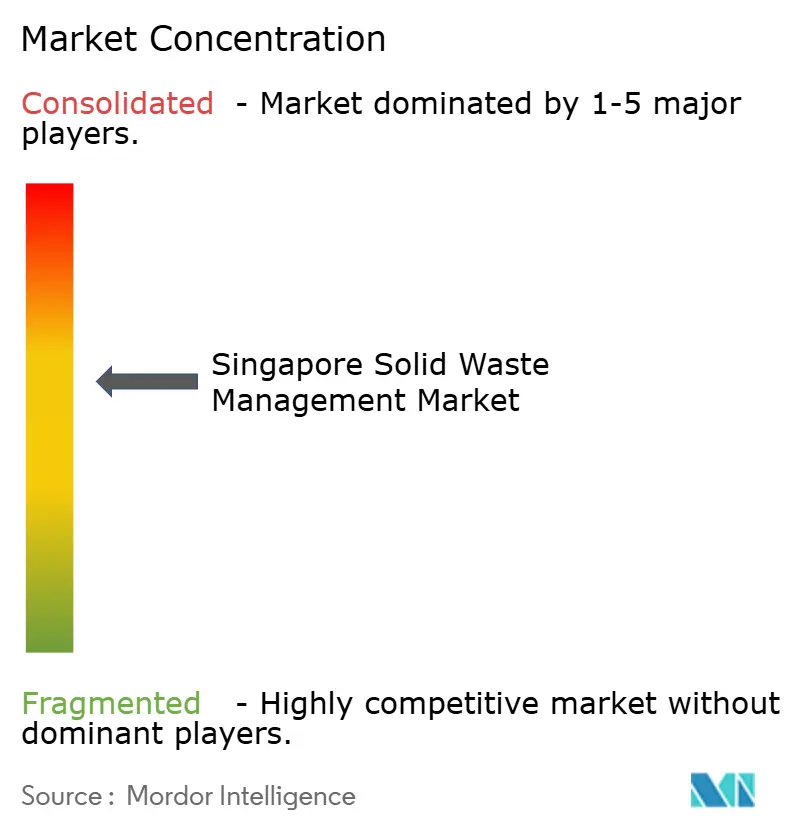
The Singapore solid waste management market exhibits a medium level of market concentration. ALBA W&H Smart City, 800 Super, and Cora Environment are the three public waste collectors licensed by NEA. Public waste collection licenses cover defined sectors and generally run for seven to eight years, making service quality and regulatory compliance central to competition. Actis completed its acquisition of 800 Super in March 2026 at an enterprise valuation exceeding SGD 600 million (USD 459.1 million). The transaction reflects investor interest in long-term contracted environmental services. TBS Energi Utama completed the acquisition of Sembcorp Environment in March 2025 for SGD 405 million (USD 209.9 million), and the business was subsequently rebranded as Cora Environment.
Established operators compete by integrating collection, treatment, recycling, and data services. Cora Environment committed USD 200 million over five years for operations upgrades, facility modernization, waste data analytics, and its Closed-Loop Partners Network. Actis’s investment in 800 Super supports a collection, recycling, and environmental services platform with government-linked contracts. ALBA W&H Smart City reported 500,000 kilometers of zero-tailpipe-emission operation by its Scania battery-electric collection fleet in September 2025. These investments indicate growing emphasis on fleet efficiency, digital data, and closed-loop processing. NEA licensing and the Resource Sustainability Act obligations create barriers to entry in regulated streams.
Specialist providers can compete by focusing on hazardous waste, critical metal recovery, semiconductor waste, or district-scale automated collection. NEA awarded three food valorization proposals through its CTRL Funding Initiative in 2025, supporting development in food waste treatment. NTU has developed multi-energy X-ray sorting technology for e-waste, which may support specialized recovery models. Opportunities also exist in pneumatic collection for mixed-use townships and digital material data services for commercial buildings. The Singapore solid waste management market remains concentrated in public collection but is more dispersed in specialist services.
Singapore Solid Waste Management Industry Leaders
800 Super Waste Management Pte Ltd.
ALBA W&H Smart City Pte. Ltd.
CORA Environment Pte. Ltd.
Veolia ES Singapore Pte. Ltd.
Colex Environmental Pte Ltd.
- *Disclaimer: Major Players sorted in no particular order

Recent Industry Developments
- July 2026: NEA’s new Public Waste Collection licence for the Zone 6 Pasir Ris-Bedok sector commenced, awarded to 800 Super Waste Management Pte for July 2026 to June 2033. The contract covers 209,000 households and more than 8,200 trade premises, and includes 69 refuse and recycling trucks, of which 18 are electric rear-end loaders.
- April 2026: Singapore’s Beverage Container Return Scheme launched on April 1 under the Resource Sustainability Beverage Container Return Scheme Regulations 2026. The program provides a SGD 0.10 (USD 0.08) refundable deposit for covered beverage containers and operates through more than 1,000 return points.
- March 2025: TBS Energi Utama completed the acquisition of Sembcorp Environment Pte. Ltd. for SGD 405 million (USD 309.9 million). The business was subsequently rebranded as Cora Environment.


Singapore Solid Waste Management Market Report Scope
The Singapore Solid Waste Management Market is Segmented by Service Type (Collection Services, Transportation & Logistics, Recycling & Material Recovery, Treatment & Disposal, and More), by Waste Type (Municipal Solid Waste, Industrial Waste, Hazardous Waste, Agricultural Waste, and More), and by Source (Residential, Commercial, Industrial, and Institutional). The Market Forecasts are Provided in Terms of Value (USD).
| Collection Services |
| Transportation & Logistics |
| Recycling & Material Recovery |
| Treatment & Disposal |
| Waste-to-Energy |
| Others |
| Municipal Solid Waste |
| Industrial Waste |
| Hazardous Waste |
| Construction & Demolition Waste |
| Agricultural Waste |
| Medical Waste |
| Others |
| Residential |
| Commercial |
| Industrial |
| Institutional |
| By Service Type | Collection Services |
| Transportation & Logistics | |
| Recycling & Material Recovery | |
| Treatment & Disposal | |
| Waste-to-Energy | |
| Others | |
| By Waste Type | Municipal Solid Waste |
| Industrial Waste | |
| Hazardous Waste | |
| Construction & Demolition Waste | |
| Agricultural Waste | |
| Medical Waste | |
| Others | |
| By Source | Residential |
| Commercial | |
| Industrial | |
| Institutional |


Key Questions Answered in the Report
What is the forecast for Singapore solid waste management services?
The Singapore solid waste management market is forecast to reach USD 5.55 billion by 2031 from USD 3.25 billion in 2025, at a 9.34% CAGR. Landfill capacity pressure and the expansion of integrated treatment capacity support this outlook.
Why is Semakau Landfill important to waste service providers?
Semakau is Singapore’s only landfill and is expected to reach capacity by 2035 under current disposal patterns. This creates a direct need for diversion, treatment, recovery, ash management, and reliable waste logistics.
Which service area is expanding the fastest in Singapore?
Recycling and Material Recovery is the fastest-growing service area, registering an 11.20% CAGR through 2026-2031. E-waste producer responsibility rules, food waste segregation, and the Beverage Container Return Scheme are expanding regulated recovery channels.
What does Tuas Nexus add to Singapore’s waste system?
Phase 1 adds 5,800 tons per day of waste-to-energy capacity, 250 tons per day of materials recovery capacity, 400 tons per day of food waste treatment capacity, and 800 tons per day of sludge incineration capacity. The facility began progressive commissioning in mid-2026.
Who collects public waste in Singapore?
ALBA W&H Smart City, 800 Super, and Cora Environment are NEA-licensed public waste collectors. Their licenses cover defined sectors, while specialist contractors compete in other waste streams.
How does the Beverage Container Return Scheme affect recycling?
The scheme introduced a SGD 0.10 (USD 0.08) refundable deposit and more than 1,000 return points for eligible beverage containers. It is designed to return cleaner plastic and metal containers to recycling channels and reduce contamination from mixed collection.
Page last updated on:


 Your data is secure and never sold or shared.


