Market Overview
| Study Period | 2021 - 2031 |
|---|---|
| Forecast Data Period | 2026 - 2031 |
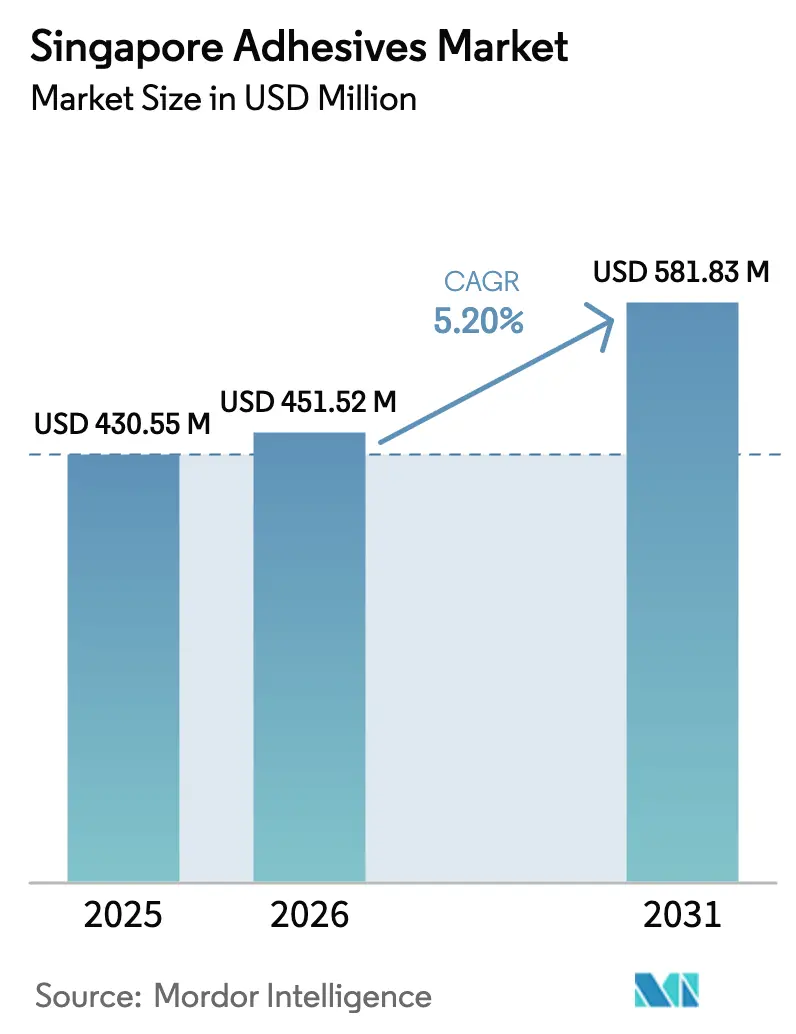
| Base Year Market Size (2025) | USD 430.55 Million |
| Market Size (2026) | USD 451.52 Million |
| Market Size (2031) | USD 581.83 Million |
| Growth Rate (2026 - 2031) | 5.20% CAGR |
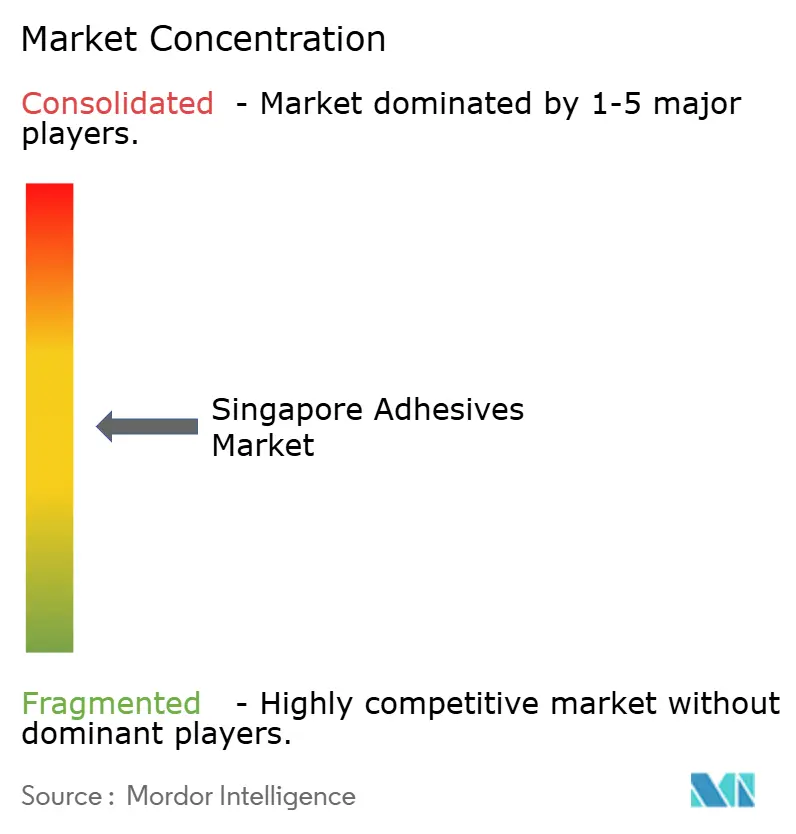
| Market Concentration | Medium |
Major Players *Disclaimer: Major Players sorted in no particular order Image © Mordor Intelligence. Reuse requires attribution under CC BY 4.0. | |
Singapore Adhesives Market Analysis by Mordor Intelligence
The Singapore Adhesives Market size was valued at USD 430.55 million in 2025 and is estimated to grow from USD 451.52 million in 2026 to reach USD 581.83 million by 2031, at a CAGR of 5.20% during the forecast period (2026-2031). Demand concentrates in Singapore’s tightly integrated supply ecosystem, which spans advanced electronics, omnichannel packaging, sustainable construction, and biomedical devices. Infrastructure programs such as the Land Transport Master Plan 2040, with a SGD 24.7 billion (USD 18.3 billion) budget for rail stations and priority-transit corridors, reinforce construction-related adhesive consumption. Tightened volatile-organic-compound limits, starting with the January 2026 formaldehyde ban in interior paints, boost technology shifts toward low-emission, water-borne, and UV-cured chemistries. Packaging maintains top end-user share as Southeast Asian e-commerce parcel volumes swell, while medical-device factories in Biopolis and Tuas accelerate uptake of ISO 10993-compliant cyanoacrylates that cure in less than 30 seconds. Competitive intensity stays high: the top 30 global players hold roughly half of worldwide revenue, inviting bolt-on acquisitions that target sustainable chemistries and regional production footholds.
Key Report Takeaways
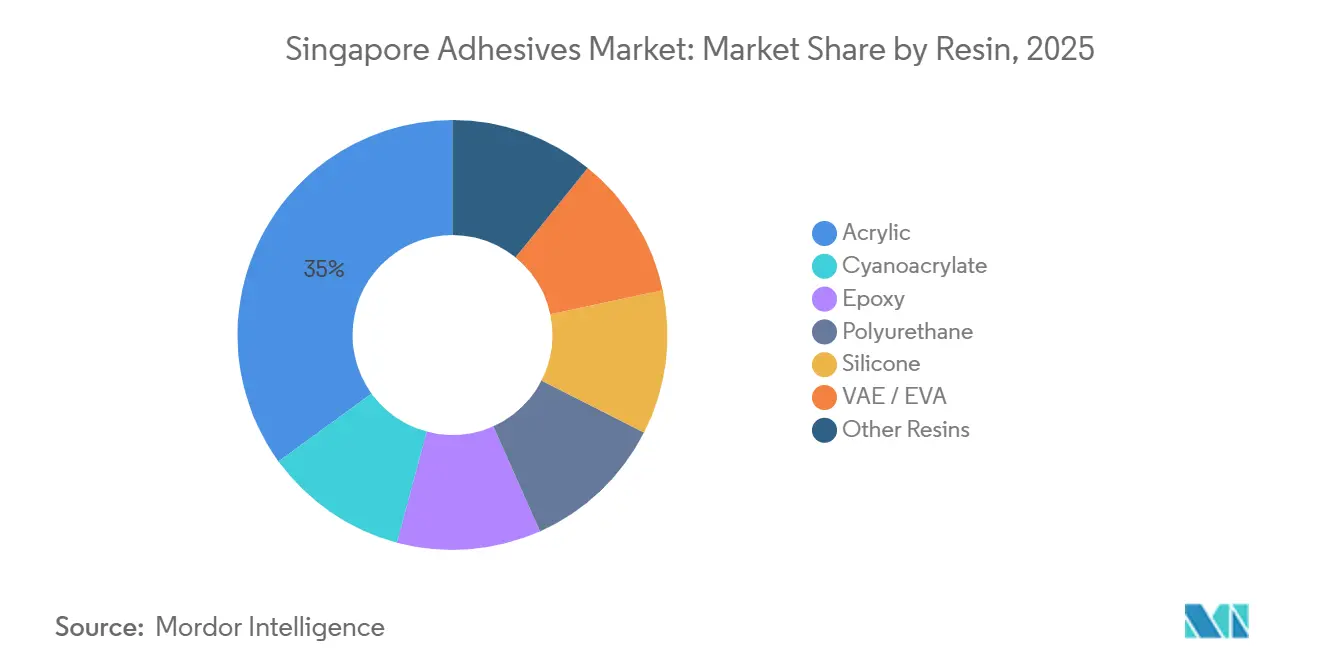
- By resin, acrylic products held 35% of 2025 revenue; cyanoacrylates are forecast to register the quickest 6.56% CAGR between 2026 and 2031.
- By technology, water-borne systems commanded 42.25% of 2025 sales; UV-cured formulations are set to expand at a 6.71% CAGR during 2026-2031.
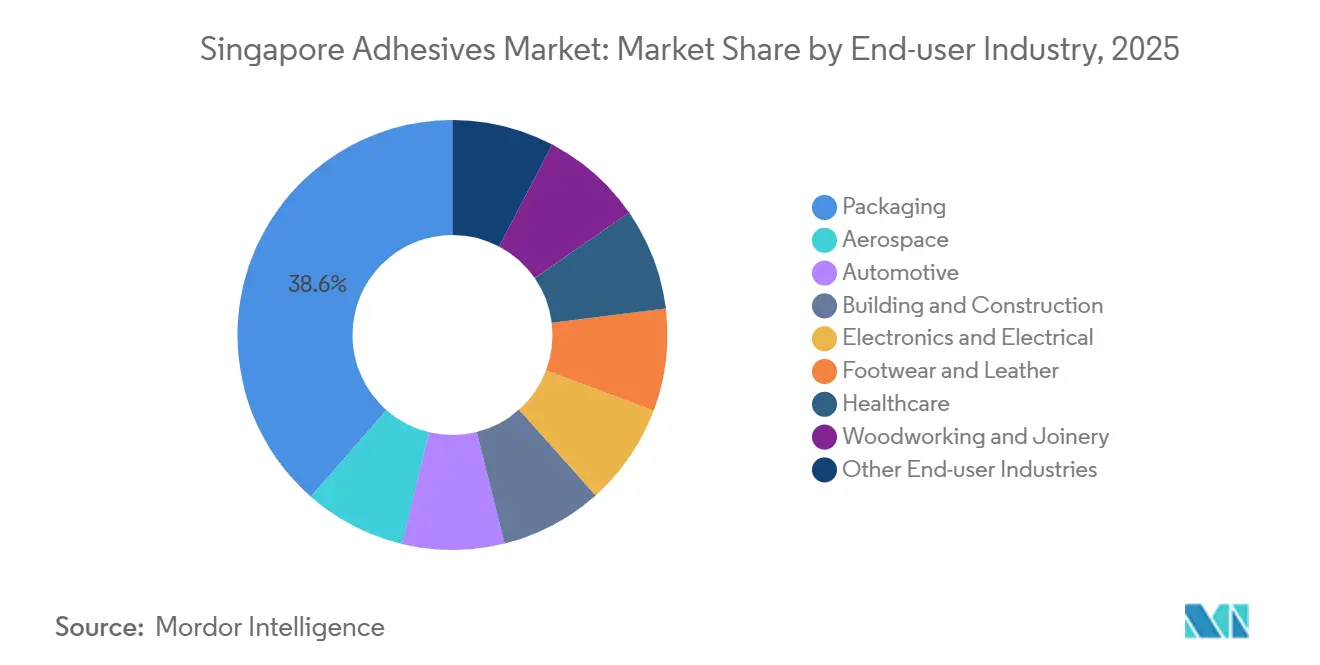
- By end-user industry, packaging led with a 38.55% share of the Singapore adhesives market in 2025, while healthcare is projected to post the fastest 6.34% CAGR through 2031.
Note: Market size and forecast figures in this report are generated using Mordor Intelligence’s proprietary estimation framework, updated with the latest available data and insights as of January 2026.
Singapore Adhesives Market Trends and Insights
Drivers Impact Analysis*
| Drivers | (~) % Impact on CAGR Forecast | Geographic Relevance | Impact Timeline |
|---|---|---|---|
| Growing demand from packaging sector | +1.2% | Singapore (regional fulfillment hub), spillover to Malaysia and Indonesia | Medium term (2–4 years) |
| Government push for sustainable building materials | +0.9% | National, with concentration in urban redevelopment zones | Long term (≥4 years) |
| Expansion of electronics manufacturing hub | +1.5% | Singapore core, supporting APAC semiconductor supply chain | Long term (≥4 years) |
| Infrastructure repair and upgrades | +0.8% | National, early gains in MRT expansion corridors | Medium term (2–4 years) |
| Rise of biomedical device adhesives clusters | +0.6% | Singapore biopolis and Tuas biomedical park precincts | Long term (≥4 years) |
| Source: Mordor Intelligence | |||
Growing Demand from Packaging Sector
Global parcel traffic is expected to hit 266 billion shipments in 2026, and Singapore’s role as a regional fulfillment node channels much of that flow through Changi Airport and the Port of Singapore. Automated right-sized packaging lines now substitute hot-melt adhesives for tape, cutting material waste and parcel cube while enabling recycling-stream compatibility[1]Henkel AG & Co. KGaA, “Technomelt E-COM Bio-Based Hot Melts,” henkel.com. Henkel’s Technomelt E-COM G5 Eco Cool exemplifies bio-based, low-temperature hot melts certified for paper recycling streams, aligning with brand owners’ carbon-reduction pledges. Arkema’s 2024 purchase of Dow’s USD 250 million flexible-packaging laminating business injects fresh capacity for food-grade and medical films, both of which draw on Singapore’s export-oriented pharma supply chain[2]Arkema SA, “Bostik Finalizes Dow’s Flexible-Packaging Adhesive Acquisition,” arkema.com. Collectively, packaging’s 38.55% revenue share in 2025 already reflects a pivot toward higher-margin sustainable solutions that tamp down shipping emissions and total-cost-of-ownership.
Government Push for Sustainable Building Materials
The Building and Construction Authority’s Green Mark scheme and the Singapore Green Building Council’s product-certification framework now elevate eco-labeled adhesives in tender documents. Sika’s Davco Block Bond ECO and Davco TTB ECO have secured local ecolabels based on recycled content and low embodied carbon. NEA’s 2026 formaldehyde ban in paints signposts forthcoming limits on engineered-wood and laminate adhesives, reinforcing the 42.25% water-borne technology share recorded in 2025. Steady 4.1% construction-sector CAGR through 2028, coupled with SGD 24.7 billion in planned rail outlays, sustains demand for tile bonding, structural agents, and sealants that pass Green Mark thresholds.
Expansion of Electronics Manufacturing Hub
Henkel relocated its Southeast Asia Electronic Adhesives Technical Centre to Geneo at Singapore Science Park in January 2026, establishing the region’s largest application-engineering lab for die attach, underfill, and capillary flow testing. The lab participates in ASTAR’s photonics-chiplet consortium, co-engineering thermal and underfill materials for advanced AI packages that exceed 100 × 100 mm with more than 2,000 interconnects. Tesa’s February 2026 “Debonding on Demand” facility with ASTAR pursues adhesives that release on command, bolstering circular-economy mandates. Electronics may not be the fastest-growing end user, but its complex requirements drive premium research and development and reinforce Singapore’s position as a regional prototyping node.
Infrastructure Repair and Upgrades
Land Transport Master Plan 2040 commits SGD 24.7 billion (USD 18.3 billion) for new stations, track beds, and transit corridors, all of which specify structural epoxies, tile adhesives, and sealants able to meet shear strengths from 15 MPa to 35 MPa across 100 °C service windows. Sika’s highly automated mortar plant in Singapore trims delivery lead times for repair mortars, an advantage when shutdown windows on MRT lines are measured in hours. Sustainability targets within the Singapore Green Plan 2030 require lower-carbon materials, so contractors increasingly shortlist formulations with EPDs and VOC data.
Restraints Impact Analysis*
| Restraints | (~) % Impact on CAGR Forecast | Geographic Relevance | Impact Timeline |
|---|---|---|---|
| Volatility in raw-material prices | -1.1% | Global, acute impact on Singapore importers due to freight exposure | Short term (≤2 years) |
| Stringent VOC and chemical regulations | -0.7% | National, with spillover compliance costs for regional exporters | Medium term (2–4 years) |
| Competition from mechanical fasteners in construction | -0.4% | National, concentrated in renovation and retrofit segments where labor costs favor traditional fastening | Medium term (2–4 years) |
| Source: Mordor Intelligence | |||
Volatility in Raw-Material Prices
Spot prices for 2-ethylhexyl acrylate jumped 53% in March 2026, mirroring crude-oil shocks that also lifted propylene 42% in CFR Southeast Asia, squeezing margins for adhesive formulators that import most feedstocks. Wacker Chemie responded with global price hikes on polymer dispersions effective April 2026, citing supply-chain disruptions. Because raw materials represent around half of total production cost, Singapore-based converters either pass along surcharges or risk margin erosion, while some contractors revert to mechanical fasteners when adhesive prices exceed budget caps.
Stringent VOC and Chemical Regulations
The NEA bans interior paints containing ≥ 0.01% formaldehyde by weight and lists PFOA, PFHxS, and PFOS at zero-kilogram thresholds under the Environmental Protection and Management Act. Adhesive suppliers must therefore requalify PFAS-free surfactants and meet RoHS limits of 1,000 ppm for lead and 100 ppm for cadmium in controlled EEE categories. Reformulation cycles can take up to two years, disadvantaging smaller firms without in-house compliance labs, while multinationals amortize testing across global portfolios.
*Our forecasts treat driver/restraint impacts as directional, not additive. The impact forecasts reflect baseline growth, mix effects, and variable interactions.
Segment Analysis
By Resin: Acrylic Dominance Meets Cyanoacrylate Velocity
Acrylics held 35% of revenue in 2025, buoyed by pressure-sensitive labels for pharmaceuticals and clear construction sealants. Cyanoacrylates, though a smaller base, are slated for a 6.56% CAGR on the back of sub-30-second fixture times demanded in wearable biosensors. Premium grades such as H.B. Fuller’s SurgiSeal combine antimicrobial efficacy with skin flexibility, fetching higher margins. Epoxies and polyurethanes retain specification in structural bonding but must adapt to low-emission mandates by shifting toward pre-polymerized isocyanates and bio-based polyols.


By Technology: Water-Borne Leadership, UV-Cured Acceleration
Water-borne systems accounted for 42.25% of 2025 revenue as Green Mark and LEED projects dominate commercial real estate. UV-cured products, however, will log the fastest 6.71% CAGR as they enable solvent-free processing for MEMS sensors and camera modules requiring sub-micron alignment. Henkel’s Loctite AA 3494 cures in seconds under 365 nm light yet delivers 25 MPa lap-shear strength on stainless steel, suiting compact manufacturing footprints in Singapore’s high-cost real estate environment. Solvent-borne products defend niches such as leather and specialty-label applications but confront rising import duties linked to VOC content.
By End-User Industry: Packaging Primacy, Healthcare Momentum
Packaging’s 38.55% share in 2025 remains anchored by automated right-size carton lines and bio-content hot melts. The Singapore adhesives market size for packaging is expected to reach USD 225 million by 2031. Healthcare and biomedical devices should post a 6.34% CAGR as Tuas hub production scales pacemakers, catheters, and wearables requiring ISO 10993-validated adhesives. Electronics adhesives benefit from Henkel’s enlarged technical center, while construction retains steady pull from rail-station expansion and retrofit activity mandated by tighter energy codes.
Geography Analysis
Singapore’s compact territory channels demand through a single, highly integrated logistics corridor connecting port, airport, and industrial parks. Henkel’s January 2026 consolidation at Geneo clusters innovation, supply chain, and a regional digital lab, reinforcing Singapore as a command-and-control node for Southeast Asia. Sika’s automated mortar plant and Elmich rooftop-greening acquisition in 2025 shorten lead times for tile adhesives and eco-sealants. Tesa’s “Debonding on Demand” lab with ASTAR underscores policy emphasis on repairability and circularity. Although Singapore imports most feedstocks, Arkema’s nearby bio-based Rilsan PA11 complex and UPM’s Johor pressure-sensitive-label line improve regional resilience.
Competitive Landscape
The Singapore adhesives market is moderately consolidated. Henkel’s EUR 270 million acquisition of ATP Adhesive Systems extends water-based specialty-tape know-how, dovetailing with Singapore’s e-commerce packaging boom. Arkema’s absorption of Dow’s flexible-packaging lamination unit (USD 250 million sales) deepens Bostik’s range of solvent-free two-component systems. Local barriers center on compliance infrastructure, ISO 10993 testing, hazardous-substance permits, and life-cycle disclosures, raising the bar for new entrants. Niche players such as Adhesives Research and Permabond carve out space with UV-curable medical tapes and tropical-humidity cyanoacrylates, but scale benefits increasingly accrue to multinationals that can diffuse R&D costs across global markets.
Singapore Adhesives Industry Leaders
Henkel AG & Co. KGaA
3M
H.B. Fuller Company
Arkema
Sika AG
- *Disclaimer: Major Players sorted in no particular order

Recent Industry Developments
- January 2026: Henkel consolidated Singapore operations at Geneo, creating Southeast Asia’s largest electronic-adhesives application laboratory.
- January 2026: NEA enforced a 0.01% formaldehyde ceiling in interior paints, signaling broader chemical restrictions.


Singapore Adhesives Market Report Scope
Adhesives are materials designed to bond surfaces together effectively, ensuring durability and resistance to separation. Various industries, including building and construction, packaging, automotive, aerospace, woodworking and joinery, footwear, healthcare, and other end-user sectors, rely on specific types of adhesives tailored to their composition and functional requirements.
The Singapore adhesives market is segmented by resin, technology, and end-user industry. By resin, the market is segmented into acrylic, cyanoacrylate, epoxy, polyurethane, silicone, VAE/EVA, and other resins. By technology, the market is segmented into hot melt, reactive, solvent-borne, and UV cured, and water-borne. By end-user industry, the market is segmented into aerospace, automotive, building and construction, electrical and electronics, footwear and leather, healthcare, packaging, woodworking and joinery, and other end-user industries. For each segment, the market sizing and forecasts have been done based on revenue (USD) and volume (tons).
By Resin
| Acrylic |
| Cyanoacrylate |
| Epoxy |
| Polyurethane |
| Silicone |
| VAE / EVA |
| Other Resins |
By Technology
| Hot Melt |
| Reactive |
| Solvent-borne |
| UV-Cured |
| Water-borne |
By End-user Industry
| Aerospace |
| Automotive |
| Building and Construction |
| Electronics and Electrical |
| Footwear and Leather |
| Healthcare |
| Packaging |
| Woodworking and Joinery |
| Other End-user Industries |
| By Resin | Acrylic |
| Cyanoacrylate | |
| Epoxy | |
| Polyurethane | |
| Silicone | |
| VAE / EVA | |
| Other Resins | |
| By Technology | Hot Melt |
| Reactive | |
| Solvent-borne | |
| UV-Cured | |
| Water-borne | |
| By End-user Industry | Aerospace |
| Automotive | |
| Building and Construction | |
| Electronics and Electrical | |
| Footwear and Leather | |
| Healthcare | |
| Packaging | |
| Woodworking and Joinery | |
| Other End-user Industries |


Market Definition
- End-user Industry - Building & Construction, Packaging, Automotive, Aerospace, Woodworking & Joinery, Footwear & Leather, Healthcare, and Others are the end-user industries considered under the adhesives market.
- Product - All adhesive products are considered in the market studied
- Resin - Under the scope of the study, resins like Polyurethane, Epoxy, Acrylic, Cyanoacrylate, VAE/EVA, and Silicone are considered
- Technology - For the purpose of this study, Water-borne, Solvent-borne, Reactive, Hot Melt, and UV Cured adhesive technologies are taken into consideration.
| Keyword | Definition |
|---|---|
| Hot-melt Adhesive | Hot melt adhesives are generally 100% solid formulations, based on thermoplastic polymers. They are solid at room temperature and are activated upon heating above their softening point, at which stage they are liquid, and hence, can be processed. |
| Reactive Adhesive | A reactive adhesive is made up of monomers that react in the adhesive curing process and do not evaporate from the film during use. Instead, these volatile components become chemically incorporated into the adhesive. |
| Solvent-borne Adhesive | Solvent-borne adhesives are mixtures of solvents and thermoplastic, or slightly cross-linked polymers, such as polychloroprene, polyurethane, acrylic, silicone, and natural and synthetic rubbers (elastomers). |
| Water-borne Adhesive | Water-borne adhesives use water as a carrier or diluting medium to disperse a resin. They are set by allowing the water to evaporate or be absorbed by the substrate. These adhesives are compounded with water as a diluent, rather than a volatile organic solvent. |
| UV Cured Adhesive | UV curing adhesives induce curing and create a permanent bond without heating by using ultraviolet (UV) light or other radiation sources. An aggregation of monomers and oligomers is cured or polymerized by ultraviolet (UV) or visible light in a UV adhesive. Because UV is a radiating energy source, UV adhesives are often referred to as radiation curing or rad-cure adhesives. |
| Heat-resistant Adhesive | Heat-resistant Adhesives refer to those that do not break down under high temperatures. One aspect of a complicated system of circumstances is the adhesive's capacity to withstand disintegration brought on by high temperatures. As the temperature rises, adhesives may liquefy. They can withstand stresses resulting from differing coefficients of expansion and contraction, which might be an additional advantage. |
| Reshoring | Reshoring is the practice of moving commodity production and manufacturing back to the nation where the business was founded. Onshoring, inshoring, and back shoring are further terms used. Offshoring, the practice of producing items abroad to lower labor and manufacturing costs, is the opposite of this. |
| Oleochemicals | Oleochemicals are compounds produced from biological oils or fats. They resemble petrochemicals, which are substances made from petroleum. The oleochemical business is built on the hydrolysis of oils or fats. |
| Nonporous Materials | Nonporous materials are substances that do not permit the passage of liquid or air. Nonporous materials are those that are not porous, such as glass, plastic, metal, and varnished wood. Since no air can get through, less airflow is required to raise these materials, negating the requirement for high airflow. |
| EU-Vietnam Free Trade Agreement | A trade agreement and an investment protection agreement were concluded between the European Union and Vietnam on June 30, 2019. |
| VOC content | Compounds with limited solubility in water and high vapor pressure are known as Volatile Organic Compounds (VOCs). Many VOCs are human-made chemicals that are used and produced in the manufacture of paints, pharmaceuticals, and refrigerants. |
| Emulsion Polymerization | Emulsion polymerization is a method of producing polymers or connected groups of smaller chemical chains known as monomers, in a water solution. The method is often used to make water-based paints, adhesives, and varnishes, in which the water stays with the polymer and is marketed as a liquid product. |
| 2025 National Packaging Targets | In 2018, the Australian Environment Ministry set the following 2025 National Packaging Targets: 100% of the packaging must be reusable, recyclable, or compostable by 2025, 70% of plastic packaging must be recycled or composted by 2025, 50% of average recycled content must be included in packaging by 2025, and problematic and unnecessary single-use plastic packaging must be phased out by 2025. |
| Russian Government’s Import Substitution Policy | The Western sanctions suspended the distribution of several high-tech items to Russia, including those required by the raw material export sectors and the military-industrial complex. In response, the government launched an "import substitution" scheme, appointing a special commission to oversee its implementation in early 2015. |
| Paper Substrate | Paper substrates are paper sheets, reels, or boards with a base weight of up to 400 g/m2 that has not been converted, printed or otherwise altered. |
| Insulation Material | A material that inhibits or blocks heat, sound, or electrical transmission is known as Insulation Material. The variety of insulation materials includes thick fibers like fiberglass, rock and slag wool, cellulose, and natural fibers as well as stiff foam boards and sleek foils. |
| Thermal Shock | A temperature change known as thermal shock generates stress in a material. It commonly results in material breakdown and is especially prevalent in brittle materials like ceramics. When there is a quick temperature change, either from hot to cold or vice versa, this process occurs abruptly. It occurs more frequently in materials with poor heat conductivity and insufficient structural integrity. |


Research Methodology
Mordor Intelligence follows a four-step methodology in all our reports.
- Step-1: Identify Key Variables: The quantifiable key variables (industry and extraneous) pertaining to the specific product segment and country are selected from a group of relevant variables & factors based on desk research & literature review; along with primary expert inputs. These variables are further confirmed through regression modeling (wherever required).
- Step-2: Build a Market Model: In order to build a robust forecasting methodology, the variables and factors identified in Step-1 are tested against available historical market numbers. Through an iterative process, the variables required for market forecast are set and the model is built on the basis of these variables.
- Step-3: Validate and Finalize: In this important step, all market numbers, variables and analyst calls are validated through an extensive network of primary research experts from the market studied. The respondents are selected across levels and functions to generate a holistic picture of the market studied.
- Step-4: Research Outputs: Syndicated Reports, Custom Consulting Assignments, Databases & Subscription Platforms


