
Short-Sea and Feeder Container Shipping Market Size and Share
Market Overview
| Study Period | 2021 - 2032 |
|---|---|
| Market Size (2027) | USD 40.67 Billion |
| Market Size (2032) | USD 47.90 Billion |
| Growth Rate (2027 - 2032) | 3.33 % |
| Fastest Growing Market | Asia-Pacific |
| Largest Market | Europe |
| Market Concentration | Medium |
Major Players *Disclaimer: Major Players sorted in no particular order Image © Mordor Intelligence. Reuse requires attribution under CC BY 4.0. | |
Short-Sea and Feeder Container Shipping Market Analysis by Mordor Intelligence
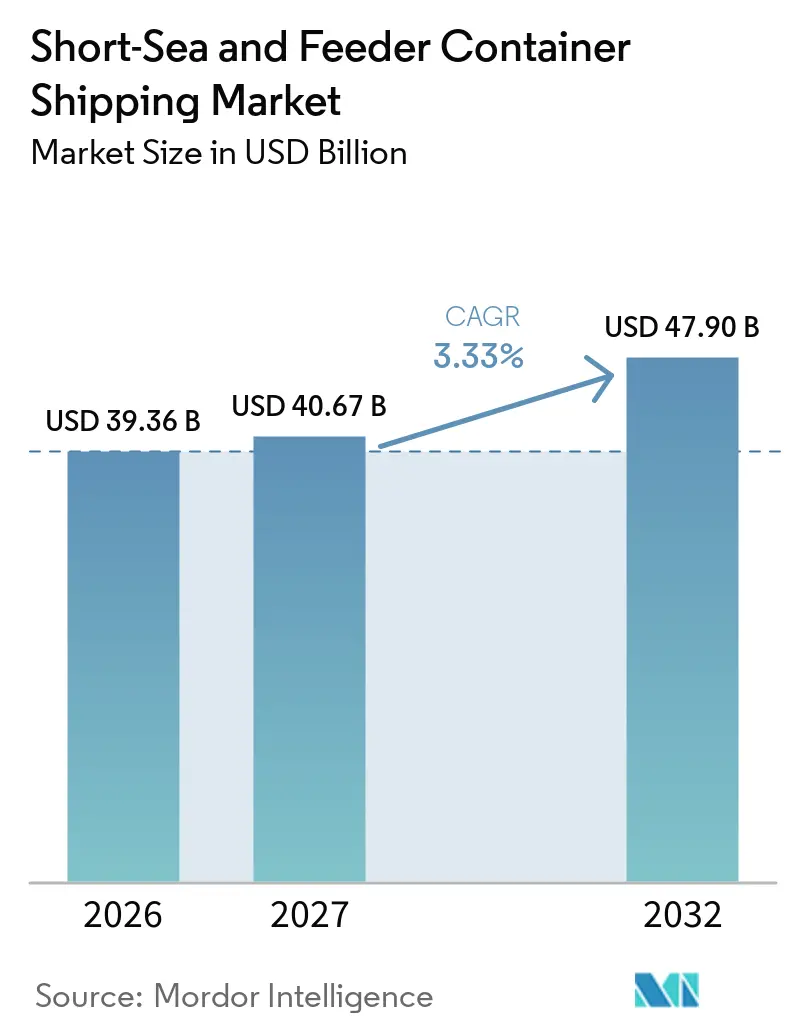
The short-sea and feeder container shipping market size is valued at USD 39.36 billion in 2026 and is estimated to grow from USD 40.67 billion in 2027 to USD 47.90 billion by 2032, registering a CAGR of 3.33% between 2027 and 2032.
The short-sea and feeder container shipping market is being reshaped by hub-and-spoke networks that place feeder and shuttle services at the center of cargo distribution. The Gemini Cooperation, launched by A.P. Moller-Maersk and Hapag-Lloyd in February 2025, connected 29 mainline services with 28 shuttle and feeder services and targeted schedule reliability above 90%. Aging vessels and a low orderbook-to-fleet ratio support replacement demand, while carbon rules raise the cost of retaining older ships on European routes. The short-sea and feeder container shipping market also benefits when manufacturing shifts create more intra-regional cargo movements and more transshipment activity.[1] Competitive activity is moving in two directions, with neutral feeder operators expanding their networks while integrated carriers add capacity and control feeder connections around their main hubs.
Key Report Takeaways
- By vessel capacity, the 1,000-2,999 TEU class held 37.60% of the short-sea and feeder container shipping market share in 2026, while the 3,000-4,000 TEU class recorded the highest projected CAGR at 4.86% through 2032.
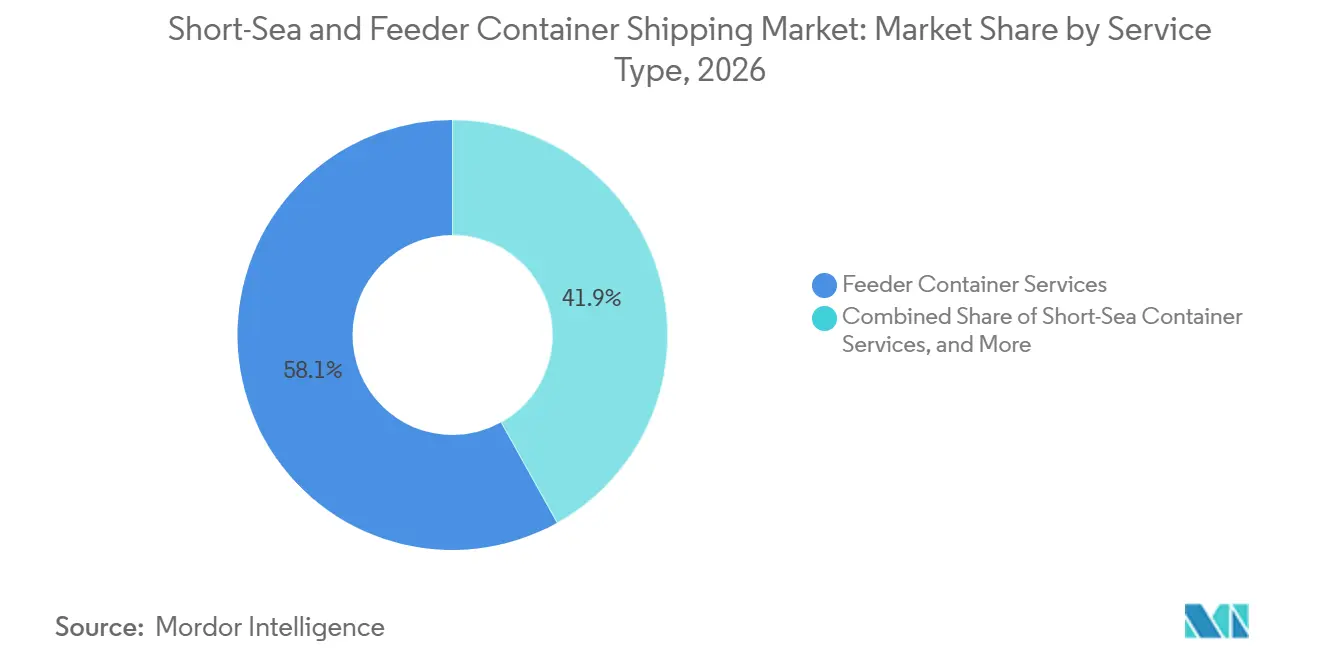
- By service type, feeder container services held 58.10% of the share of the short-sea and feeder container shipping market size in 2026, while short-sea container services recorded the highest projected CAGR at 4.92% through 2032.
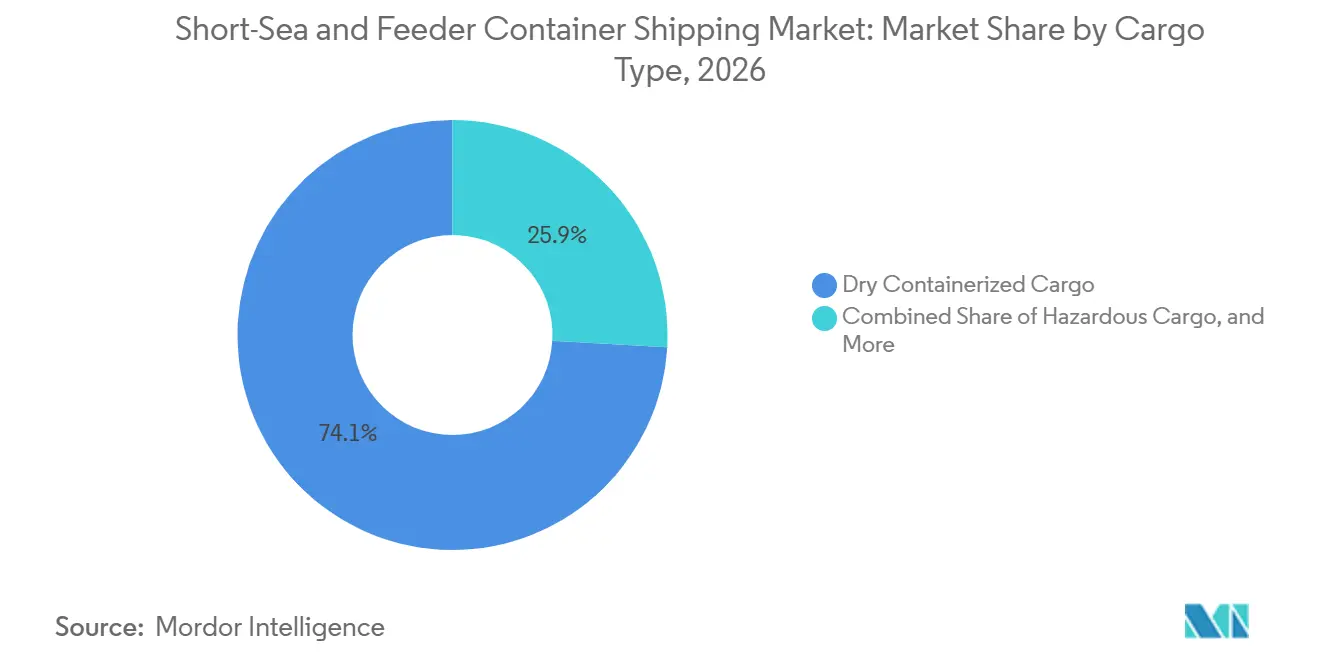
- By cargo type, dry containerized cargo held 74.10% of the short-sea and feeder container shipping market share in 2026, while specialized/out-of-gauge cargo recorded the highest projected CAGR at 5.32% through 2032.
- By container type, dry containers held 86.10% of the short-sea and feeder container shipping market share in 2026, while reefer containers recorded the highest projected CAGR at 5.05% through 2032.
- By geography, Europe held 32.40% of the short-sea and feeder container shipping market size in 2026, while Asia-Pacific recorded the highest projected CAGR at 5.18% through 2032.
Note: Market numbers in this report are based on Mordor Intelligence's proprietary estimation framework, which combines nine months of actuals with Q4 projections for base year 2026.
Market Trends and Insights
Drivers Impact Analysis of Short-Sea and Feeder Container Shipping Market*
| Driver | (~) % Impact on CAGR Forecast | Geographic Relevance | Impact Timeline |
|---|---|---|---|
| Expansion of Hub-and-Spoke Container Networks | +0.7% | Global, with concentrated impact in Asia-Pacific, Europe, and Middle East transshipment corridors | Short term (≤ 2 years) |
| Growth of Intra-Regional Containerized Trade | +0.6% | Asia-Pacific core, spill-over to Middle East and Africa and South America | Medium term (2-4 years) |
| Port Draft and Infrastructure Constraints at Secondary Ports | +0.5% | Southeast Asia, South America Atlantic coast, West and East Africa | Medium term (2-4 years) |
| Road Congestion and Multimodal Modal-Shift Policies | +0.3% | Europe, India, Southeast Asia | Medium term (2-4 years) |
| Geopolitical Disruptions and Regional Route Reconfiguration | +0.5% | Global, primarily Red Sea, Mediterranean, and Strait of Hormuz corridors | Short term (≤ 2 years) |
| Fleet Decarbonization and Demand for Low-Emission Feeder Services | +0.3% | Europe, Asia-Pacific, and global compliance routes | Long term (≥ 4 years) |
| Source: Mordor Intelligence | |||
Expansion of Hub-and-Spoke Container Networks
The February 2025 Gemini Cooperation changed how feeder capacity fits within major carrier networks. Its 29 mainline services and 28 dedicated shuttle and feeder services treat local connectivity as a network layer rather than a supporting activity. This structure moves more secondary-port cargo through controlled transshipment hubs. The short-sea and feeder container shipping market gains addressable volumes when direct calls give way to hub connections. Maersk’s intra-European capacity share rose from 8.5% in February 2025 to 12.1% by mid-2025, while MSC added 30,000 TEU and reached a 30.6% intra-European share.[2] Independent operators, therefore, need dependable schedules, clear slot information, modern vessels, and a neutral commercial position.
Growth of Intra-Regional Containerized Trade
Intraregional container trade reached 49,036 thousand TEUs in 2025, an increase of 3.8%, according to the United Nations Conference on Trade and Development. Intra-Asia volumes reached 28.45 million TEU in the first 7 months of 2025 and grew 5.8% year-over-year. Changes in sourcing patterns increased repositioning needs between China, Southeast Asia, and major transshipment hubs. The short-sea and feeder container shipping market gains from these shorter regional legs because production networks need frequent, reliable sailings. Sinokor Merchant Marine reported USD 1.5 billion in revenue and a 14% increase in operating profit in 2025, supported by regional-route volumes.[3] Secondary ports need more links to Singapore, Port Klang, and other hubs as production spreads across Southeast Asia.
Geopolitical Disruptions and Regional Route Reconfiguration
Suez Canal transits remained 70% below 2023 average levels through 2025, which extended Asia-Europe voyage lengths by 30%. Disruption at the Bab el-Mandeb Strait creates material risk for maritime trade flows. Cargo has been redistributed through Western Mediterranean hubs, including Algeciras and Tanger Med. This has increased demand for feeder links into Southern Europe but has also reduced schedule certainty. The short-sea and feeder container shipping market favors operators with sufficient frequency to manage missed connections and delayed arrivals. The United States government also opened an investigation into transit constraints at international maritime chokepoints in March 2025.
Fleet Decarbonization and Demand for Low-Emission Feeder Services
The Mediterranean became a Sulfur Oxide Emission Control Area in May 2025, with a 0.10% sulfur limit. FuelEU Maritime began applying in January 2025 and set a 2% annual greenhouse-gas intensity reduction requirement for vessels calling at European ports. These measures reduce the commercial viability of older feeder ships on European routes. MSC and CMA CGM announced a combined feeder fleet upgrade program for up to 120 vessels in 2025. DNV documented the delivery of methanol-powered feeder vessels to MPC Container Ships during 2025. The short-sea and feeder container shipping market rewards carriers that secure compliant vessels and fuel access before yard capacity tightens further.
Restraints Impact Analysis of Short-Sea and Feeder Container Shipping Market*
| Restraint | (~) % Impact on CAGR Forecast | Geographic Relevance | Impact Timeline |
|---|---|---|---|
| Competition from Road and Rail Freight | -0.6% | Europe, India, Southeast Asia | Medium term (2-4 years) |
| Regulatory Compliance and Alternative-Fuel Cost Burden | -0.5% | Global, most acute in European Union-adjacent and Emission Control Area-designated waters | Long term (≥ 4 years) |
| Empty-Container Imbalance and Repositioning Costs | -0.4% | Global, concentrated in North Europe load ports and Southeast Asia discharge ports | Short term (≤ 2 years) |
| Secondary-Port Congestion and Schedule Reliability Risk | -0.3% | Asia-Pacific, Mediterranean, and West Africa secondary ports | Medium term (2-4 years) |
| Source: Mordor Intelligence | |||
Competition from Road and Rail Freight
The European Union Emissions Trading System required shipping companies to surrender allowances for 40% of 2024 emissions by September 2025 and applied to 70% of 2025 emissions in 2026. Road freight is not yet covered by the same framework. The European Community Shipowners’ Associations warned that this difference could move cargo from sea to road on short corridors. The risk is highest on routes of 500 to 1,500 kilometers, where road service remains competitive on speed and frequency. Administrative procedures can add to the cost gap for short-sea operators. Road congestion and modal-shift policies still support maritime services in some locations, but the short-sea and feeder container shipping market remains exposed where carbon charges raise total transport cost.
Regulatory Compliance and Alternative-Fuel Cost Burden
Compliance costs affect feeder operators more heavily because their revenue per TEU per day is lower than that of deep-sea vessels. The International Maritime Organization approved its Net-Zero Framework at MEPC 83 in April 2025. Its later adoption process was delayed, extending uncertainty over implementation timing. A 3,500 TEU ammonia dual-fuel feeder design requires risk assessments and an alternative-design process because prescriptive rules for ammonia-powered vessels are still limited. Methanol feeder designs are available, but refueling infrastructure remains limited at many secondary ports. The International Maritime Organization approved separate Carbon Intensity Indicator amendments for temperature-controlled containers in June 2026, adding another compliance consideration for reefer-intensive operations.[4]
*Our forecasts treat driver/restraint impacts as directional, not additive. The impact forecasts reflect baseline growth, mix effects, and variable interactions.
Short-Sea and Feeder Container Shipping Market Segment Analysis
By Vessel Capacity:
Mid-Size Tonnage Anchors the Market While Larger Feeders Gain TractionThe 1,000-2,999 TEU class held 37.60% of the short-sea and feeder container shipping market share in 2026. This size class combines slot economics with access to secondary ports that have draft limits, which makes it suitable for high-frequency hub-feeder links where vessels need enough capacity for unit-cost discipline but cannot rely on deep-water access at every call. More than 28% of the global feeder fleet was over 20 years old in 2025, which created a replacement need in this capacity range and placed the pressure most clearly on vessels that worked regional rotations with repeated port calls, tight berthing windows, and limited tolerance for off-hire time. The World Ports Organization reported an aging feeder fleet and a limited orderbook relative to the fleet. Below 1,000 TEU vessels remain important for island markets, domestic coastal networks, and shallow-draft ports. They serve last-mile routes where larger vessels cannot call economically, including Japanese domestic coastal services, Caribbean feeder loops, and other networks where shallow drafts or low call volumes limit the use of mid-size vessels.
The 3,000-4,000 TEU class registered a 4.86% CAGR through 2032. Its short-sea and feeder container shipping market size benefits from replacement plans favoring larger and more fuel-efficient ships, particularly in the 1,800-3,500 TEU range where operators can replace older vessels without moving beyond the practical limits of important secondary ports. Korea Marine Transport Co. ordered 6 vessels of 1,800 TEU at HD Hyundai Group yards for USD 258 million in March 2026. Regional Container Lines ordered 4 vessels of 3,100 TEU at CSSC Huangpu Wenchong in September 2026, taking its total program there to 16 ships. The above 4,000 TEU class remains suited to longer regional routes where mainline economics become more relevant. Sinokor’s order for 4 vessels of 13,000 TEU shows that some regional operators are moving into long-haul capable capacity. Global feeder orders reached 206 vessels in 2025, above 118 vessels in 2024, while 102 additional ships were ordered in the first 2 months of 2026, showing how fleet renewal and the expansion of hub-and-spoke services were occurring at the same time rather than as separate investment cycles.
By Service Type:
Feeder Services Dominate While Short-Sea Grows FasterFeeder container services held 58.10% of the short-sea and feeder container shipping market size in 2026. Their lead reflects the importance of moving containers between secondary ports and mainline hubs, especially when carriers reduce the number of direct calls and concentrate deep-sea operations at hubs with stronger terminal capacity and better connections to global networks. Gemini’s network design directs cargo through shuttle and feeder links, reinforcing transshipment-based demand. Feeder services also give mainline carriers greater control over cargo connections and terminal flows, allowing them to coordinate transshipment windows, vessel rotation changes, and capacity allocation across deep-sea and regional services from one network design. Their importance is highest in regions where port calls are consolidated around a small number of major hubs. Neutral providers continue to serve this need because they can support more than one carrier group, giving alliance members and smaller lines access to regional capacity without requiring each customer to operate its own dedicated feeder fleet.
Short-sea container services are registered at a 4.92% CAGR through 2032. Their growth gains support from nearshoring, manufacturing diversification, and coastal shipping policies. India’s coastal shipping push has opened new connections between Chennai, Kochi, and Mumbai. Coastal Container Services have a narrower role because cabotage rules often limit foreign-flag participation, so entry normally relies on domestic operations, local partnerships, or vessel arrangements that satisfy national ownership and operating rules. Samudera Shipping and Imoto Corporation formed Blue Ocean Shipping for Japan’s coastal and regional market in December 2025. In 2025, intraregional trade increased 3.8% to 49,036 thousand TEUs, supporting demand across the three service types.

By Cargo Type:
Dry Cargo Dominates but Specialized Segments Capture Outsized GrowthDry containerized cargo accounted for 74.10% of the short-sea and feeder container shipping market share in 2026. General merchandise, consumer goods, and industrial materials make up most cargo moving through regional feeder networks, and their shipment patterns fit scheduled services that collect cargo at smaller ports before moving it through major transshipment terminals. Dry cargo benefits from established terminals, container availability, and predictable handling processes. Reefer and hazardous cargo represent smaller portions of the freight mix but need more specialized equipment and operating procedures, including power connections, temperature management, cargo documentation, segregated handling, and more careful planning at terminals with limited specialized capacity. The International Maritime Organization approved amendments covering a separate Carbon Intensity Indicator rating approach for temperature-controlled containers in June 2026. This adds a distinct regulatory consideration for reefer services and can encourage operators to assess equipment performance separately from dry-box capacity when they manage vessels with a high concentration of refrigerated containers.
Specialized and out-of-gauge cargo is registered at a 5.32% CAGR through 2032. Its short-sea and feeder container shipping market size is supported by infrastructure spending in developing economies, where renewable-energy projects, port construction, industrial facilities, and utility investments generate movements that do not fit standard container handling requirements. Renewable-energy components, large pipes, and industrial equipment require ships with project-cargo capability. These loads often need geared vessels that can handle cargo where shore equipment is limited, and this capability is particularly relevant in African and South American ports where specialized lifting infrastructure may not be available on every regional call. X-Press Feeders indicated that operators in Africa and South America were specifying geared ships with self-handling capacity and extended low-speed range. This demand creates a specialized area that is less exposed to standard container spot-rate movements because cargo acceptance depends on vessel gear, voyage planning, safe stowage, and the ability to manage oversized or nonstandard units alongside regular containers. It also raises the value of vessel design, crew capability, and port-call planning.
By Container Type:
Dry Boxes Retain Dominance While Reefers AccelerateDry containers held 86.10% of the short-sea and feeder container shipping market size in 2026. Their position reflects the large volume of general merchandise, industrial goods, and fast-moving consumer goods in regional trade, with shippers using standard dry equipment for regular flows between manufacturing centers, distribution markets, and transshipment gateways. The supporting equipment and handling infrastructure are widely available at ports across major feeder corridors, which helps operators turn ships quickly and plan rotations around standardized units rather than cargo-specific loading requirements. Demand remains linked to regional economic activity and manufacturing flows. Dry boxes also offer operators a simpler planning model than specialized units. This creates a reliable base of cargo for high-frequency regional services.
Reefer containers are registered at a 5.05% CAGR through 2032. Reefer container demand is supported by fresh produce, protein, pharmaceutical, and temperature-sensitive cargo, as regional production areas depend on reliable connections to large hubs that offer onward services and inland cold-chain links. Biologic drugs and mRNA vaccines require tightly controlled temperatures of 2-8 °C. A.P. Moller-Maersk reported increased reefer demand in North America during 2025, linked to fresh produce, proteins, and pharmaceutical cargo. The company is also investing in connected monitoring and inland cold-chain services, reflecting the value placed on cargo visibility from the regional vessel leg through terminal handling and onward delivery to temperature-controlled distribution facilities. The European Union’s F-Gas phase-down affects older refrigerant systems and can speed equipment renewal. Tight seasonal availability supports selective allocation of refrigerated slots to pharmaceutical and premium perishable cargo, particularly during peak produce periods when feeder operators need to balance equipment positioning, power availability, port dwell time, and the risk of temperature excursions.
Geography Analysis
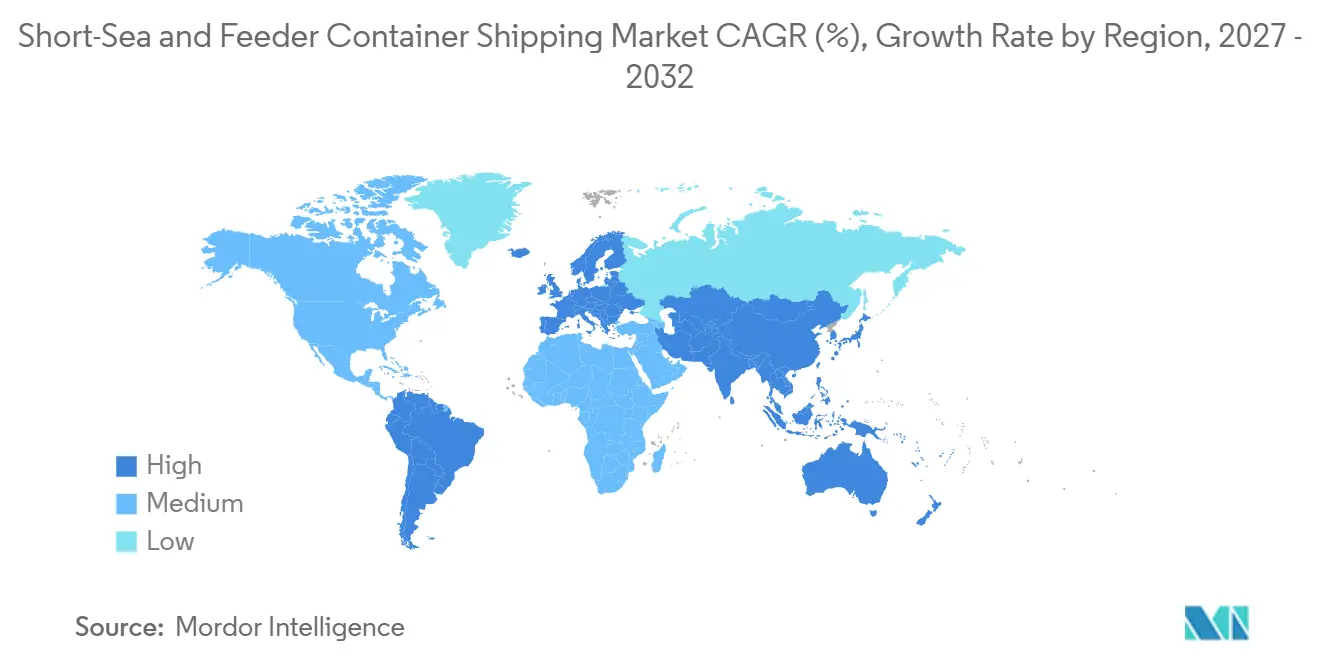
Europe held 32.40% of the short-sea and feeder container shipping market share in 2026. The region has dense short-sea connections and policies intended to shift freight from road to sea. Intra-European container traffic reached 8.3 million TEU in 2025, an increase of 2.3%, while the Mediterranean corridor faced heavier transshipment activity as cargo bypassed the Suez Canal. MSC reached a 30.6% intra-European share after adding 30,000 TEU, while CMA CGM held 19.2% after adding 27,500 TEU. European Union emissions rules and the Mediterranean sulfur limit raise the advantage of newer vessels.
Asia-Pacific is registered at a 5.18% CAGR through 2032, supported by China+1 production strategies and rising intra-Asia trade. Intra-Asia volumes reached 28.45 million TEU in the first 7 months of 2025 and grew 5.8% year-over-year, while Asian operators and owners led feeder vessel contracting in 2025. The first 2 months of 2026 produced 102 orders totaling 665,000 TEU. Vietnamese ports have continued to strengthen their connections within regional shipping networks, supporting demand for services that link ASEAN ports to hubs such as Singapore and Port Klang.
North America, South America, the Middle East, and Africa provide complementary routes for the short-sea and feeder container shipping market. The United States Maritime Administration supports coastal services through its Marine Highway Program, while PIL introduced CA1 and CA2 services in 2025 linking Colombia, Mexico, Nicaragua, Costa Rica, and El Salvador. Developing economies recorded average container-ship waiting times of 10.9 hours, compared with 6.4 hours in developed economies, showing the operating challenge at constrained ports. Global Feeder Shipping introduced an Adriatic East-Med Service in July 2026, and Hapag-Lloyd adopted capacity through a slot agreement. These routes reflect growing demand for connections between Egypt, the Adriatic, and wider Middle East and Africa trade flows globally today.
Competitive Landscape
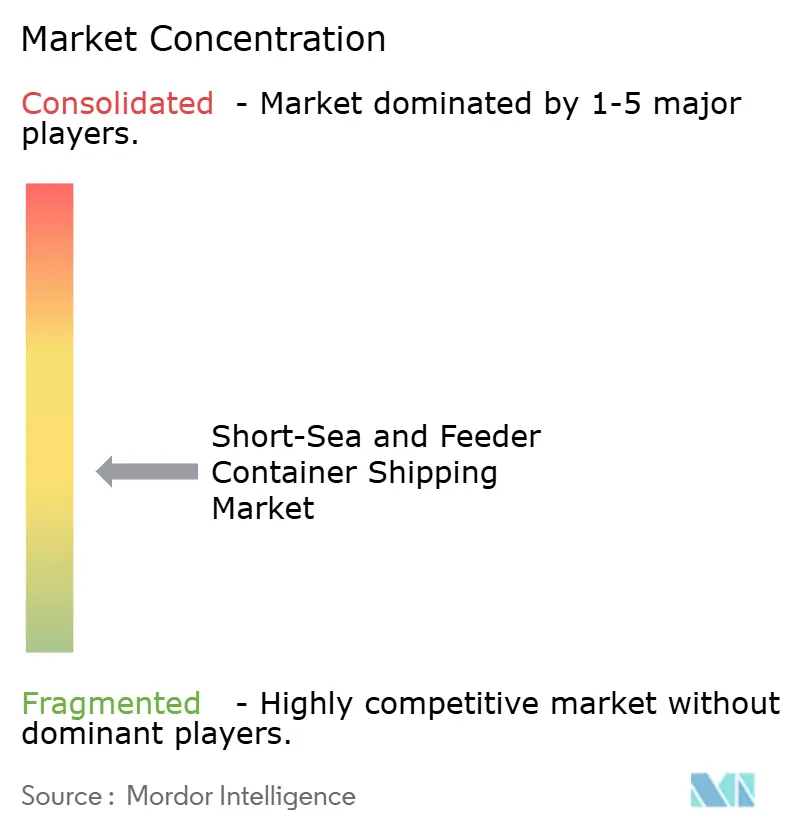
The short-sea and feeder container shipping market is moderately fragmented among independent operators, although integrated carrier groups are becoming more concentrated. X-Press Feeders had 104 vessels and 188,000 TEU of capacity in October 2025. Its neutral model focuses on mainline carrier clients rather than direct cargo solicitation. In June 2025, X-Press Feeders and COSCO SHIPPING Lines entered a partnership and vessel-leasing agreement for joint feeder services across Asia, the Middle East, the Mediterranean, North Europe, and Latin America. The agreement gives COSCO an option to charter X-Press newbuild vessels for joint services, while DP World Shipping Solutions, formerly Unifeeder, added 12,500 TEU to intra-Europe capacity in 2025, and Unimed Feeder Services added 9,700 TEU across 10 vessels.
Mainline carriers now view feeder networks as strategic network components rather than ancillary services. Gemini integrates feeder and shuttle services within its hub-and-spoke model, and Hapag-Lloyd has negotiated an order for 22 feeder and shuttle vessels in the 1,800 TEU, 3,500 TEU, and 4,500 TEU ranges. In February 2026, Hapag-Lloyd agreed to acquire ZIM Integrated Shipping Services for USD 4.2 billion in cash. The transaction brings Gold Star Line’s 23 vessels and 85,000 TEU of capacity into Hapag-Lloyd’s network, while a New ZIM entity backed by FIMI Opportunity Funds retains 16 vessels for Israeli domestic routes with commercial support from Hapag-Lloyd.
CMA CGM signed a contract with Cochin Shipyard in February 2026, for 6 LNG-powered vessels of 1,700 TEU, valued at USD 300 million. The order is the first placed by a major global container carrier at an Indian shipyard and supports vessel renewal and network development in South Asia. The short-sea and feeder container shipping market favors companies that can combine compliant newbuild access, dependable capacity, visibility tools, and neutral service where customers seek it. Leading operators are using partnerships, acquisition activity, new vessel orders, and slot agreements to widen corridor coverage.
Short-Sea and Feeder Container Shipping Industry Leaders
-
X-Press Feeders
-
Mediterranean Shipping Company S.A.
-
A.P. Moller - Maersk
-
CMA CGM Group
-
COSCO SHIPPING Lines Co., Ltd.
- *Disclaimer: Major Players sorted in no particular order
Short-Sea and Feeder Container Shipping Market Companies Covered in this Report
- X-Press Feeders
- DP World
- Mediterranean Shipping Company S.A.
- A.P. Moller - Maersk
- CMA CGM Group
- COSCO SHIPPING Lines Co., Ltd.
- Ocean Network Express Pte. Ltd.
- Evergreen Marine Corporation
- Hapag-Lloyd AG
- Sinokor Merchant Marine Co., Ltd.
- Pacific International Lines Pte. Ltd.
- Samudera Shipping Line Ltd.
- Regional Container Lines Public Company Limited
- Korea Marine Transport Co., Ltd.
- SITC International Holdings Co., Ltd.
- Wan Hai Lines Ltd.
- Yang Ming Marine Transport Corporation
- ZIM Integrated Shipping Services Ltd.
- Arkas Line
- Akkon Lines
- BG Freight Line
- Samskip B.V.
- Sea Lead Shipping Pte. Ltd.
- Emirates Shipping Line FZE
- Far Shipping
- Global Feeder Shipping LLC
- Straits Orient Lines Pte. Ltd.
Recent Industry Developments in Short-Sea and Feeder Container Shipping Market
- September 2026: Regional Container Lines (RCL) contracts four 3,100 TEU containerships at CSSC Huangpu Wenchong, extending its cumulative program to 16 vessels across three size classes. RCL simultaneously took delivery of its first 4,488 TEU vessel from the same yard.
- March 2026: Korea Marine Transport Co. (KMTC) orders six 1,800 TEU feeder containerships from HD Hyundai Group yards for USD 258 million, with deliveries between August 2027 and June 2028, expanding intra-Asia feeder capacity on regional corridors.
- February 2026: Hapag-Lloyd signed a merger agreement to acquire ZIM Integrated Shipping Services for approximately USD 4.2 billion. A new ZIM entity backed by FIMI Opportunity Funds retains 16 vessels for Israel-focused routes.
- February 2026: CMA CGM and Cochin Shipyard Limited executed a formal contract for six 1,700 TEU LNG-powered feeder vessels worth approximately USD 300 million. The October 2025 letter of intent was thus formalized, with deliveries scheduled between 2029 and 2031.
Global Short-Sea and Feeder Container Shipping Market Report Scope
Segmentation Overview
| Below 1,000 TEU |
| 1,000-2,999 TEU |
| 3,000-4,000 TEU |
| Above 4,000 TEU |
| Feeder Container Services |
| Short-Sea Container Services |
| Coastal Container Services |
| Dry Containerized Cargo |
| Temperature-Controlled / Reefer Cargo |
| Hazardous Cargo |
| Specialized / Out-of-Gauge Cargo |
| Dry Containers (General Purpose) |
| Reefer Containers |
| North America | United States |
| Canada | |
| Mexico | |
| South America | Brazil |
| Argentina | |
| Peru | |
| Chile | |
| Rest of South America | |
| Europe | Germany |
| United Kingdom | |
| France | |
| Italy | |
| Spain | |
| Russia | |
| Nordics (Denmark, Finland, Iceland, Norway, and Sweden) | |
| Rest of Europe | |
| Asia-Pacific | China |
| India | |
| Japan | |
| South Korea | |
| Australia | |
| Southeast Asia (ASEAN) | |
| Rest of Asia-Pacific | |
| Middle East and Africa | Saudi Arabia |
| United Arab Emirates | |
| Qatar | |
| South Africa | |
| Nigeria | |
| Egypt | |
| Rest of Middle East and Africa |
| By Vessel Capacity | Below 1,000 TEU | |
| 1,000-2,999 TEU | ||
| 3,000-4,000 TEU | ||
| Above 4,000 TEU | ||
| By Service Type | Feeder Container Services | |
| Short-Sea Container Services | ||
| Coastal Container Services | ||
| By Cargo Type | Dry Containerized Cargo | |
| Temperature-Controlled / Reefer Cargo | ||
| Hazardous Cargo | ||
| Specialized / Out-of-Gauge Cargo | ||
| By Container Type | Dry Containers (General Purpose) | |
| Reefer Containers | ||
| By Geography | North America | United States |
| Canada | ||
| Mexico | ||
| South America | Brazil | |
| Argentina | ||
| Peru | ||
| Chile | ||
| Rest of South America | ||
| Europe | Germany | |
| United Kingdom | ||
| France | ||
| Italy | ||
| Spain | ||
| Russia | ||
| Nordics (Denmark, Finland, Iceland, Norway, and Sweden) | ||
| Rest of Europe | ||
| Asia-Pacific | China | |
| India | ||
| Japan | ||
| South Korea | ||
| Australia | ||
| Southeast Asia (ASEAN) | ||
| Rest of Asia-Pacific | ||
| Middle East and Africa | Saudi Arabia | |
| United Arab Emirates | ||
| Qatar | ||
| South Africa | ||
| Nigeria | ||
| Egypt | ||
| Rest of Middle East and Africa | ||
Key Questions Answered in the Report
What is the value of short-sea and feeder container shipping in 2026?
The sector is valued at USD 39.36 billion in 2026 and reaches USD 47.90 billion by 2032 at a 3.33% CAGR (2027-2032).
Which vessel capacity class holds the largest share?
The 1,000-2,999 TEU class holds 37.60% in 2026, while 3,000-4,000 TEU vessels registered a 4.86% CAGR through 2032.
Why are feeder services important for container lines?
Feeder container services hold 58.10% in 2026 because they connect secondary ports with mainline transshipment hubs.
Which region grows the fastest through 2032?
Asia-Pacific registers at a 5.18% CAGR through 2032, supported by intra-Asia cargo flows and manufacturing diversification.
How do European shipping rules affect operators?
The European Union Emissions Trading System, FuelEU Maritime, and the Mediterranean sulfur limit raise the value of newer compliant vessels.
Which cargo category expands the fastest?
Specialized and out-of-gauge cargo expands at a 5.32% CAGR through 2032, supported by infrastructure and renewable-energy projects.