
Securities Exchange Market Size and Share
Market Overview
| Study Period | 2020 - 2031 |
|---|---|
| Market Size (2026) | USD 70.65 Billion |
| Market Size (2031) | USD 95.60 Billion |
| Growth Rate (2026 - 2031) | 6.23 % |
| Fastest Growing Market | Asia-Pacific |
| Largest Market | North America |
| Market Concentration | High |
Major Players *Disclaimer: Major Players sorted in no particular order Image © Mordor Intelligence. Reuse requires attribution under CC BY 4.0. | |
Securities Exchange Market Analysis by Mordor Intelligence
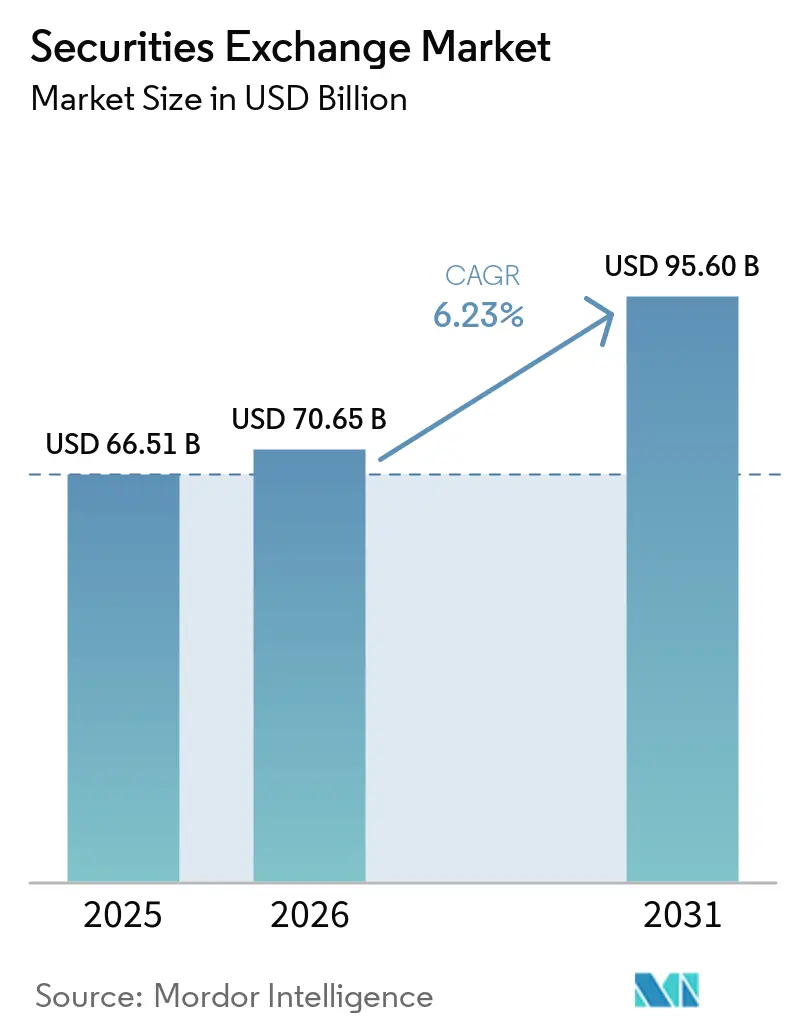
The Securities Exchange Market size is projected to expand from USD 66.51 billion in 2025 and USD 70.65 billion in 2026 to USD 95.60 billion by 2031, registering a CAGR of 6.23% between 2026 and 2031.
The securities exchange market is supported by wider use of electronic order matching, stronger post-trade systems, and broader access to digital brokerage services. Exchange-traded derivatives activity also remains important, with global volume reaching 88.58 billion contracts through July 2026, up 36.4% from the equivalent 2025 period. Equity contracts accounted for much of this increase, while energy derivatives recorded particularly rapid growth. The securities exchange market is also gaining support from exchange-traded funds, index products, tokenized securities, and sustainable debt listings. Large operators are responding by investing in data products, clearing capabilities, and tokenization infrastructure, while alternative venues continue to compete for order flow.
Key Report Takeaways
- By market function, secondary markets captured 86.1% of the securities exchange market share in 2025, while primary markets are projected to grow at a 7.2% CAGR through 2031.
- By instrument and asset class, derivatives captured 37.6% of the securities exchange market share in 2025, while ETFs and ETPs are projected to grow at a 9.4% CAGR through 2031.
- By service and revenue stream, trading and execution services captured 42.3% of the securities exchange market share in 2025, while market data, index, and analytics are projected to grow at a 9.1% CAGR through 2031.
- By participant type, buy-side institutions captured 45.8% of the securities exchange market share in 2025, while retail investors are projected to grow at an 8.3% CAGR through 2031.
- By exchange type, multi-asset exchange groups captured 53.2% of the securities exchange market share in 2025, while digital and tokenized securities venues are projected to grow at an 18.2% CAGR through 2031.
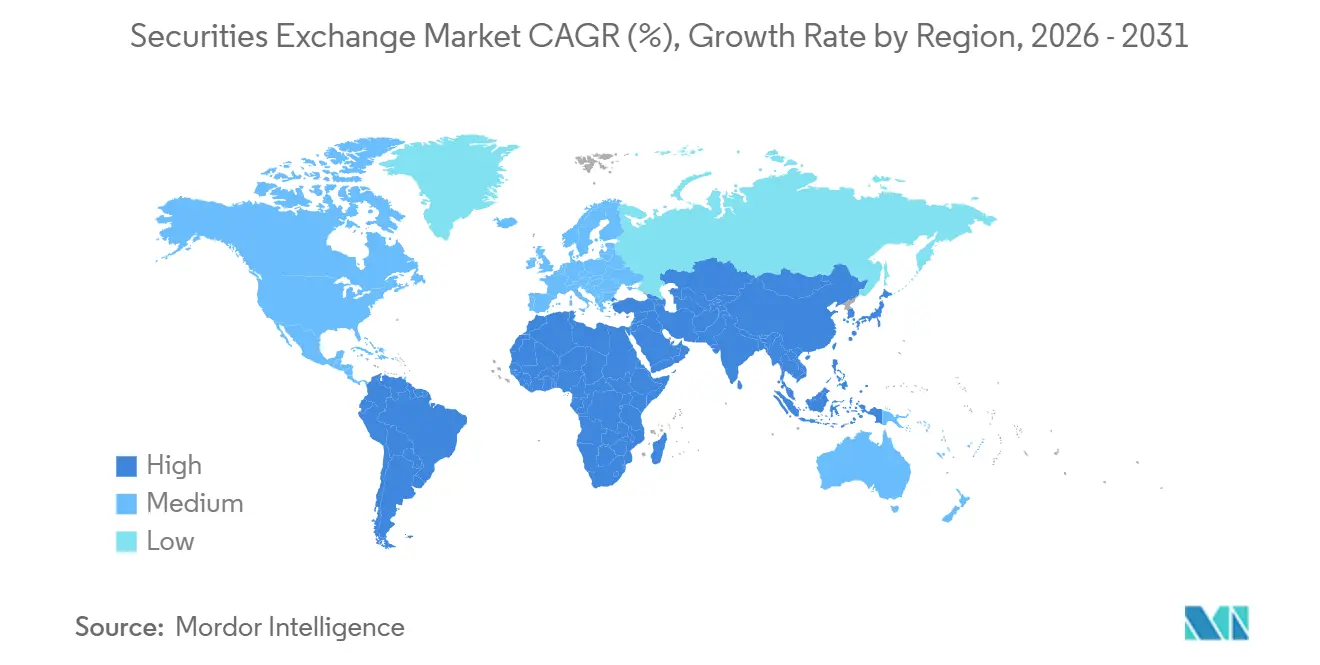
- By geography, North America captured 40.5% of the securities exchange market share in 2025, while Asia-Pacific is projected to grow at a 7.5% CAGR through 2031.
Note: Market size and forecast figures in this report are generated using Mordor Intelligence’s proprietary estimation framework, updated with the latest available data and insights as of January 2026.
Global Securities Exchange Market Trends and Insights
Drivers Impact Analysis*
| Driver | % Impact on CAGR Forecast | Geographic Relevance | Impact Timeline |
|---|---|---|---|
| Digital Brokerage Access and Retail Investor Participation | +1.2% | Global: highest intensity in North America, India, and Southeast Asia | Short term (≤ 2 years) |
| Cross-Border Investment and International Listings | +0.7% | Global; early gains in Hong Kong, Singapore, the UAE, and London | Medium term (2–4 years) |
| Derivatives Adoption for Hedging and Risk Management | +1.3% | Asia-Pacific core, spill-over to North America and Europe | Short to medium term |
| ETF, Indexing, and Passive Investment Growth | +1.0% | North America primary; rapid expansion in Europe and Asia-Pacific | Medium term (2–4 years) |
| Extended-Hours Trading and T+1 Infrastructure Modernization | +0.5% | North America (complete); Europe (Q4 2027); Asia-Pacific (in preparation) | Medium term (2–4 years) |
| Tokenized Securities, Green Bonds and Digital Asset Marketplaces | +0.8% | Global; pioneering activity in the United States, UAE, and Singapore | Long term (≥ 4 years) |
| Source: Mordor Intelligence | |||
Digital Brokerage Access and Retail Investor Participation
Retail participation has become a continuing source of trading activity for the securities exchange market. Charles Schwab opened 1.4 million brokerage accounts in Q2 2026, bringing its total client accounts to 48 million, while client assets increased 22% year over year to USD 13.08 trillion[1]. The National Stock Exchange of India crossed 130 million unique investors in 2026 after adding 10 million investors in 7 months, and 72 million new SIP accounts were added in FY26. In China, on-exchange options daily average volume increased 52.6% year over year in H1 2026, mainly because of retail activity in technology index ETF options. Retail investors accounted for 35% of United States equity volume in April 2025 during volatile conditions, and their growing options activity supports higher-fee contract volumes for exchange operators.
ETF, Indexing, and Passive Investment Growth
ETF growth expands the range of products traded and cleared by the securities exchange market. Global ETF assets under management reached USD 19.84 trillion at the end of 2025, after increasing 33% from 2024. Record net inflows reached USD 2.1 trillion during 2025, which was nearly 3.5 times the flows recorded by mutual funds. Active ETF launches rose 72% in 2025, showing that the format is extending beyond passive index tracking[2]. Creation and redemption activity can add liquidity to the underlying cash equity and fixed-income markets, which supports transaction-based exchange revenues. Nearly 80% of PwC survey respondents expected tokenization to expand the global reach of ETFs within 2 to 3 years.
Derivatives Adoption for Hedging and Risk Management
Derivatives demand remains a major driver for the securities exchange market because hedging and trading activity both use listed contracts. Global exchange-traded derivatives volume reached 88.58 billion contracts through July 2026, with equity contracts up 38.4% and energy derivatives up 62.3% from the same period in 2025[3]. Asia-Pacific recorded 59.13 billion contracts, representing 67% of the global year-to-date total. Japan Exchange Group reported FY2025 derivatives trading value of JPY 3,994 trillion (USD 26.8 trillion), and the March 2026 value reached a record JPY 587 trillion (USD 3.9 trillion). Eurex reported that equity derivatives volume grew 18% and interest rate derivatives volume increased 23% in July 2026 from July 2025. Higher volumes in short-dated options increase intraday activity and make clearing, margin, and risk controls central to venue operations.
Tokenized Securities, Green Bonds and Digital Asset Marketplaces
Tokenized instruments and sustainable finance products create new listing, trading, and post-trade opportunities for the securities exchange market. NYSE National Rule 7.39 became effective in May 2026 and enabled trading of securities in tokenized form under the relevant pilot framework. DTCC plans to launch its DTC tokenization service in October 2026 after processing USD 4.7 quadrillion in securities transactions during 2025[4]. Cumulative labeled sustainable bond issuance reached USD 7.25 trillion by March 2026, and green bonds represented 64% of the USD 270 billion issued in Q1 2026. Policy support for listed products and direct financing can sustain demand for exchange-based instruments in China. Operators investing in digital issuance and post-trade systems can serve both tokenized products and sustainable instruments through connected infrastructure.
Restraints Impact Analysis*
| Restraint | % Impact on CAGR Forecast | Geographic Relevance | Impact Timeline |
|---|---|---|---|
| Regulatory Complexity and Compliance Costs | -1.6% | Global; highest burden in North America and Europe | Short to medium term |
| Cybersecurity, Data-Privacy and Operational-Resilience Risks | -0.8% | Global | Short term (≤ 2 years) |
| Private-Market Financing as an Alternative to Public Listings | -1.4% | North America and Europe primarily, with emerging in the Asia-Pacific | Medium to long term |
| Post-Trade Fragmentation, Collateral Intensity and Settlement Friction | -0.7% | Global; cross-border impacts are most severe | Medium term (2–4 years) |
| Source: Mordor Intelligence | |||
Regulatory Complexity and Compliance Costs
Regulatory requirements increase operating costs for venues, broker-dealers, and other securities exchange market participants. New incident-response and data-protection requirements add implementation obligations for regulated firms. The 2026 CAT NMS Plan budget was USD 156 million, reduced from USD 248 million in 2025, but it still shows the scale of market surveillance expenditure. European Union Regulation 2025/2075 requires T+1 settlement by October 11, 2027, while ESMA set December 7, 2026, as the first deadline for standardized electronic allocations. These obligations favor larger multi-asset groups that can fund compliance technology and automation at scale. Smaller and specialist venues face a heavier relative cost burden, which can support consolidation.
Private-Market Financing as an Alternative to Public Listings
Private-market funding can reduce the near-term supply of new listings for the securities exchange market. Regulatory compliance costs for public company status increased 18% from 2024, creating a more difficult path for companies valued below USD 2 billion. IPO issuance volume was 37% below 2024 levels through mid-July 2026. The average time to IPO for a venture-backed company is 14 years, while the average private equity buyout is held for 7 years, up from 5.5 years. This pattern delays listing fees and other primary-market revenues, even when companies eventually return to public markets. Exchanges with established issuer relationships and capital markets capabilities remain better placed when deferred exits come to market.
*Our forecasts treat driver/restraint impacts as directional, not additive. The impact forecasts reflect baseline growth, mix effects, and variable interactions.
Segment Analysis
By Market Function: Secondary Infrastructure Anchors Revenue While Primary Markets Accelerate
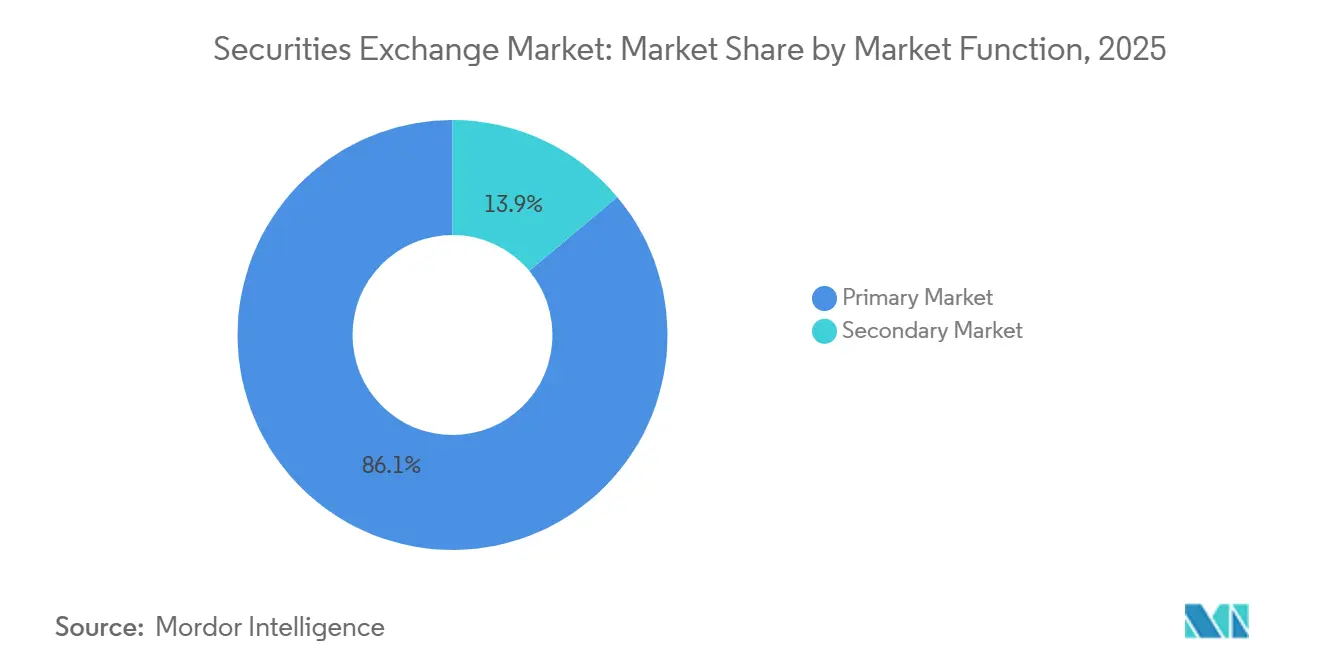
Secondary markets captured 86.1% of the securities exchange revenue share in 2025 because continuous price discovery and order matching support recurring transaction income. Institutional block orders, algorithmic market making, and retail flow support the segment’s scale. Off-exchange venues compete for the same order flow, particularly in United States equities. Even so, secondary infrastructure remains fundamental to liquidity and trading activity. Its size reflects the daily use of exchange systems across multiple investor groups.
Primary markets are projected to expand at a 7.2% CAGR through 2031, making them the fastest-growing market-function segment. Tokenized securities and direct listings broaden capital formation beyond conventional initial public offerings. The United States Securities and Exchange Commission’s emerging growth company review can influence the recovery path for new issuers. The European Union’s Capital Markets Union framework also affects the environment for public issuance. On-chain issuance can allow secondary trading from the point of issuance, reducing the separation between primary and secondary activity.
By Instrument/Asset Class: Derivatives Dominance Masks ETF Structural Shift
Derivatives captured 37.6% of the securities exchange revenue share in 2025, supported by equity, commodity, and interest rate contracts. Global derivatives volume through July 2026 increased 36.4% year over year. Equity contracts delivered the largest absolute increase, while energy derivatives increased 62.3%. The segment benefits from demand for both hedging and directional trading. Its broad product range gives major operators exposure to several asset classes.
ETFs and ETPs are projected to grow at a 9.4% CAGR through 2031. PwC expects global ETF assets under management to reach USD 35 trillion by June 2030, compared with USD 19.84 trillion at the end of 2025. Cash equities and fixed-income securities remain significant sources of exchange revenue, and GSSS bond issuance reached USD 270 billion in Q1 2026. Structured products and other listed securities serve specialist demand for capital protection and volatility overlays. Active ETF launches show the growing relevance of exchange-based price transparency for issuers.
By Service/Revenue Stream: Data Monetization Reshapes Exchange Revenue Architecture
Trading and execution services captured 42.3% of the securities exchange revenue share in 2025. These services remain tied to the volume and mix of activity across cash and derivatives markets. They are the core transaction-facing part of many exchange business models. High-volume trading also supports related demand for market connectivity and clearing services. This revenue stream remains important even as operators diversify their offerings.
Market data, index, and analytics are projected to grow at a 9.1% CAGR through 2031, the fastest rate among service streams. Nasdaq reported USD 3.3 billion in annualized recurring revenue in Q2 2026, up 11% year over year, while Financial Technology's annualized recurring revenue grew 16%. LSEG reported 7.3% growth in FTSE Russell revenue and 8.9% growth in Markets revenue for 2025. Euronext reported EUR 72.3 million (USD 78.1 million) in Advanced Data Solutions revenue in Q2 2026, up 11% year over year. Listing services remain exposed to private-market funding, while post-trade and connectivity services benefit from T+1 investment. Data and analytics are increasingly important to margins, but technology platforms also compete for information services revenue.
By Participant Type: Buy-Side Scale Coexists with Retail Structural Momentum
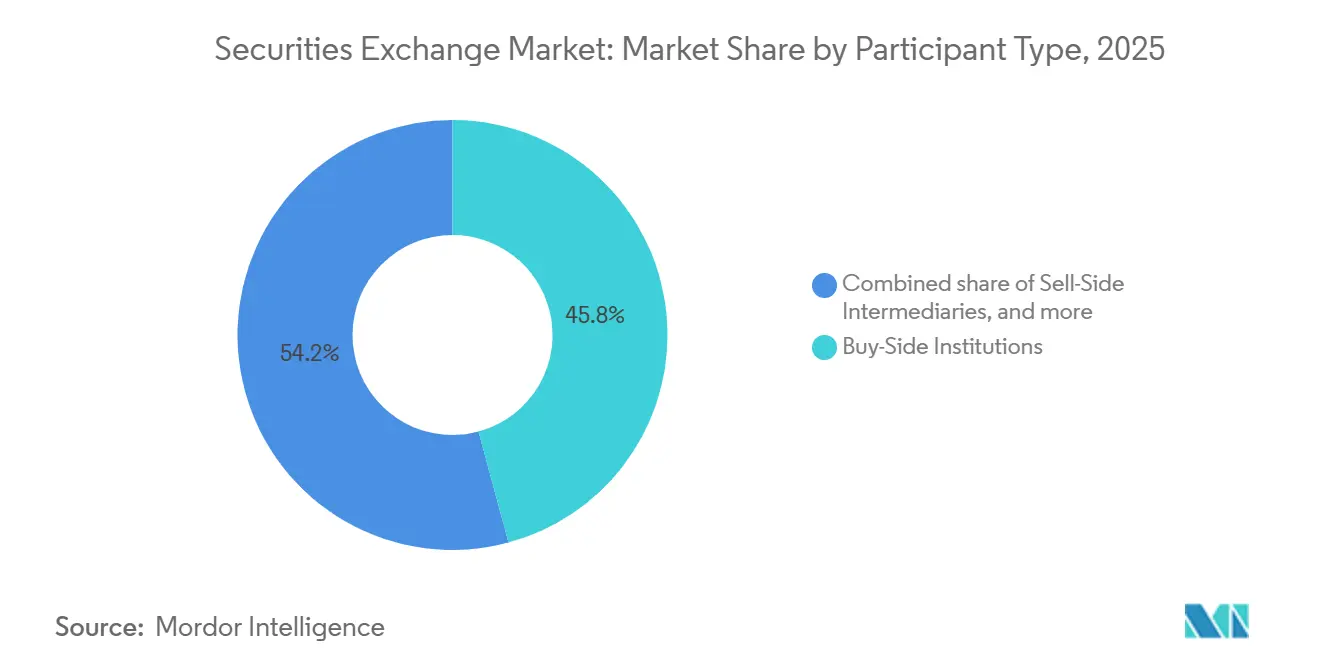
Buy-side institutions captured 45.8% of the securities exchange revenue share in 2025. Pension funds, asset managers, and hedge funds direct a substantial share of block and algorithmic orders through exchange systems. Sell-side intermediaries and liquidity providers support price formation and market depth. Issuers use listing and capital-formation services that are linked to primary-market cycles. This mix makes institutional activity central to exchange revenue.
Retail investors are projected to grow at an 8.3% CAGR through 2031, the fastest rate among participant types. Retail options trading can produce higher-fee volumes for United States venues, and payment-for-order-flow data showed retail trading activity increased 51% year over year in Q3 2025. SEBI reported that demat accounts reached 225 million in FY26. Greater retail engagement expands the participant base without requiring equivalent increases in exchange infrastructure costs. It also adds to the demand for accessible products and digital brokerage connections.
By Exchange Type: Multi-Asset Consolidation Runs Parallel to Digital Venue Emergence
Multi-asset exchange groups captured 53.2% of the securities exchange revenue share in 2025. Their positions span equities, fixed income, and derivatives. Cross-selling, data bundles, and clearing networks support their business models. National exchanges provide domestic price discovery and listing services. Regional and cross-border venues support international capital flows, while specialist exchanges remain important in commodity and energy derivatives.
Digital and tokenized securities venues are projected to grow at an 18.2% CAGR through 2031. The securities exchange market size for this segment is supported by regulatory frameworks and planned operating infrastructure, and NYSE National Rule 7.39 and DTCC’s planned October 2026 service launch provide a pathway from policy development to operational use. The forecast reflects infrastructure investment ahead of wider adoption. Early-moving incumbents have compliance, clearing, and distribution capabilities that can support their position. Digital venues nonetheless add competitive pressure to traditional exchange groups.
Geography Analysis
North America captured 40.5% of the securities exchange revenue share in 2025, reflecting the depth of capital markets in the United States. United States-listed exchanges hold a central role in global equity and options activity. Off-exchange trading exceeded 50% of United States equity activity in every quarter of 2025, reducing on-exchange continuous trading volume to 42.7% in Q3 2025. Operators are responding through order-type development, extended trading, and tokenized securities infrastructure. TMX Group invested USD 800 million in the MEMX-BOX combination, creating a USD 2.3 billion United States-listed options entity that is expected to hold 10% of listed-options volume.
Europe remains important to the securities exchange market through Euronext’s network and Deutsche Börse’s Eurex franchise. Euronext’s Capital Markets and Data Solutions revenue increased 17.2% year over year in Q2 2026, while its Primary Markets revenue was EUR 54.2 million (USD 58.5 million), up 16.4%. Deutsche Börse expects full-year 2026 net revenue of more than EUR 6.4 billion (USD 6.9 billion), and the European Union T+1 transition requires material automation investment before October 11, 2027. The Middle East and Africa also gained relevance, as Nasdaq Dubai’s outstanding debt securities exceeded USD 143.9 billion in September 2026, including USD 27.5 billion in ESG-related listings.
Asia-Pacific is projected to grow at a 7.5% CAGR through 2031, the fastest geographic rate in the securities exchange market. India ranked first globally in IPO volumes in 2025 and recorded a market capitalization of USD 4.4 trillion in 2026. Main-board IPO fundraising in FY26 reached INR 1.8 lakh crore (USD 21.1 billion), with 366 newly listed companies. As reported in 2026, Asia accounted for 56% of listed companies globally, although valuation discounts remained a concern. Hong Kong Exchanges and Clearing proposed a T+1 cash-market settlement cycle for Q4 2027, while Japan’s March 2026 derivatives value reached JPY 587 trillion (USD 3.9 trillion), and 66% of surveyed firms planned to expand their Asia-Pacific business over the following 3 years.
Competitive Landscape
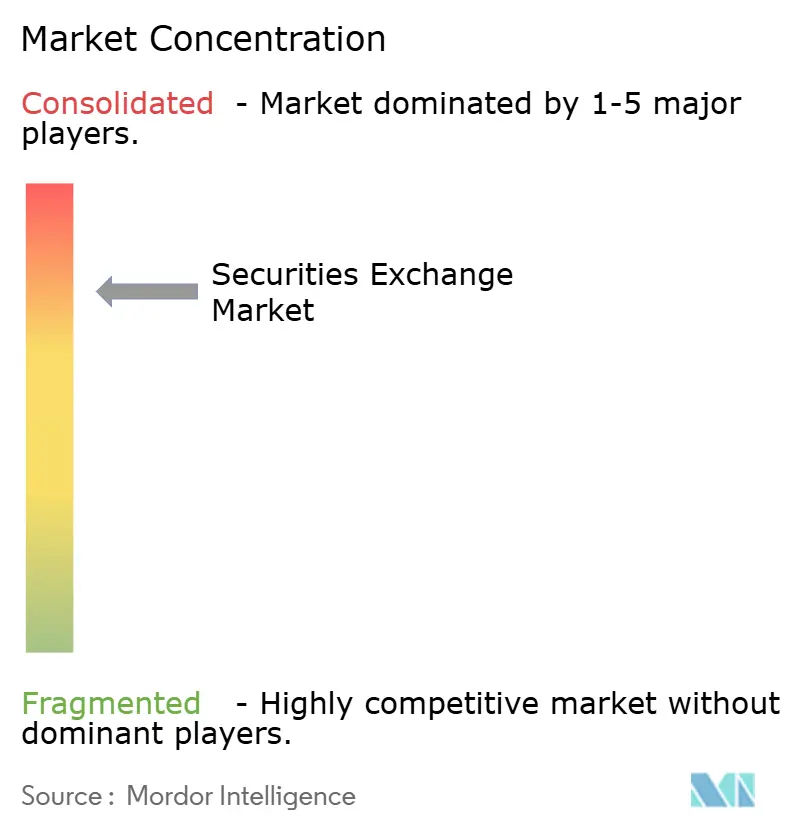
The securities exchange market has concentrated global infrastructure groups alongside a wide range of national and specialist venues. ICE, Nasdaq, LSEG, Deutsche Börse, and CME operate across trading, clearing, and market-data services. National and specialist exchanges continue to compete for domestic and asset-specific order flow, while this structure enables large groups to spread technology and compliance costs across several businesses. It also leaves room for venues that serve particular regional markets or instruments.
ICE’s planned acquisition of MarketAxess shows how leading companies are using acquisitions to build scale in fixed-income trading. The transaction has an equity value of USD 6 billion and represents a 33% premium. It would extend ICE’s position in a global bond market estimated at USD 145.1 trillion. TMX Group’s MEMX-BOX transaction follows a similar approach, combining venues to build a United States options operator with an expected 10% volume share. The securities exchange market continues to favor companies that can connect trading technology, clearing, and data services.
Technology has become a key basis of competition in the securities exchange market. ICE reported USD 794 billion in ETF assets benchmarked to its indices at the end of 2025, more than 20% above 2024. Nasdaq’s Financial Technology annualized recurring revenue increased 16% year over year in Q2 2026. ICE, Nasdaq, and DTCC have also pursued tokenization-related infrastructure initiatives during 2026, while retail fixed-income access, climate and carbon infrastructure, and programmable settlement remain areas where established operators have data assets but may need broader consumer-facing distribution. Tokenized securities operators and post-trade technology providers add further competitive pressure in these areas.
Securities Exchange Industry Leaders
-
CME Group Inc.
-
Intercontinental Exchange, Inc.
-
London Stock Exchange Group plc
-
Deutsche Börse AG
-
Nasdaq, Inc.
- *Disclaimer: Major Players sorted in no particular order
Recent Industry Developments
- September 2026: Broadridge launched DLX, an end-to-end tokenization and digital asset infrastructure platform connecting to the DTCC Tokenization Service via Canton and other chains, processing more than USD 350 billion in daily activity. DLX provides financial institutions with an accelerated pathway to on-chain operations while preserving existing controls and connectivity.
- September 2026: Nasdaq Dubai listed USD 713 million in dual-currency green bonds by ICBC under a China-Arab States Renewable Energy Cooperation theme, with the USD tranche oversubscribed 3.8 times. Total outstanding debt on Nasdaq Dubai surpassed USD 143.9 billion, including USD 27.5 billion in ESG-related listings.
- July 2026: Securitize Corp. is listed on the NYSE under the ticker SECZ and simultaneously tokenized its common stock on Avalanche and Solana, becoming the first company to bring public equity on-chain on listing day. This demonstrated that tokenized securities can be issued under existing United States securities law, establishing a structural precedent for exchange-listed digital equity.
- July 2026: ICE announced a definitive agreement to acquire MarketAxess for USD 6 billion in equity value, a 33% premium, creating a fixed-income ecosystem for 2,100 institutional clients across more than 90 countries. USD 100 million in annual run-rate synergies are targeted within 3 years, with closing expected in H1 2027.
Global Securities Exchange Market Report Scope
| Primary Market |
| Secondary Market |
| Cash Equities | |
| Fixed Income Securities | Government bonds |
| Corporate bonds | |
| Green, social, sustainability, and sustainability-linked bonds | |
| Other Fixed Income Securities | |
| Derivatives | Equity derivatives |
| Commodity derivatives | |
| Other derivatives | |
| Exchange-Traded Funds and Exchange-Traded Products | Equity ETFs/ETPs |
| Fixed-income ETFs/ETPs | |
| Commodity ETFs/ETPs | |
| Multi-asset / thematic ETFs/ETPs | |
| Structured Products and Other Listed Securities |
| Trading and Execution Services |
| Listing and Issuer Services |
| Post-Trade Services |
| Market Data, Index, and Analytics |
| Connectivity, Access, and Technology Services |
| Other Exchange-Adjacent Services |
| Buy-Side Institutions |
| Sell-Side Intermediaries |
| Liquidity Providers |
| Issuers |
| Retail Investors |
| Specialist / Single-Asset Exchanges |
| Multi-Asset Exchange Groups |
| National Exchanges |
| Regional / Cross-Border Exchanges |
| Digital Securities / Tokenized Securities Venues |
| North America | United States |
| Canada | |
| Mexico | |
| South America | Brazil |
| Argentina | |
| Rest of South America | |
| Europe | United Kingdom |
| Germany | |
| France | |
| Italy | |
| Spain | |
| Rest of Europe | |
| Asia-Pacific | China |
| Japan | |
| India | |
| South Korea | |
| Australia | |
| Indonesia | |
| Thailand | |
| Malaysia | |
| Singapore | |
| Vietnam | |
| Rest of Asia-Pacific | |
| Middle East and Africa | Saudi Arabia |
| United Arab Emirates | |
| Turkey | |
| South Africa | |
| Egypt | |
| Rest of Middle East and Africa |
| By Market Function | Primary Market | |
| Secondary Market | ||
| By Instrument / Asset Class | Cash Equities | |
| Fixed Income Securities | Government bonds | |
| Corporate bonds | ||
| Green, social, sustainability, and sustainability-linked bonds | ||
| Other Fixed Income Securities | ||
| Derivatives | Equity derivatives | |
| Commodity derivatives | ||
| Other derivatives | ||
| Exchange-Traded Funds and Exchange-Traded Products | Equity ETFs/ETPs | |
| Fixed-income ETFs/ETPs | ||
| Commodity ETFs/ETPs | ||
| Multi-asset / thematic ETFs/ETPs | ||
| Structured Products and Other Listed Securities | ||
| By Service and Revenue Stream | Trading and Execution Services | |
| Listing and Issuer Services | ||
| Post-Trade Services | ||
| Market Data, Index, and Analytics | ||
| Connectivity, Access, and Technology Services | ||
| Other Exchange-Adjacent Services | ||
| By Participant Type | Buy-Side Institutions | |
| Sell-Side Intermediaries | ||
| Liquidity Providers | ||
| Issuers | ||
| Retail Investors | ||
| By Exchange Type | Specialist / Single-Asset Exchanges | |
| Multi-Asset Exchange Groups | ||
| National Exchanges | ||
| Regional / Cross-Border Exchanges | ||
| Digital Securities / Tokenized Securities Venues | ||
| By Geography | North America | United States |
| Canada | ||
| Mexico | ||
| South America | Brazil | |
| Argentina | ||
| Rest of South America | ||
| Europe | United Kingdom | |
| Germany | ||
| France | ||
| Italy | ||
| Spain | ||
| Rest of Europe | ||
| Asia-Pacific | China | |
| Japan | ||
| India | ||
| South Korea | ||
| Australia | ||
| Indonesia | ||
| Thailand | ||
| Malaysia | ||
| Singapore | ||
| Vietnam | ||
| Rest of Asia-Pacific | ||
| Middle East and Africa | Saudi Arabia | |
| United Arab Emirates | ||
| Turkey | ||
| South Africa | ||
| Egypt | ||
| Rest of Middle East and Africa | ||
Key Questions Answered in the Report
What is driving growth in securities exchanges?
Electronic trading, derivatives activity, retail brokerage access, ETF expansion, and data services support growth. The securities exchange market is forecast to grow at a 6.2% CAGR through 2031. Tokenized products and sustainable debt listings also create opportunities for listing, trading, and post-trade services. Operators are investing in technology, clearing, and data capabilities to address these changes.
Which instrument has the highest growth outlook?
ETFs and ETPs have the highest projected instrument growth rate at 9.4% CAGR through 2031. The securities exchange market benefits when ETF creation and redemption activity supports liquidity in the underlying equity and fixed-income securities. Active ETF launches also extended beyond traditional passive tracking during 2025.
Why are derivatives important to exchange operators?
Derivatives held 37.6% share in 2025 and global listed-contract volume reached 88.58 billion through July 2026. The securities exchange market earns transaction, clearing, and connectivity revenue from activity in equity, commodity, and interest rate contracts. Growth in short-dated options also increases the importance of intraday risk controls.
Which region is growing fastest for securities exchanges?
Asia-Pacific is projected to grow at a 7.5% CAGR through 2031, supported by India, China, Hong Kong, and Japan. The securities exchange market in the region benefits from record fundraising in India, increased options activity in China, and settlement modernization in Hong Kong. Japan also reported record derivatives value in March 2026.
How are tokenized securities affecting exchanges?
Digital and tokenized securities venues are projected to grow at an 18.2% CAGR through 2031, supported by new regulatory and post-trade infrastructure. The securities exchange market is adapting as trading, custody, and settlement systems prepare to support securities in tokenized form. NYSE National and DTCC made related progress during 2026.
What is the largest service revenue stream?
Trading and execution services held 42.3% share in 2025, while market data, index, and analytics segment is projected to grow at 9.1% CAGR. The securities exchange market is increasing its focus on recurring information-services revenue through index licensing, analytics subscriptions, and compliance-data products. These services complement revenue from transaction-based activity. The securities exchange market also relies on resilient technology and reliable distribution links across participants and the full range of traded products.