Market Overview
| Study Period | 2021 - 2031 |
|---|---|
| Forecast Data Period | 2026 - 2031 |
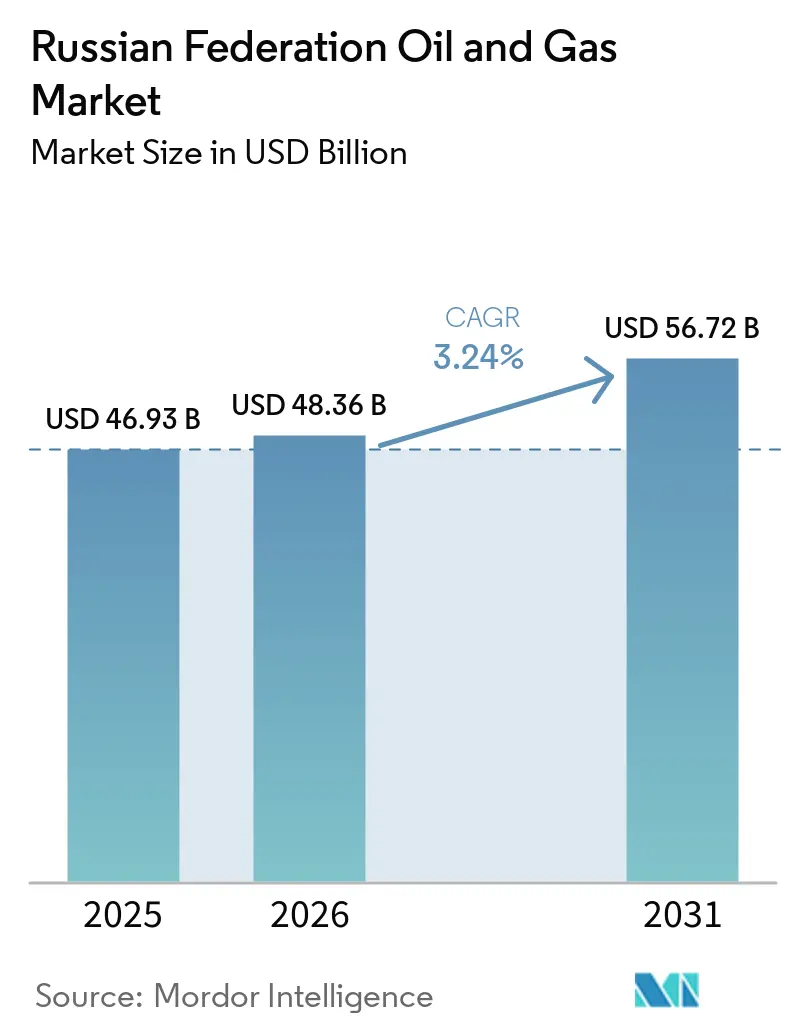
| Base Year Market Size (2025) | USD 46.93 Billion |
| Market Size (2026) | USD 48.36 Billion |
| Market Size (2031) | USD 56.72 Billion |
| Growth Rate (2026 - 2031) | 3.24% CAGR |
| Market Concentration | High |
Major Players *Disclaimer: Major Players sorted in no particular order Image © Mordor Intelligence. Reuse requires attribution under CC BY 4.0. | |
Russian Federation Oil And Gas Market Analysis by Mordor Intelligence
The Russian Federation Oil And Gas Market size is expected to grow from USD 46.93 billion in 2025 to USD 48.36 billion in 2026 and is forecast to reach USD 56.72 billion by 2031 at 3.24% CAGR over 2026-2031.
Structural realignment toward Asian energy corridors, accelerated investments in Arctic megaprojects, and rapid domestic technology substitution underpin this steady expansion despite sanctions pressure. Upstream operations are dominant, yet midstream build-outs, chiefly ESPO and Power of Siberia routes, will contribute out-sized incremental value over the forecast horizon. Offshore Arctic and Sakhalin fields are expected to outpace onshore output growth because of LNG tie-ins and subsea developments that command higher margins once operational. Downstream refiners continue to pivot toward polymers and specialty products, cushioning domestic margins as Europe’s refined-product demand erodes.
Key Report Takeaways
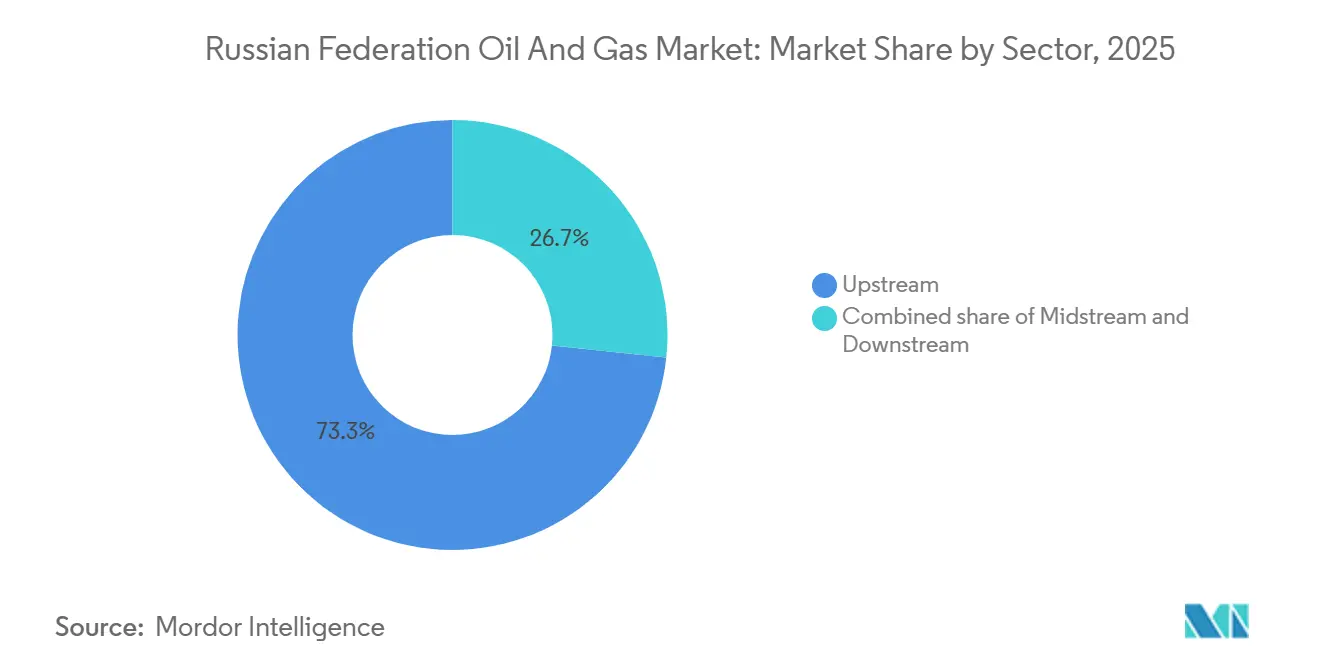
- By sector, upstream led with 73.34% of Russia Federation's oil and gas market share in 2025, while midstream is expected to expand at a 4.56% CAGR through 2031.
- By location, onshore assets accounted for 70.6% share of Russia Federation oil and gas market size in 2025, and offshore is projected to advance at a 6.7% CAGR through 2031.
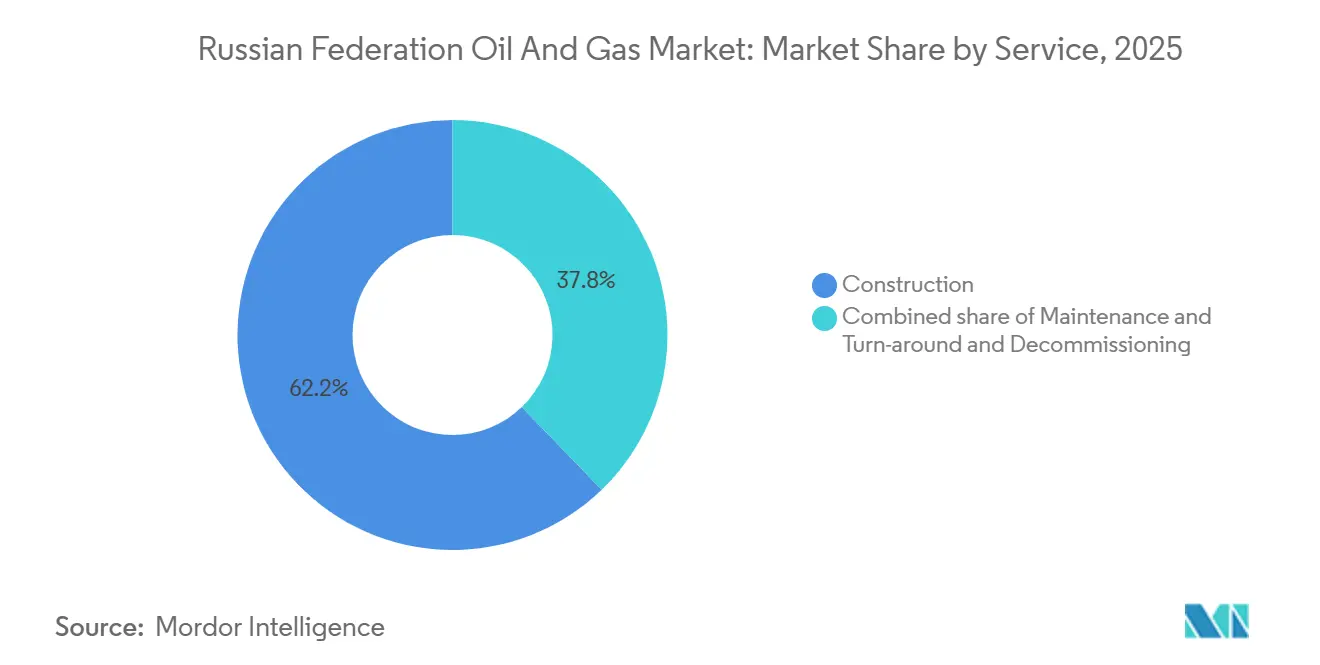
- By service, construction captured 62.2% share of Russia Federation's oil and gas market size in 2025; decommissioning is projected to grow at an 8.2% CAGR to 2031.
Note: Market size and forecast figures in this report are generated using Mordor Intelligence’s proprietary estimation framework, updated with the latest available data and insights as of 2026.
Russian Federation Oil And Gas Market Trends and Insights
Drivers Impact Analysis*
| Driver | (~) % Impact on CAGR Forecast | Geographic Relevance | Impact Timeline |
|---|---|---|---|
| Pivot to Asian export pipelines | +1.0% | Eastern & Far East Russia, China off-take | Medium term (2-4 years) |
| Arctic LNG and Vostok Oil megaprojects | +0.7% | Yamal-Nenets, Taymyr; Northern Sea Route | Long term (≥ 4 years) |
| Government tax incentives for EOR & LNG | +0.5% | Western Siberia, Yamal, Sakhalin | Short term (≤ 2 years) |
| Petrochemical demand from import substitution | +0.4% | Nationwide; Amur, Tatarstan, Tobolsk | Medium term (2-4 years) |
| Indigenous digital upstream technologies | +0.2% | Western Siberia, Sakhalin | Medium term (2-4 years) |
| Far-East energy-corridor build-out | +0.3% | Khabarovsk, Primorsky Krai | Short term (≤ 2 years) |
| Source: Mordor Intelligence | |||
Pivot to Asian Export Pipelines (Power of Siberia 2, ESPO Expansion)
Gazprom and China National Petroleum Corporation cemented the 50 bcm-per-year Power of Siberia 2 deal in 2025, advancing Russia’s multi-line gas pivot eastward. Construction lead times of roughly five years plus staged ramp-up will dovetail with the ESPO oil pipeline, which already moved about 1 million bpd to Asia in January 2026. Transneft redirected close to 56 million tonnes from Europe toward eastern and southern routes across 2024-25, signaling a permanent re-orientation of crude logistics. Although price discounts of up to 38% against Brent eroded margins, guaranteed Chinese and Indian offtake stabilized production schedules.
Arctic LNG & Vostok Oil Megaproject Investments
Novatek's Arctic LNG 2 shipped 1.2 million tonnes across 17 cargoes in 2025 at 30-40% discounts to secure Asian buyers, while Train 2 outages and Train 3 mothballing exposed sanction-related equipment gaps. Rosneft's 100 million-tonne-per-year Vostok Oil remained on track for 2026 first oil, banking on Northern Sea Route logistics and domestic icebreaker support. Together, they anchor the long-term upside for the Russian Federation's oil and gas market, albeit with financing and technology contingencies.
Government Tax Incentives for EOR & LNG
Tax relief worth 64 billion rubles (USD 710 million) granted to Gazprom between 2026-28, coupled with an impending upstream tax maneuver, lowers break-evens on brownfield EOR and new LNG modules. Accelerated depreciation schedules help mature Western Siberian assets, such as Vatyeganskoye, deploy polymer flooding at competitive economics.[1]Lukoil, “Annual Report 2024,” lukoil.com
Petrochemical Demand from Import Substitution
SIBUR’s Amur Gas Chemical Complex, at 88% completion in late 2024, will add 2.7 million tpa of polymers, absorbing surplus gas and replacing banned European imports. Deputy Prime Minister Novak forecasts USD 39.4-52.6 billion in petro-capex by 2030, underpinning steady feedstock demand for the Russian Federation oil and gas market.
Restraints Impact Analysis*
| Restraint | (~) % Impact on CAGR Forecast | Geographic Relevance | Impact Timeline |
|---|---|---|---|
| Western sanctions on technology & finance | −1.2% | Nationwide; acute in Arctic LNG & deep-water projects | Short term (≤ 2 years) |
| Oil-price volatility | −0.6% | National revenue & upstream investment | Short term (≤ 2 years) |
| Permafrost-thaw pipeline damage risk | −0.2% | Arctic and sub-Arctic zones | Medium term (2-4 years) |
| Demographic decline in remote basins | −0.1% | Western Siberia, Yamal-Nenets, Sakhalin | Long term (≥ 4 years) |
| Source: Mordor Intelligence | |||
Western Sanctions on Technology & Finance
Successive U.S. and EU measures have cut Russia off from LNG modules, subsea hardware, project finance, and key tanker insurance, widening Urals-Brent discounts to 37% in November 2025. Operators replaced service majors with domestic or Chinese gear, yet reliability issues, from Arctic LNG 2’s electrical failures to Sakhalin-3 delays, underscore enduring execution risk.
Oil-Price Volatility
Federal budgets based on USD 69.7 Urals assumptions saw actual realizations dip to the low-sixties in 2025, tightening fiscal space for subsidies and delaying discretionary capex. Ruble swings further cloud earnings visibility, forcing operators to prioritize quick-payout brownfields over frontier acreage.
*Our forecasts treat driver/restraint impacts as directional, not additive. The impact forecasts reflect baseline growth, mix effects, and variable interactions.
Segment Analysis
By Sector: Upstream Dominance, Midstream Momentum
Upstream generated 73.34% of the 2025 value, keeping the Russian Federation oil and gas market anchored to production volumes that exceeded 10 million bpd of crude and 672 billion m³ of gas.[2]BP Analysts, “Statistical Review of World Energy 2025,” bp.com Yet midstream is forecast to log a 4.56% CAGR through 2031 as ESPO, Caspian Pipeline Consortium, debottlenecking, and Power of Siberia lines absorb redirected volumes. Transneft alone earmarked 1.5 trillion rubles (USD 16.6 billion) for 2024-28, 97% of which sources domestic equipment, a testament to import substitution shaping Russia Federation oil and gas market dynamics.[3]Transneft Press Office, “Achinsk Pumping Station Upgrade,” transneft.ru
Downstream refiners face thin margins as Europe blocks Russian products, prompting a pivot to petrochemicals. The Amur Gas Chemical Complex and Nizhnekamskneftekhim’s EP-600 ethylene unit exemplify this shift, converting feedstock into higher-value polymers that cushion earnings and buoy the Russian Federation oil and gas industry’s integration thrust.


By Location: Onshore Maturity vs. Offshore Upside
Onshore assets retained 70.6% of 2025 revenue, but declining reservoir pressure in Western Siberia forces heavier EOR spend, nudging operators toward higher-margin offshore plays. Offshore projects, though less than one-third of current output, will grow at 6.7% CAGR to 2031, led by Sakhalin-2 license extensions and new Arctic LNG feed-gas fields. The Russian Federation's oil and gas market size for offshore segments will therefore climb faster than onshore despite greater capital intensity and sanction-linked procurement lags.
By Service: Construction Heavyweight, Decommissioning Emergent
Construction commanded 62.2% of 2025 expenditure as pipelines, Arctic port facilities, and gas-to-polymer plants raced to completion. Maintenance and turnaround budgets remain significant amid aging 1970s-era Siberian infrastructure, yet decommissioning, forecast at an 8.2% CAGR, offers a nascent high-growth niche inside the Russia Federation oil and gas market. Regulatory clarity on financial provisioning will decide how quickly this segment scales.
Geography Analysis
Western Siberia continues to supply the bulk of national crude, though production growth is flat as operators deploy polymer flooding and water-alternating-gas to sustain legacy wells. Sakhalin, Russia’s LNG crown jewel, enjoys ice-free year-round shipping and a planned capacity bump via a third 4.8 mtpa train once feedstock certainty improves. Yamal and the wider Arctic promise transformational volumes, over 130 million tpa of future oil and LNG cargoes, but are exposed to permafrost-related pipeline stress and ice-class fleet shortages. Finally, the Far East energy corridor, anchored by ESPO and Kozmino, has become Russia’s prime outlet to Asian buyers, moving 1 million bpd in January 2026 and proving resilient even as Western sanctions tightened. Collectively, these geographic pivots insulate the Russian Federation's oil and gas market from European demand shocks and support the forecast growth trajectory.
Competitive Landscape
State-controlled giants, Rosneft, Gazprom, Lukoil, and Novatek, dominate production, pipelines, and LNG, together accounting for well above 70% of national output. Gazprom and Lukoil’s 2025-30 strategic alliance reduces duplicate spending and accelerates shared technology deployment. Novatek’s 60% profit slide to USD 2.37 billion in 2025, tied to Arctic LNG 2 issues, illustrates sanction-induced vulnerability for non-state LNG specialists. Prospective mega-mergers, such as Moscow’s exploration of combining Rosneft with select Gazprom and Lukoil units, signal a push toward deeper vertical integration to weather capital-market isolation.[4]Wall Street Journal Reporters, “Russia Explores Merger of Rosneft, Gazprom, Lukoil Assets,” wsj.com Midstream bottlenecks and decommissioning gaps create limited white-space for smaller domestic players, but technology substitution agreements with Chinese vendors offer a pathway for niche service entrants.
Russian Federation Oil And Gas Industry Leaders
Rosneft Oil Company PJSC
PJSC Gazprom
PJSC Lukoil Oil Company
Transneft Group
PJSC ANK Bashneft
- *Disclaimer: Major Players sorted in no particular order


Recent Industry Developments
- February 2026: Novatek’s FY 2025 profit declined 60% to USD 2.37 billion on Arctic LNG 2 disruptions.
- September 2025: Arctic LNG 2’s Train 2 faced electrical faults while Train 3 was mothballed for two years.
- September 2025: Gazprom-CNPC signed the binding Power of Siberia 2 memorandum and lifted Power of Siberia 1 capacity to 44 bcm/y.
- August 2025: Gazprom and CNPC finalized Power of Siberia 2 gas pricing, clearing the path for a late-2026 construction start.


Russian Federation Oil And Gas Market Report Scope
The oil and natural gas market is a major industry in the energy market and plays an influential role in the global economy as the world's primary fuel source. The processes and systems involved in producing and distributing oil and gas are highly complex, capital-intensive, and require state-of-the-art technology. The oil and gas value chain includes extraction of petroleum, refining, transportation, and retailing. The scope of the Russian Federation's oil and gas market includes:
By Sector
| Upstream |
| Midstream |
| Downstream |
By Location
| Onshore |
| Offshore |
By Service
| Construction |
| Maintenance and Turn-around |
| Decommissioning |
| By Sector | Upstream |
| Midstream | |
| Downstream | |
| By Location | Onshore |
| Offshore | |
| By Service | Construction |
| Maintenance and Turn-around | |
| Decommissioning |


Key Questions Answered in the Report
What is the projected value of the Russia Federation oil and gas market by 2031?
It is forecast to reach USD 56.72 billion in 2031, up from USD 48.36 billion in 2026.
Which segment is expected to record the fastest growth through 2031?
Midstream infrastructure is projected to expand at a 4.56% CAGR as new oil and gas routes to Asia come online.
How will Power of Siberia 2 influence Russian gas flows to Asia?
The 50 billion m³-per-year pipeline, slated to start construction in late 2026, will anchor long-term supply commitments to China and diversify export dependence away from Europe.
What main hurdles does Arctic LNG 2 face under sanctions?
Restrictions on specialized liquefaction modules and financing have cut Train 1 utilization to about 55% and delayed Trains 2-3, forcing Novatek to sell cargoes at steep discounts.
Why are petrochemical investments accelerating in Russia?
Domestic producers are building large gas-to-polymer complexes such as the Amur facility to replace banned European imports and secure higher margins than traditional fuels.
What CAGR is expected for decommissioning services over the forecast period?
Decommissioning activities tied to aging Western Siberian fields are projected to rise at an 8.2% CAGR through 2031 as regulations on well-abandonment tighten.
Page last updated on:


