
Retail Media In OTT Market Size and Share
Market Overview
| Study Period | 2020 - 2031 |
|---|---|
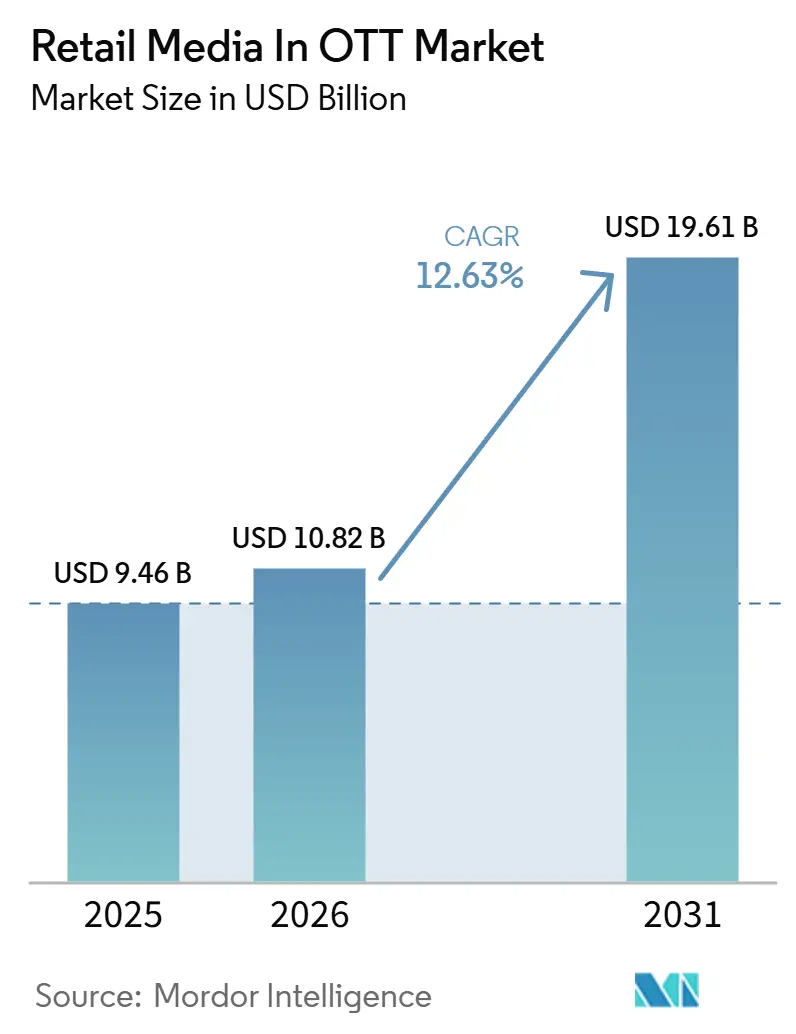
| Market Size (2026) | USD 10.82 Billion |
| Market Size (2031) | USD 19.61 Billion |
| Growth Rate (2026 - 2031) | 12.63 % |
| Fastest Growing Market | Asia-Pacific |
| Largest Market | North America |
| Market Concentration | High |
Major Players *Disclaimer: Major Players sorted in no particular order Image © Mordor Intelligence. Reuse requires attribution under CC BY 4.0. | |
Retail Media In OTT Market Analysis by Mordor Intelligence
The Retail Media in OTT Market size is projected to expand from USD 9.46 billion in 2025 and USD 10.82 billion in 2026 to USD 19.61 billion by 2031, registering a CAGR of 12.63% between 2026 to 2031. The retail media in OTT market is growing because retailers are no longer competing only for digital shelf visibility and are now also competing for premium streaming inventory that can be tied to purchase behavior. The category is being shaped by the use of first-party transaction data, which allows advertisers to connect streaming exposure with measurable shopping outcomes in a way that older television models could not support as effectively. The retail media in OTT market is also being pushed forward by shoppable video, off-site activation, and AI-led personalization, which are changing how advertisers price, plan, and optimize streaming campaigns. Large retailer-owned networks still hold the strongest position because they control shopper data, audience creation, and reporting in the same system, while streaming platforms and ad-tech firms are trying to build more open alternatives. Measurement fragmentation, tighter privacy compliance, and slower budget growth among large advertiser groups are still important constraints, and these pressures are likely to favor partnerships, infrastructure scale, and selective consolidation.
Key Report Takeaways
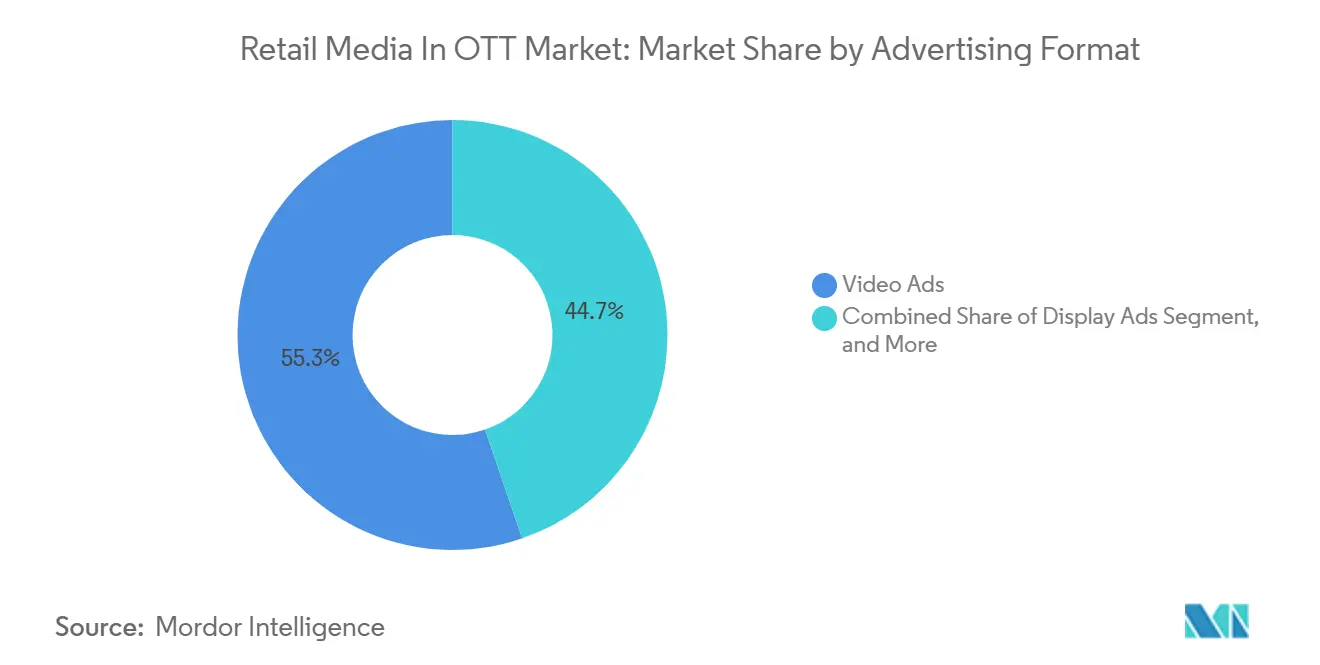
- By advertising format, video ads accounted for 55.26% of the retail media in OTT market size in 2025 and are projected to expand at a 12.82% CAGR through 2031.
- By platform type, retailer-owned networks held 58.91% share of the retail media in OTT market in 2025, while third-party networks are projected to record the highest CAGR at 12.93% through 2031.
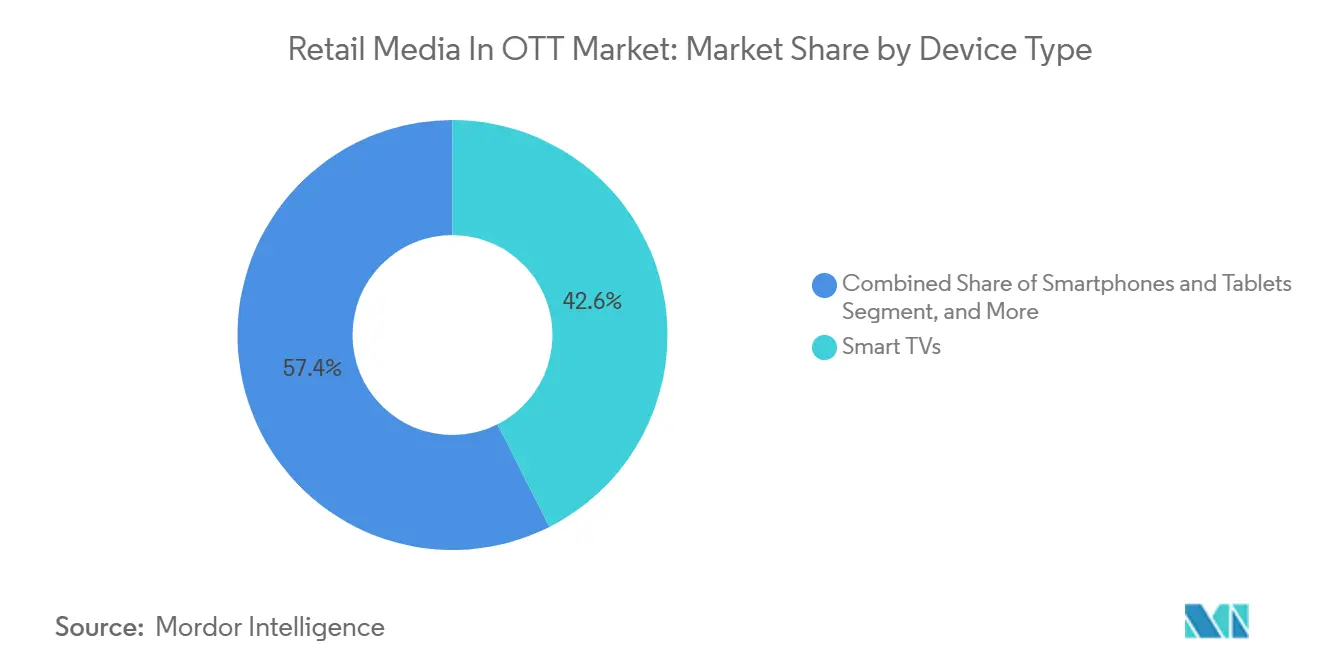
- By device type, smart TVs captured 42.56% share in 2025, while smartphones and tablets are expected to grow at a 13.11% CAGR through 2031.
- By end-user, consumer packaged goods held 32.22% of the retail media in OTT market size in 2025, while beauty and personal care is projected to expand at a 13.32% CAGR through 2031.
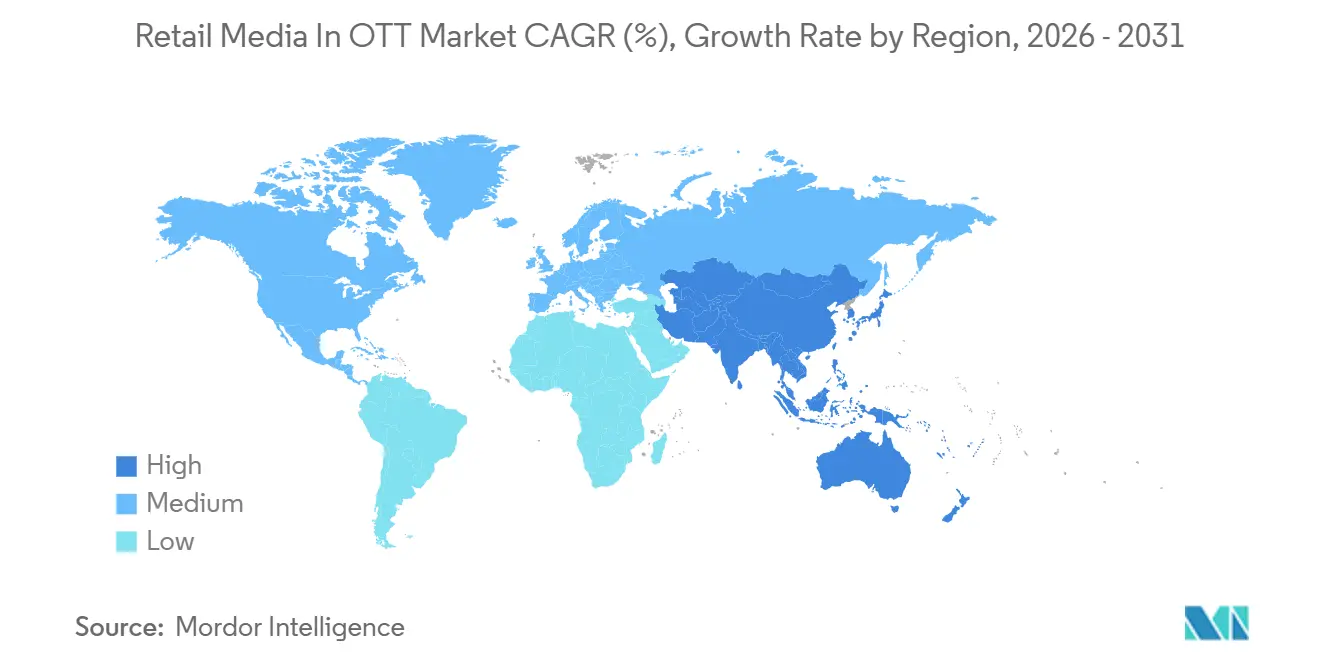
- By geography, North America held 51.24% of the retail media in OTT market share in 2025, while Asia-Pacific is projected to grow at a 13.42% CAGR through 2031.
Note: Market size and forecast figures in this report are generated using Mordor Intelligence’s proprietary estimation framework, updated with the latest available data and insights as of January 2026.
Market Trends and Insights
Drivers Impact Analysis of Retail Media In OTT Market*
| Driver | (~) % Impact on CAGR Forecast | Geographic Relevance | Impact Timeline | |
|---|---|---|---|---|
| First-Party Retailer Data Replacing Third-Party Cookie Dependence | +2.5% | Global, particularly North America and EU | Short term (≤ 2 years) | |
| Rising Demand for Closed-Loop Attribution in CTV | +2.3% | North America and EU core, spill-over to Asia-Pacific | Short term (≤ 2 years) | |
| Expansion of Shoppable Video and Interactive OTT Formats | +2% | Global, led by North America | Medium term (2-4 years) | |
| AI-Powered Audience Segmentation and Creative Optimization | +1.8% | North America and EU core, expanding to Asia-Pacific | Medium term (2-4 years) | |
| Off-Site Extension of Retail Media Beyond Owned Properties | +1.5% | North America, EU, Asia-Pacific | Medium term (2-4 years) | |
| Retailer Monetization Pressure From Commerce Margin Compression | +1.2% | Global | Short term (≤ 2 years) | |
| Source: Mordor Intelligence | ||||
First-Party Retailer Data Replacing Third-Party Cookie Dependence
First-party retailer data has become one of the clearest structural advantages in the retail media in OTT market because it gives advertisers access to verified shopping signals rather than inferred browsing behavior. Retailers with scaled loyalty programs and repeat transaction histories are in a stronger position because those datasets are easier to activate in privacy-aware environments than older cookie-based identifiers. European compliance frameworks are also reinforcing the need for clearer consent, more transparent processing, and stricter operational controls in commerce media measurement and activation.[1]IAB Europe, “IAB Europe Releases Updated Commerce Media Measurement Standards V2,” IAB Europe, iabeurope.eu This shifts the competitive balance toward companies that can connect consented shopper identity with streaming ad delivery in a way that platforms and supply partners can actually use in production. The retail media in OTT market, therefore, rewards data depth more than simple audience volume, especially when advertisers want measurable outcomes tied to real transactions. Mid-tier retailers without broad loyalty coverage are more likely to depend on consortium approaches or third-party partnerships if they want to remain relevant as targeting standards tighten.
Rising Demand For Closed-Loop Attribution In CTV
Closed-loop attribution has become a central reason advertisers are allocating more budget to the retail media in OTT market because it links ad exposure on streaming platforms to eventual purchase behavior. The IAB has pushed standardized Conversion APIs for connected TV because server-to-server measurement is increasingly seen as the practical bridge between media delivery and downstream business outcomes.[2]IAB, “Bridging the Outcome Gap, IAB Unveils New Guide on Standardized Conversion APIs for Connected TV,” IAB, iab.com NBCUniversal said at its 2026 Upfront presentation that its Instacart data integration delivered an average 5.5x return on ad spend for CPG brands and reached 51% new-to-brand users.[3]NBCUniversal Media, “NBCUniversal Delivers the Next Era of Media and Advertising at 2026 Upfront Presentation,” NBCUniversal, nbcuniversal.com Results of that kind are difficult for traditional linear television to replicate because they depend on direct shopper data and purchase feedback loops. In the retail media in OTT market, that changes how premium streaming inventory is valued because brands begin to assess it through performance outcomes instead of exposure alone. The result is a stronger push toward measurable video buying, tighter accountability, and more pressure on platforms that still cannot connect media spend with sales outcomes clearly enough.
Expansion Of Shoppable Video And Interactive OTT Formats
Shoppable and interactive formats have moved beyond isolated pilots and are becoming a more regular budget line inside the retail media in OTT market. In October 2025, the IAB Tech Lab released the CTV Ad Portfolio, which standardized 6 new ad formats, including pause ads, menu ads, screensaver ads, in-scene ads, squeezebacks, and overlays, and this opened more of the category to programmatic buying without high-friction direct execution. Amazon Ads said its Interactive Video Ads drove 6x higher brand search, 4x more product detail page views, and 5x higher purchase rates than standard streaming TV campaigns across 14,518 campaigns measured through full year 2025. These formats matter because they compress discovery, engagement, and response into the same viewing session instead of forcing a separate path back to retail. At the same time, format standardization lowers entry barriers for competing platforms, which means the retail media in OTT market may expand faster even as first-mover advantages become less durable. That dynamic makes innovation important, but it also means scale will depend increasingly on data quality, execution ease, and measurement strength rather than format novelty alone.
AI-Powered Audience Segmentation And Creative Optimization
AI is reshaping both audience planning and ad delivery in the retail media in OTT market because it allows networks to personalize creative and audience selection at a much larger operational scale. Amazon Ads launched Dynamic TV Creative on May 11, 2026, giving Prime Video advertisers a way to personalize Interactive Video Ads based on viewer shopping behavior. Amazon said the product can adjust product imagery, call-to-action language, and headline copy in real time across awareness and consideration stages. Cognitiv also launched AudienceGPT in March 2026, positioning it as a deep learning tool for building dynamic predictive audiences across audio, CTV, social, and programmatic media. This makes rich transaction history more valuable than static demographic grouping because better data architecture produces better personalization and better audience matching. As a result, the retail media in OTT market is shifting competitive advantage toward networks that can combine purchase signals, automation, and creative variation in one workflow.
Restraints Impact Analysis of Retail Media In OTT Market*
| Restraint | (~) % Impact on CAGR Forecast | Geographic Relevance | Impact Timeline |
|---|---|---|---|
| Fragmented Measurement Standards Across OTT and Retail Media Networks | -1.8% | Global, most acute in North America | Short term (≤ 2 years) |
| Difficulties in Integrating Retail, Ad Tech, and Streaming Data Systems | -1.4% | Global | Medium term (2-4 years) |
| Limited Scale of Smaller Retailer-Owned Networks | -0.9% | North America and EU | Short term (≤ 2 years) |
| Privacy and Consent Complexity in First-Party Data Activation | -0.8% | EU, Asia-Pacific, South America | Medium term (2-4 years) |
| Source: Mordor Intelligence | |||
Fragmented Measurement Standards Across OTT And Retail Media Networks
Measurement inconsistency remains one of the clearest barriers to broader advertiser adoption in the retail media in OTT market. Premion and Advertiser Perceptions found that 1 in 3 CTV and OTT advertisers identified inconsistent measurement standards as their primary concern in their 2026 survey. IAB Europe released updated Commerce Media Measurement Standards V2 after a 2025 public comment process and kept a 30-day lookback window as the default while allowing flexibility for different use cases. The problem is that network adoption is still uneven, and the framework is not yet enforced as a universal contractual rule across the ecosystem. That leaves advertisers comparing results that may be built from different attribution windows, definitions, and reporting assumptions. In the retail media in OTT market, larger networks can benefit from that opacity because they are better able to defend proprietary return claims when outside validation is still inconsistent.
Difficulties In Integrating Retail, Ad Tech, And Streaming Data Systems
Technical integration remains a structural barrier for the retail media in OTT market, especially when advertisers want to run one campaign across multiple retailer networks and streaming environments. The IAB said 72% of publishers cited technical complexity as a barrier to connected TV Conversion API adoption, even though that architecture is central to connecting ad exposure with purchase outcomes. Server-to-server integration matters because it allows identity, event, and outcome data to move without relying on fragile browser-based systems. Many advertisers still have to manage retailer inventory one network at a time, and that duplication makes planning and attribution heavier than it needs to be. Clean room style data matching can help solve part of that problem, but it requires engineering capacity and coordination that many smaller networks and mid-sized brands still do not have. The result is a wider gap between large platforms with end-to-end infrastructure and smaller participants in the retail media in the OTT market that cannot yet offer the same measurement accuracy or operating simplicity.
*Our forecasts treat driver/restraint impacts as directional, not additive. The impact forecasts reflect baseline growth, mix effects, and variable interactions.
Retail Media In OTT Market Segment Analysis
By Advertising Format:
Video Ads Anchor Both Scale And GrowthVideo ads captured 55.26% of advertising format revenue in 2025, and they are also projected to grow at a 12.82% CAGR through 2031. This lead reflects the fact that video can combine retailer transaction data with premium sight, sound, and motion inventory in the same environment. In October 2025, the IAB Tech Lab released the CTV Ad Portfolio and standardized 6 new formats, including pause ads, menu ads, screensaver ads, in-scene ads, squeezebacks, and overlays, which made programmatic execution easier for ad types that had often required direct publisher deals. That change supports broader adoption across the retail media in OTT market because it reduces friction for both buyers and sellers. It also makes video the format where commerce, creative, and measurement are most likely to come together in one transaction path.
Video ads also represented the largest share of the retail media in OTT market size in 2025, which means the format benefits from both scale and the strongest experimentation budgets. Amazon Ads said Interactive Video Ads delivered 6x higher brand search, 4x more product detail page views, and 5x higher purchase rates than standard streaming TV campaigns across 14,518 campaigns measured through full year 2025. Display ads still retain a meaningful place in smart TV home screens and banner overlay placements, while interactive ads remain smaller by current share but are gaining support as standardization improves execution. The format mix suggests that the retail media in OTT industry is moving beyond simple exposure selling and toward viewing experiences that are designed to trigger measurable shopping action.



By Platform Type:
Retailer-Owned Networks Lead While Third-Party Scale BuildsRetailer-owned networks accounted for 58.91% of platform-type revenue in 2025, which confirms that direct shopper data ownership still gives retailers the strongest starting point. Their lead comes from the ability to combine transaction history, audience creation, campaign activation, and reporting in closely linked systems. That structure makes retailer-owned models especially attractive when brands want deterministic measurement and direct access to purchase-based targeting. The retail media in OTT market, therefore, still favors networks that can prove clear control over identity and outcomes rather than media supply alone. This also helps larger retailers defend pricing and advertiser attention even when streaming inventory becomes more widely available.
Third-party networks are projected to grow at a 12.93% CAGR through 2031, making them the fastest-growing platform type in the retail media in OTT market. Roku launched Roku Curate in April 2026, packaging Roku platform data with purchase and browsing signals from Best Buy Ads, Kroger Precision Marketing, Instacart, Fandango, Criteo, and Fetch into ready-to-activate CTV buys with closed-loop measurement. That move shows how streaming platforms are becoming distribution hubs for retailer data outside pure walled-garden environments. The segment tension is clear because retailer-owned networks lead in direct data control, while third-party models are scaling faster when brands need broader reach and easier programmatic access.
By Device Type:
Smart TVs Hold The Base While Mobile Completes The JourneySmart TVs held 42.56% of device type revenue in 2025, making them the largest device category in the retail media in OTT market. Big-screen viewing remains central because ad-supported streaming and premium video consumption are strongest in the living room. Smart TV environments also support immersive creative formats that are better suited to branded storytelling and shoppable overlays than smaller screens. This gives Smart TVs a stable revenue base even as device behavior becomes more distributed. Gaming consoles and laptops or desktops remain smaller segments, but they still matter where streaming activity overlaps with longer entertainment sessions and adjacent digital commerce behavior.
Smartphones and tablets are projected to expand at a 13.11% CAGR through 2031, which makes them the fastest-growing device category in the retail media in OTT market. Their role is less about replacing television and more about closing the loop after exposure, because shoppers can scan QR codes or act on send-to-phone prompts after seeing a streaming ad. That second-screen behavior supports shoppable CTV by moving users from awareness to action with less friction. The device split shows that scale remains anchored in the living room, while conversion increasingly moves through handheld screens.
By End-User:
CPG Anchors Spend While Beauty Reallocates GrowthConsumer packaged goods represented 32.22% of end-user revenue in 2025, which made it the largest end-user group and a major anchor of the retail media in OTT market. The category has historically concentrated retail media investment because brands rely heavily on retailer shelf data, repeat purchase behavior, and promotion cycles. CPG also helps explain why closed-loop reporting is so important, because advertisers in this group want evidence that exposure affects repeat purchase and basket behavior. The retail media in OTT market continues to depend on CPG for spending stability, even when advertiser budget growth becomes less even across categories. That position keeps CPG central to how networks design audience products, reporting logic, and off-site activation.
Beauty and personal care is projected to grow at a 13.32% CAGR through 2031, making it the fastest-growing end-user segment in the retail media in OTT market. Amazon Ads said L'Oréal Paris became the global sponsor of Prime Video’s Elle series in 2025, combining branded content alignment, interactive video formats, and Amazon retail integration within a single campaign approach. That structure fits beauty well because inspiration, product storytelling, and purchase intent can all develop in the same streaming session. Electronics, apparel, and grocery remain meaningful mid-tier demand pools, while grocery and food delivery continue to gain relevance as retailer data partnerships expand across media and commerce environments.
Geography Analysis
North America Retail Media in OTT Market
North America held 51.24% of the retail media in OTT market share in 2025, which made it the largest regional contributor. That lead reflects the unmatched scale of retailer first-party data, mature ad-supported streaming infrastructure, and advertiser familiarity with closed-loop activation. Premion and Advertiser Perceptions found that 7 in 10 U.S. advertisers planned to increase their CTV or OTT spending by an average of 17% in 2026. This spending intent supports continued leadership for the retail media in OTT market because brands in the region are already comfortable buying measurable premium video against retailer data. The region also remains a proving ground for rollout strategy, and Amazon Ads confirmed plans to introduce Prime Video advertising in Belgium, Denmark, Norway, and Turkey in 2026 after building scale across its established streaming advertising base.
APAC Retail Media in OTT Market
Asia-Pacific is projected to grow at a 13.42% CAGR through 2031, making it the fastest-growing geography in the retail media in OTT market. Growth is being supported by mobile-first streaming behavior, expanding ad-supported OTT consumption, and the formalization of retail media models across key regional economies. The Asia Video Industry Association said in its 2026 report that OTT was positioned to overtake traditional pay TV as the largest source of content investment in the region for the first time. That inventory expansion matters because the retail media in OTT market needs scalable premium video supply before retailer data can be activated consistently across streaming environments.
EMEA and South America Retail Media in OTT Market
Europe remained a significant growth geography in the retail media in OTT market in 2025, while South America, the Middle East, and Africa stayed earlier-stage but increasingly relevant. IAB Europe updated its Commerce Media Measurement Standards V2 in 2025, giving the region a stronger framework for attribution, lookback windows, and reporting discipline across commerce media activity. That standards push supports broader expansion because advertisers need more consistency when off-site retail media extends into connected television and video inventory. South America, the Middle East, and Africa are still building the conditions for faster adoption through mobile streaming growth, wider e-commerce participation, and rising interest in measurable media tied to transaction data.

Competitive Landscape
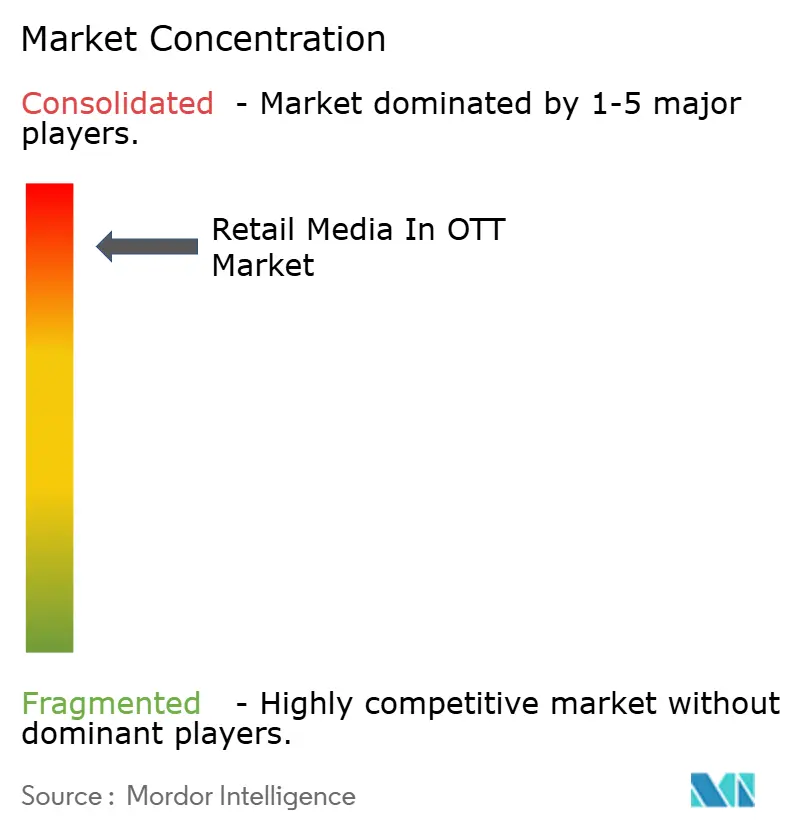
The retail media in OTT market operates through 2 competitive layers, retailer-owned networks that compete on shopper data depth and streaming and ad-tech platforms that compete on inventory value and activation precision. Concentration is high at the top, but fragmentation remains pronounced below the leaders because many networks are still trying to prove differentiated audience access and measurement quality. Leading companies are increasingly trying to control the data layer, activation layer, and measurement layer together because that structure provides better pricing power and stronger attribution credibility. Amazon Ads launched Dynamic TV Creative for Prime Video in May 2026, which extended its role from selling inventory to automating creative personalization based on shopping behavior. That kind of vertical integration raises the execution bar for smaller participants in the retail media in OTT market that cannot match both scale and closed-loop capability.
The Trade Desk reported USD 2.9 billion in revenue for 2025 and said Unified ID 2.0 had been adopted by more than 950 publishers globally as of Q1 2026. This positions the company as a standards-layer participant in the retail media in OTT market rather than only a campaign buying interface. Roku also moved deeper into commerce media with the April 2026 launch of Roku Curate, which packages Roku platform engagement data with retailer and commerce signals into simpler CTV buying workflows. These moves show that second-tier platforms are trying to build practical alternatives to the most closed retailer ecosystems by widening usable data access and reducing activation complexity.
Criteo and WPP Media launched a commerce-signal activation in July 2025 that combined Open Intelligence with Criteo’s real-time signals from 17,000 e-commerce sites and 200 global retail partners across premium CTV inventory. THG Beauty Media partnered with The Trade Desk in February 2026 to let brand advertisers activate data-driven retail media campaigns across the open internet, including CTV, with supply-side integration through FreeWheel, Index Exchange, Magnite, Microsoft Monetize, and PubMatic. The clearest white-space opportunity remains mid-funnel video attribution for retailers that do not have Amazon or Walmart scale, because advertisers still want proof that streaming exposure drives both online and in-store purchase outcomes. As a result, the retail media in OTT market is likely to keep consolidating around companies that can combine authenticated identity, usable inventory, and outcome measurement within one operating model.
Retail Media In OTT Industry Leaders
Amazon, Inc.
Walmart Connect
Target Corporation
Roku, Inc.
Instacart
- *Disclaimer: Major Players sorted in no particular order
Retail Media In OTT Market Companies Covered in this Report
- Amazon, Inc.
- Walmart Connect
- The Home Depot
- Target Corporation
- Instacart
- Roku, Inc.
- The Trade Desk, Inc.
- Disney Advertising Sales
- NBCUniversal Media, LLC
- Paramount Global
- Warner Bros. Discovery, Inc.
- Samsung Electronics Co., Ltd.
- LG Ad Solutions
- Tubi, Inc.
- Criteo S.A.
- eBay Inc.
- Magnite, Inc.
- PubMatic, Inc.
- Nexxen International Ltd.
- Microsoft Corporation

Recent Industry Developments in Retail Media In OTT Market
- May 2026: Amazon Ads launched Dynamic TV Creative on Prime Video on May 11, 2026, the platform's first capability to automatically personalize Interactive Video Ads based on viewer shopping behavior in real time. The product is live for select US advertisers across CPG, fashion, and electronics, with expansion to live sports and Prime Video Channels planned for Q3 2026.
- April 2026: Roku launched "Roku Curate," a pre-packaged CTV advertising product bundling Roku's platform engagement data with purchase behavior signals from Best Buy Ads, Kroger Precision Marketing, Instacart, Fandango, Criteo, and Fetch into ready-to-activate media buys with closed-loop measurement.
- March 2026: Cognitiv launched AudienceGPT, a deep learning-powered dynamic audience tool enabling real-time funnel-position prediction across CTV, audio, social, and programmatic channels, eliminating reliance on static segment definitions.
- February 2026: THG Beauty Media partnered with The Trade Desk to enable brand advertisers to activate data-driven retail media campaigns across the open internet, including CTV, with supply-side integration through FreeWheel, Index Exchange, Magnite, Microsoft Monetize, and PubMatic.


Global Retail Media In OTT Market Report Scope
Retail Media in OTT Market refers to advertising inventory sold by retailers within over-the-top and connected TV environments, using retailer-owned streaming apps or channels to reach viewers with commerce-focused messages. It combines retail media’s first‑party shopper data and point‑of‑purchase proximity with OTT’s video formats and lean‑back viewing context to target audiences more precisely.
The Retail Media in OTT Market Report is Segmented by Advertising Format (Video Ads, Display Ads, and Interactive Ads), Platform Type (Retailer-Owned Networks, and Third-Party Networks), Device Type (Smart TVs, Smartphones and Tablets, Gaming Consoles, and Laptops and Desktops), End-User (Consumer Packaged Goods, Electronics and Technology, Apparel and Fashion, Grocery and Food Delivery, and Beauty and Personal Care), and Geography (North America, South America, Europe, Asia Pacific, Middle East, and Africa). The Market Forecasts are Provided in Terms of Value (USD).
| Video Ads |
| Display Ads |
| Interactive Ads |
| Other Advertising Formats |
| Retailer-Owned Networks |
| Third-Party Networks |
| Other Platform Types |
| Smart TVs |
| Smartphones and Tablets |
| Gaming Consoles |
| Laptops and Desktops |
| Other Device Types |
| Consumer Packaged Goods |
| Electronics and Technology |
| Apparel and Fashion |
| Grocery and Food Delivery |
| Beauty and Personal Care |
| Other End-Users |
| North America | United States |
| Canada | |
| Mexico | |
| South America | Brazil |
| Argentina | |
| Chile | |
| Rest of South America | |
| Europe | Germany |
| United Kingdom | |
| France | |
| Italy | |
| Spain | |
| Rest of Europe | |
| Asia-Pacific | China |
| Japan | |
| India | |
| South Korea | |
| Australia | |
| Rest of Asia-Pacific | |
| Middle East | Saudi Arabia |
| United Arab Emirates | |
| Qatar | |
| Rest of Middle East | |
| Africa | South Africa |
| Egypt | |
| Nigeria | |
| Rest of Africa |
| By Advertising Format | Video Ads | |
| Display Ads | ||
| Interactive Ads | ||
| Other Advertising Formats | ||
| By Platform Type | Retailer-Owned Networks | |
| Third-Party Networks | ||
| Other Platform Types | ||
| By Device Type | Smart TVs | |
| Smartphones and Tablets | ||
| Gaming Consoles | ||
| Laptops and Desktops | ||
| Other Device Types | ||
| By End-User | Consumer Packaged Goods | |
| Electronics and Technology | ||
| Apparel and Fashion | ||
| Grocery and Food Delivery | ||
| Beauty and Personal Care | ||
| Other End-Users | ||
| By Geography | North America | United States |
| Canada | ||
| Mexico | ||
| South America | Brazil | |
| Argentina | ||
| Chile | ||
| Rest of South America | ||
| Europe | Germany | |
| United Kingdom | ||
| France | ||
| Italy | ||
| Spain | ||
| Rest of Europe | ||
| Asia-Pacific | China | |
| Japan | ||
| India | ||
| South Korea | ||
| Australia | ||
| Rest of Asia-Pacific | ||
| Middle East | Saudi Arabia | |
| United Arab Emirates | ||
| Qatar | ||
| Rest of Middle East | ||
| Africa | South Africa | |
| Egypt | ||
| Nigeria | ||
| Rest of Africa | ||


Key Questions Answered in the Report
What is the 2026 size of the retail media in OTT market?
The retail media in OTT market stands at USD 10.82 billion in 2026 and is projected to reach USD 19.61 billion by 2031 at a 12.63% CAGR.
Why are video ads leading this space?
Video ads held 55.26% of format revenue in 2025 and remain the leading format because they combine premium streaming inventory with retailer transaction data and shoppable features.
Which platform type is growing the fastest?
Third-party networks are projected to grow at a 12.93% CAGR through 2031 as brands look for retailer data access beyond fully closed retailer properties.
Why is Asia-Pacific growing faster than other regions?
Asia-Pacific is projected to grow at a 13.42% CAGR because of mobile-first streaming behavior, expanding ad-supported OTT use, and stronger regional content investment.
Which end-user group is driving the most revenue today?
Consumer packaged goods led with 32.22% share in 2025, which reflects the categorys long-standing dependence on retailer data and measurable purchase outcomes.
What is the biggest challenge for wider adoption?
Measurement fragmentation and system integration remain the biggest constraints because advertisers still face inconsistent standards and technically complex links between streaming exposure and purchase data.
Page last updated on:





