
REIT Market Size and Share
Market Overview
| Study Period | 2021 - 2032 |
|---|---|
| Market Size (2027) | USD 2.30 Trillion |
| Market Size (2032) | USD 2.9 Trillion |
| Growth Rate (2027 - 2032) | 4.60 % |
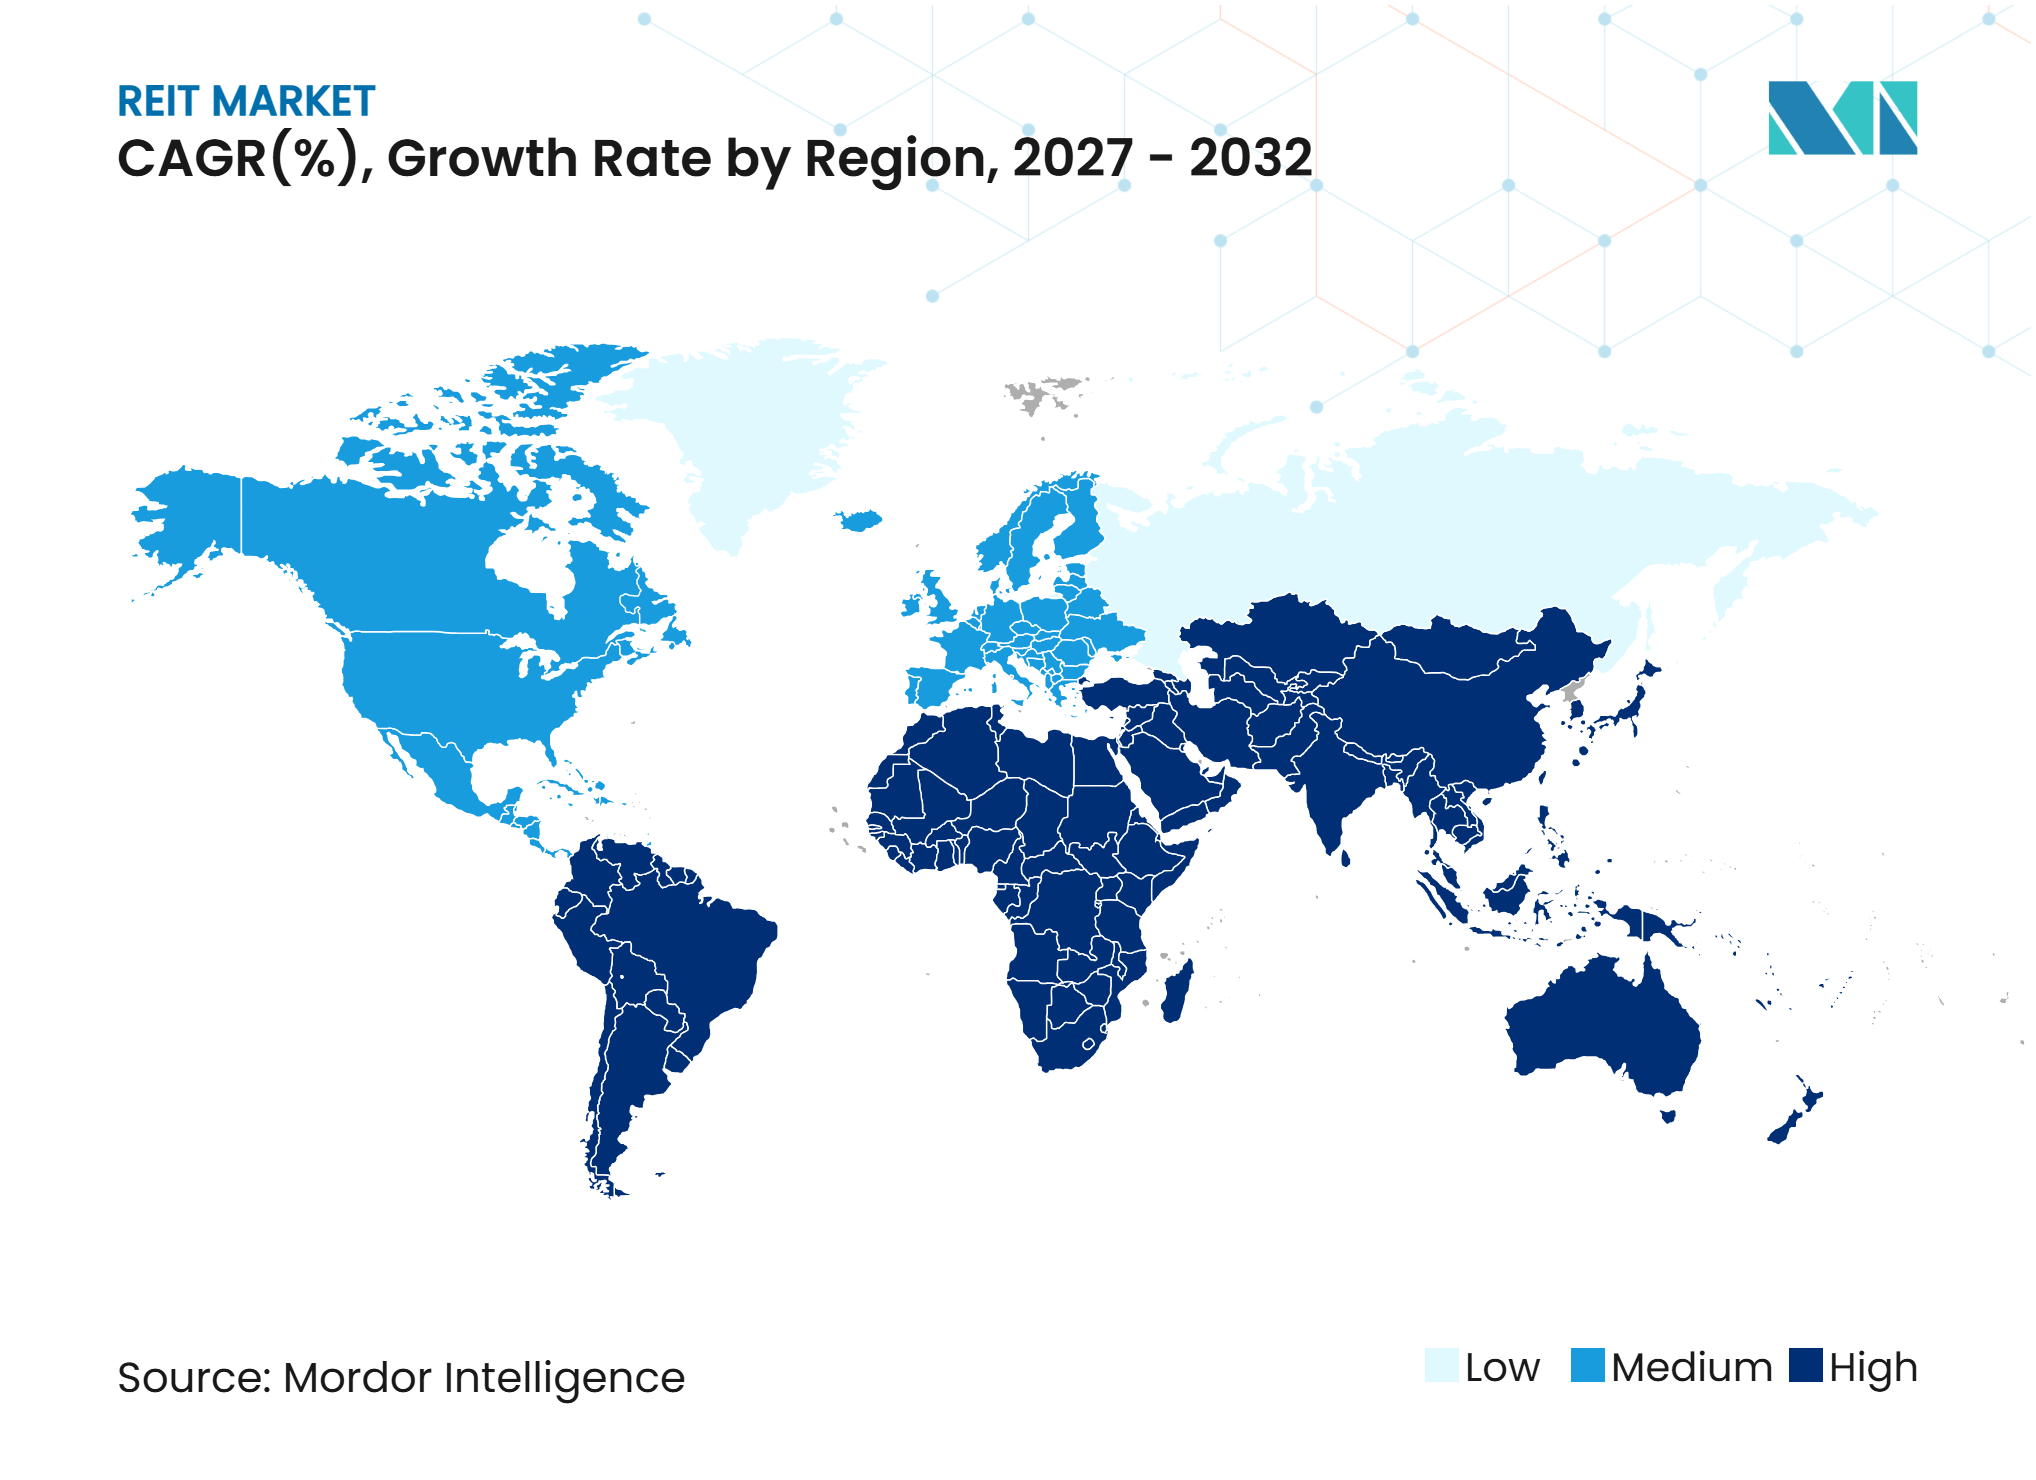
| Fastest Growing Market | Asia-Pacific |
| Largest Market | North America |
| Market Concentration | Low |
Major Players *Disclaimer: Major Players sorted in no particular order Image © Mordor Intelligence. Reuse requires attribution under CC BY 4.0. | |
REIT Market Analysis by Mordor Intelligence
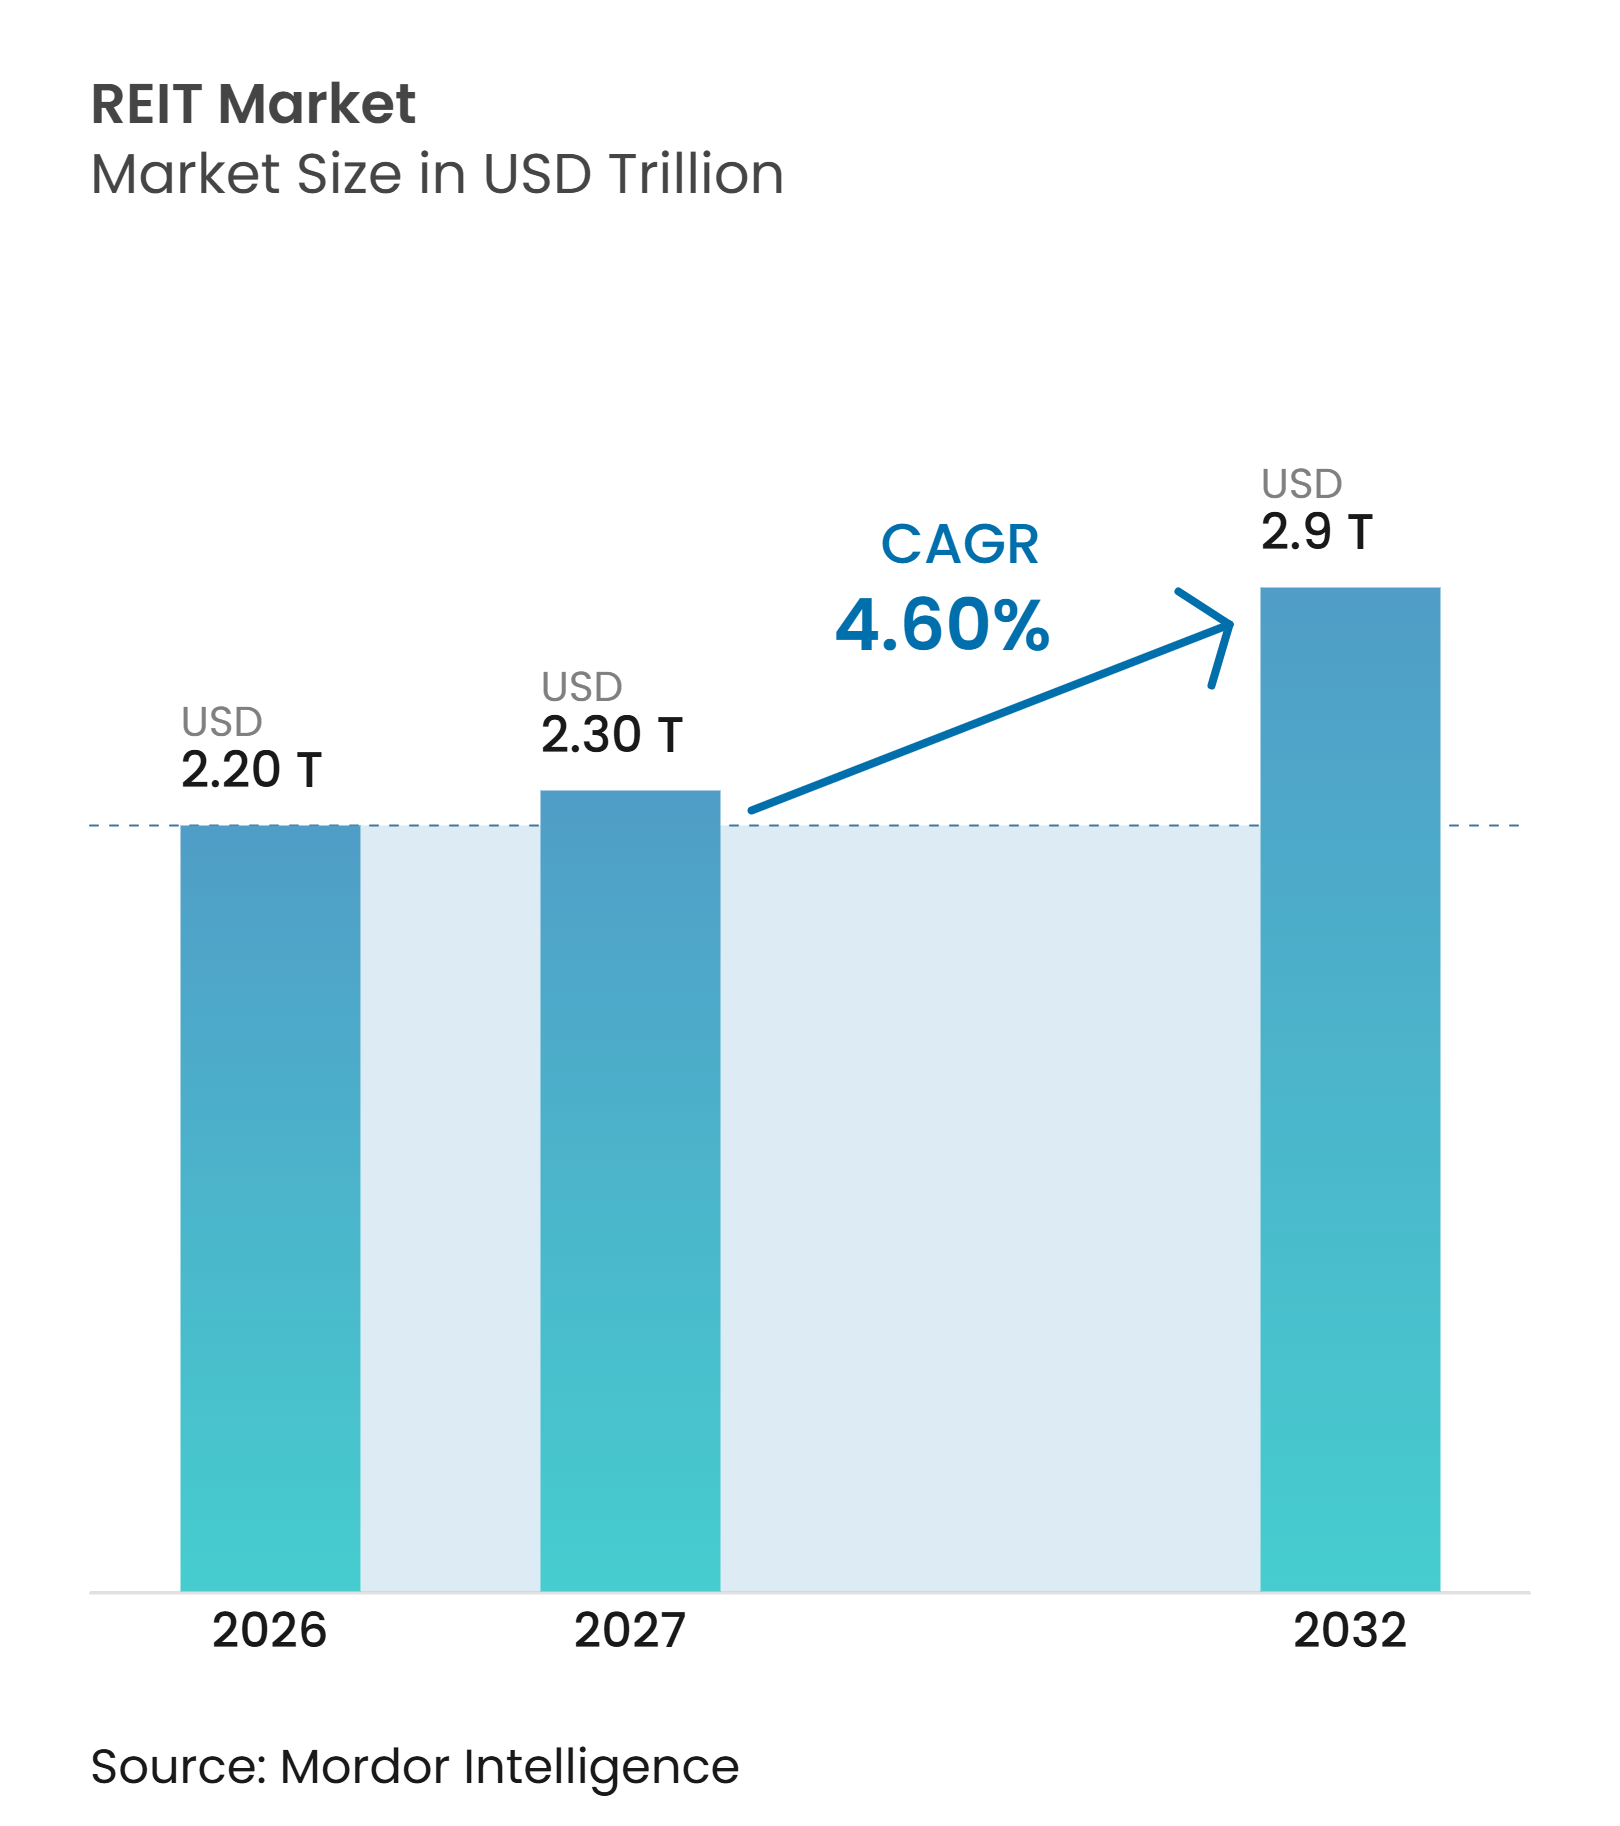
The REIT Market size was valued at USD 2.20 trillion in 2026 and is estimated to grow from USD 2.30 trillion in 2027 to reach USD 2.9 trillion by 2032, at a CAGR of 4.60% during the forecast period (2027-2032).
Institutional investors continue to use listed real estate for diversified property exposure, particularly where direct transactions offer limited access to large assets. Publicly listed vehicles also trade at a discount to private real estate values, which could support a recovery in performance if interest-rate volatility eases and property transactions improve. Operating conditions differ significantly by property type, with data centers and senior housing showing stronger demand than office properties. Consolidation is also changing the competitive setting as larger operators seek lower funding costs, wider development capabilities, and access to specialist assets. The REIT market therefore combines a mature public-market base with newer growth opportunities in private vehicles and emerging regulatory frameworks.
Key Report Takeaways
- By REIT structure, equity REITs captured 85.7% of the REIT market share in 2026, while mortgage REITs are projected to grow at a 6.5% CAGR through 2032.
- By property sector, healthcare REITs held 17.4% of the REIT market share in 2026, while data centers are projected to grow at an 11.8% CAGR through 2032.
- By listing and trading status, publicly traded REITs captured 83.8% of the REIT market size in 2026, while private REITs are projected to grow at a 7.5% CAGR through 2032.
- By market capitalization size, large-cap REITs accounted for 75.1% of the REIT market share in 2026, while small-cap REITs are projected to grow at a 6.5% CAGR through 2032.
- By geography, North America held 70.3% of the REIT market share in 2026, while Asia-Pacific is projected to grow at a 7.8% CAGR through 2032.
Note: Market numbers in this report are based on Mordor Intelligence's proprietary estimation framework, which combines nine months of actuals with Q4 projections for base year 2026.
Market Trends and Insights
Drivers Impact Analysis of REIT Market*
| Driver | (~) % Impact on CAGR Forecast | Geographic Relevance | Impact Timeline |
|---|---|---|---|
| Growing Investor Demand for Listed Real Estate and Portfolio Diversification | +1.2% | Global | Medium term (2-4 years) |
| Digitalization and Rising Demand for Data Center Properties | +0.9% | Global, led by North America | Short term (≤ 2 years) |
| Expansion of REIT Frameworks and Access to Institutional Capital | +0.8% | Asia-Pacific core, spillover to Middle East and Africa | Medium term (2-4 years) |
| Growth in Demand for Income-Producing Real Estate Assets | +0.7% | Global | Medium term (2-4 years) |
| Rental Escalation Clauses and Growth in Property Rental Income | +0.5% | Global | Long term (≥ 4 years) |
| Supply Constraints in High-Demand Real Estate Markets | +0.4% | North America and Europe | Long term (≥ 4 years) |
| Source: Mordor Intelligence | |||
Digitalization and Rising Demand for Data Center Properties
The shift from cloud storage to artificial intelligence inference workloads has changed the demand for data center property. Leasing commitments are now being made well before new capacity becomes available, especially in major metropolitan areas where power and permits remain limited. Equinix reported that artificial intelligence workloads accounted for 60% of its largest deals in the fourth quarter of 2025, while its full-year revenue reached USD 9.2 billion, 5% above the prior year. Its 2026 revenue guidance of USD 10.1 billion to USD 10.2 billion indicated 10% to 11% growth[1]. Iron Mountain reported 488 MW of existing capacity, approximately 97% leased data center capacity, and a total potential capacity of 1,340 MW in land and buildings currently owned or operated in its 2025 annual filing, and its data center revenue increased 30% during 2025[2]. The REIT market is increasingly shaped by the ability to secure these constrained sites.
Growing Investor Demand for Listed Real Estate and Portfolio Diversification
Demand for listed real estate is supported by investors who need liquid access to property sectors such as data centers and senior housing. REIT total returns exceeded broad United States equity benchmarks by 4.6 percentage points in the first half of 2026, partly reversing the 15.1-percentage-point shortfall recorded in 2025[3]. Large pension funds and sovereign wealth funds can use listed REITs when private transactions cannot provide sufficient scale or exposure to specialist property types. Equity issuance by United States REITs in early 2026 was nearly twice the full-year total for 2025, with funding directed toward acquisitions rather than refinancing. This use of equity capital can improve the capacity of established operators to act when property owners need liquidity. The REIT market also benefits when investors view listed vehicles as a practical way to rebalance real estate allocations without selling large physical assets.
Expansion of REIT Frameworks and Access to Institutional Capital
New and revised regulations in Asia-Pacific and the Middle East are widening the REIT market universe of listed real estate vehicles. India’s Securities and Exchange Board of India reclassified REITs as equity instruments from January 1, 2026, allowing domestic equity mutual funds and passive strategies to increase their exposure. The regulator also issued a comprehensive master circular in July 2025 and introduced small and medium REIT provisions in April 2025. Singapore’s SGD 5 billion (USD 3.7 billion) equity market development programme identifies listed REITs as a beneficiary, while two Singapore REIT initial public offerings raised a combined USD 1.3 billion in 2025. Saudi Arabia also amended its real estate investment fund regulations in 2025, and the United Arab Emirates clarified tax exemption conditions for qualifying REITs. These measures improve the route to institutional capital for vehicles that offer property exposure without direct ownership.
Growth in Demand for Income-Producing Real Estate Assets, Rental Income, and Supply Constraints
Senior housing demonstrates how demand within the REIT market can outpace available supply. Welltower reported 20.5% same-store net operating income growth in its senior housing operating portfolio in the second quarter of 2026, following 20.4% growth in the fourth quarter of 2025[4]. Rental escalation clauses can help owners protect income when tenants remain in place and operating costs increase. Similar supply constraints support pricing in data centers, prime logistics, and selected healthcare assets. This makes asset selection important because properties with weak demand or excess supply can experience very different rental outcomes.
Restraints Impact Analysis of REIT Market*
| Restraint | (~) % Impact on CAGR Forecast | Geographic Relevance | Impact Timeline |
|---|---|---|---|
| Higher Interest Rates and Debt Refinancing Costs | -0.8% | North America and Europe | Short term (≤ 2 years) |
| Property Valuation Volatility and Rising Capitalization Rates | -0.5% | Global | Medium term (2-4 years) |
| Mandatory Distribution Requirements and Limited Internal Capital Retention | -0.3% | Global | Long term (≥ 4 years) |
| Rising Property Operating and Maintenance Costs | -0.3% | Asia-Pacific and North America | Medium term (2-4 years) |
| Source: Mordor Intelligence | |||
Higher Interest Rates and Debt Refinancing Costs
Higher borrowing costs remain a material constraint for owners who must refinance debt issued during lower-rate periods. As of October 2026, the weighted average coupon on REIT debt reached 5.4% in the third quarter of 2026, compared with 4.7% in the first quarter. The resulting increase in interest expense can reduce the return available from acquisitions and delay transactions that no longer meet required yields. Large listed REITs generally have broader access to unsecured debt and equity capital than smaller operators. Smaller operators with secured or multi-layered debt structures have less flexibility when loans mature. Mandatory distribution rules can further limit the cash available for internal reinvestment, increasing the need for external funding across the REIT market.
Property Valuation Volatility, Rising Capitalization Rates, and Operating Costs
Changes in capitalization rates can place pressure on asset values and on the spread between property yields and funding costs. This is most difficult for portfolios that combine assets with soft rents and higher operating expenses. Secondary office buildings and regional malls are more exposed because they face weaker demand and potentially higher capital requirements. By contrast, properties with limited new supply and strong occupier demand may protect income more effectively. Rising maintenance, insurance, energy, and staffing costs can still reduce margins, especially where rent increases lag expenses. The REIT market remains sensitive to these differences because diversified portfolios can contain both resilient and stressed property categories.
*Our forecasts treat driver/restraint impacts as directional, not additive. The impact forecasts reflect baseline growth, mix effects, and variable interactions.
REIT Market Segment Analysis
By REIT Structure:
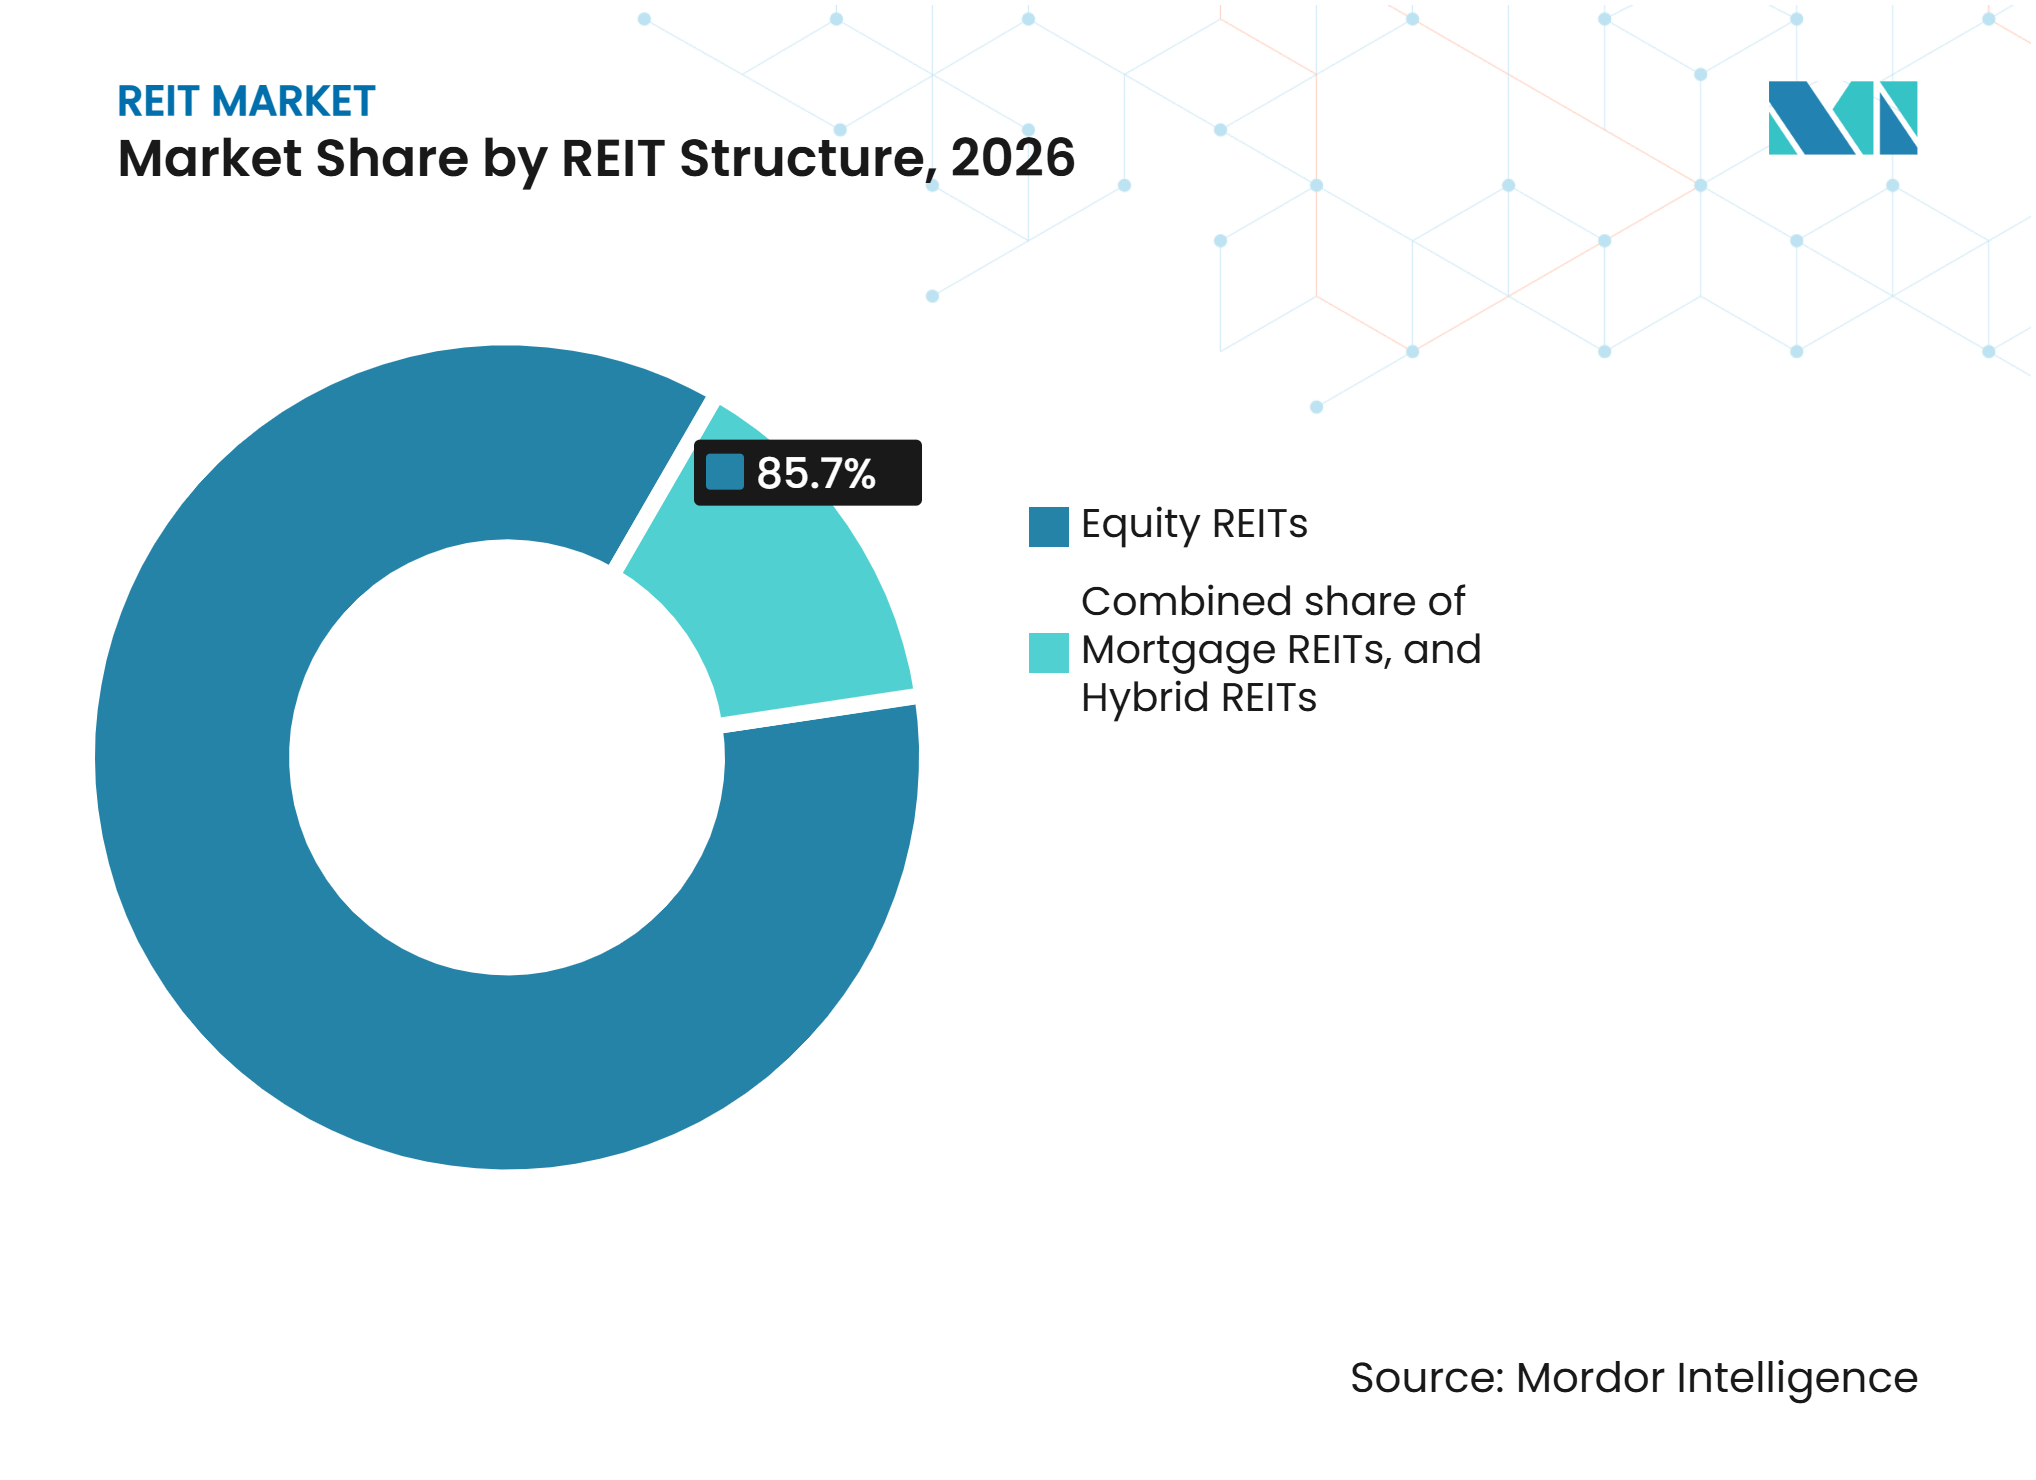
Equity REITs Retain Scale While Mortgage REITs RecoverEquity REITs held an 85.7% share of the REIT market in 2026, reflecting the long-standing role of direct property ownership in listed real estate. These entities own income-producing assets across categories that include data centers, timberland, apartments, health care facilities, logistics properties, and retail centers. Their established regulatory status and investor base support access to public equity and debt funding. Hybrid REITs occupy a smaller position and combine property income with mortgage activities. This structure may appeal where operators seek greater flexibility across assets and lending activities.
Mortgage REITs are projected to grow at a 6.5% CAGR through 2032 as lower funding costs support net interest margins. Federal Reserve rate reductions totaling 75 basis points in the second half of 2025 improved the interest-rate environment for mortgage REITs. The FTSE Nareit Mortgage REITs Index delivered a 16.02% total return in 2025 and recorded a 12.24% dividend yield at year-end, compared with 4.07% for equity REITs. The Mortgage Bankers Association forecast total United States single-family mortgage originations of USD 2.2 trillion in 2026, including approximately USD 737 billion in refinancing originations, creating potential opportunities for mortgage lenders and specialized REITs. Automation across loan origination and servicing can further support operational efficiency by streamlining processing and reducing manual workloads.


By Property Sector:
Health Care Provides Scale While Data Centers Lead GrowthHealth care REITs held a 17.4% share of the REIT market size by property sector in 2026. Their position reflects demand for care facilities and senior housing as populations age. Constrained new supply can support operating conditions for well-located senior housing portfolios. Retail also shows resilience in prime locations, while residential and industrial properties remain important income categories. Property type matters because rental growth, construction activity, and tenant demand differ widely across the portfolio.
Data centers are projected to grow at an 11.8% CAGR through 2032, the fastest rate among property sectors in the REIT market. Artificial intelligence workloads are driving demand before new facilities are delivered. Equinix and Digital Realty have a combined 8-GW development pipeline in major metropolitan locations, where power access and permitting create entry barriers. Office properties remain under pressure from hybrid work, particularly in secondary locations. Gaming, telecommunications infrastructure, self-storage, timberland, lodging, and specialty assets serve more defined demand pools. VICI Properties acquired 7 Golden Entertainment casino properties for USD 1.16 billion under a sale-leaseback structure with a 7.5% initial capitalization rate and 2% annual rent escalation.
By Listing and Trading Status:
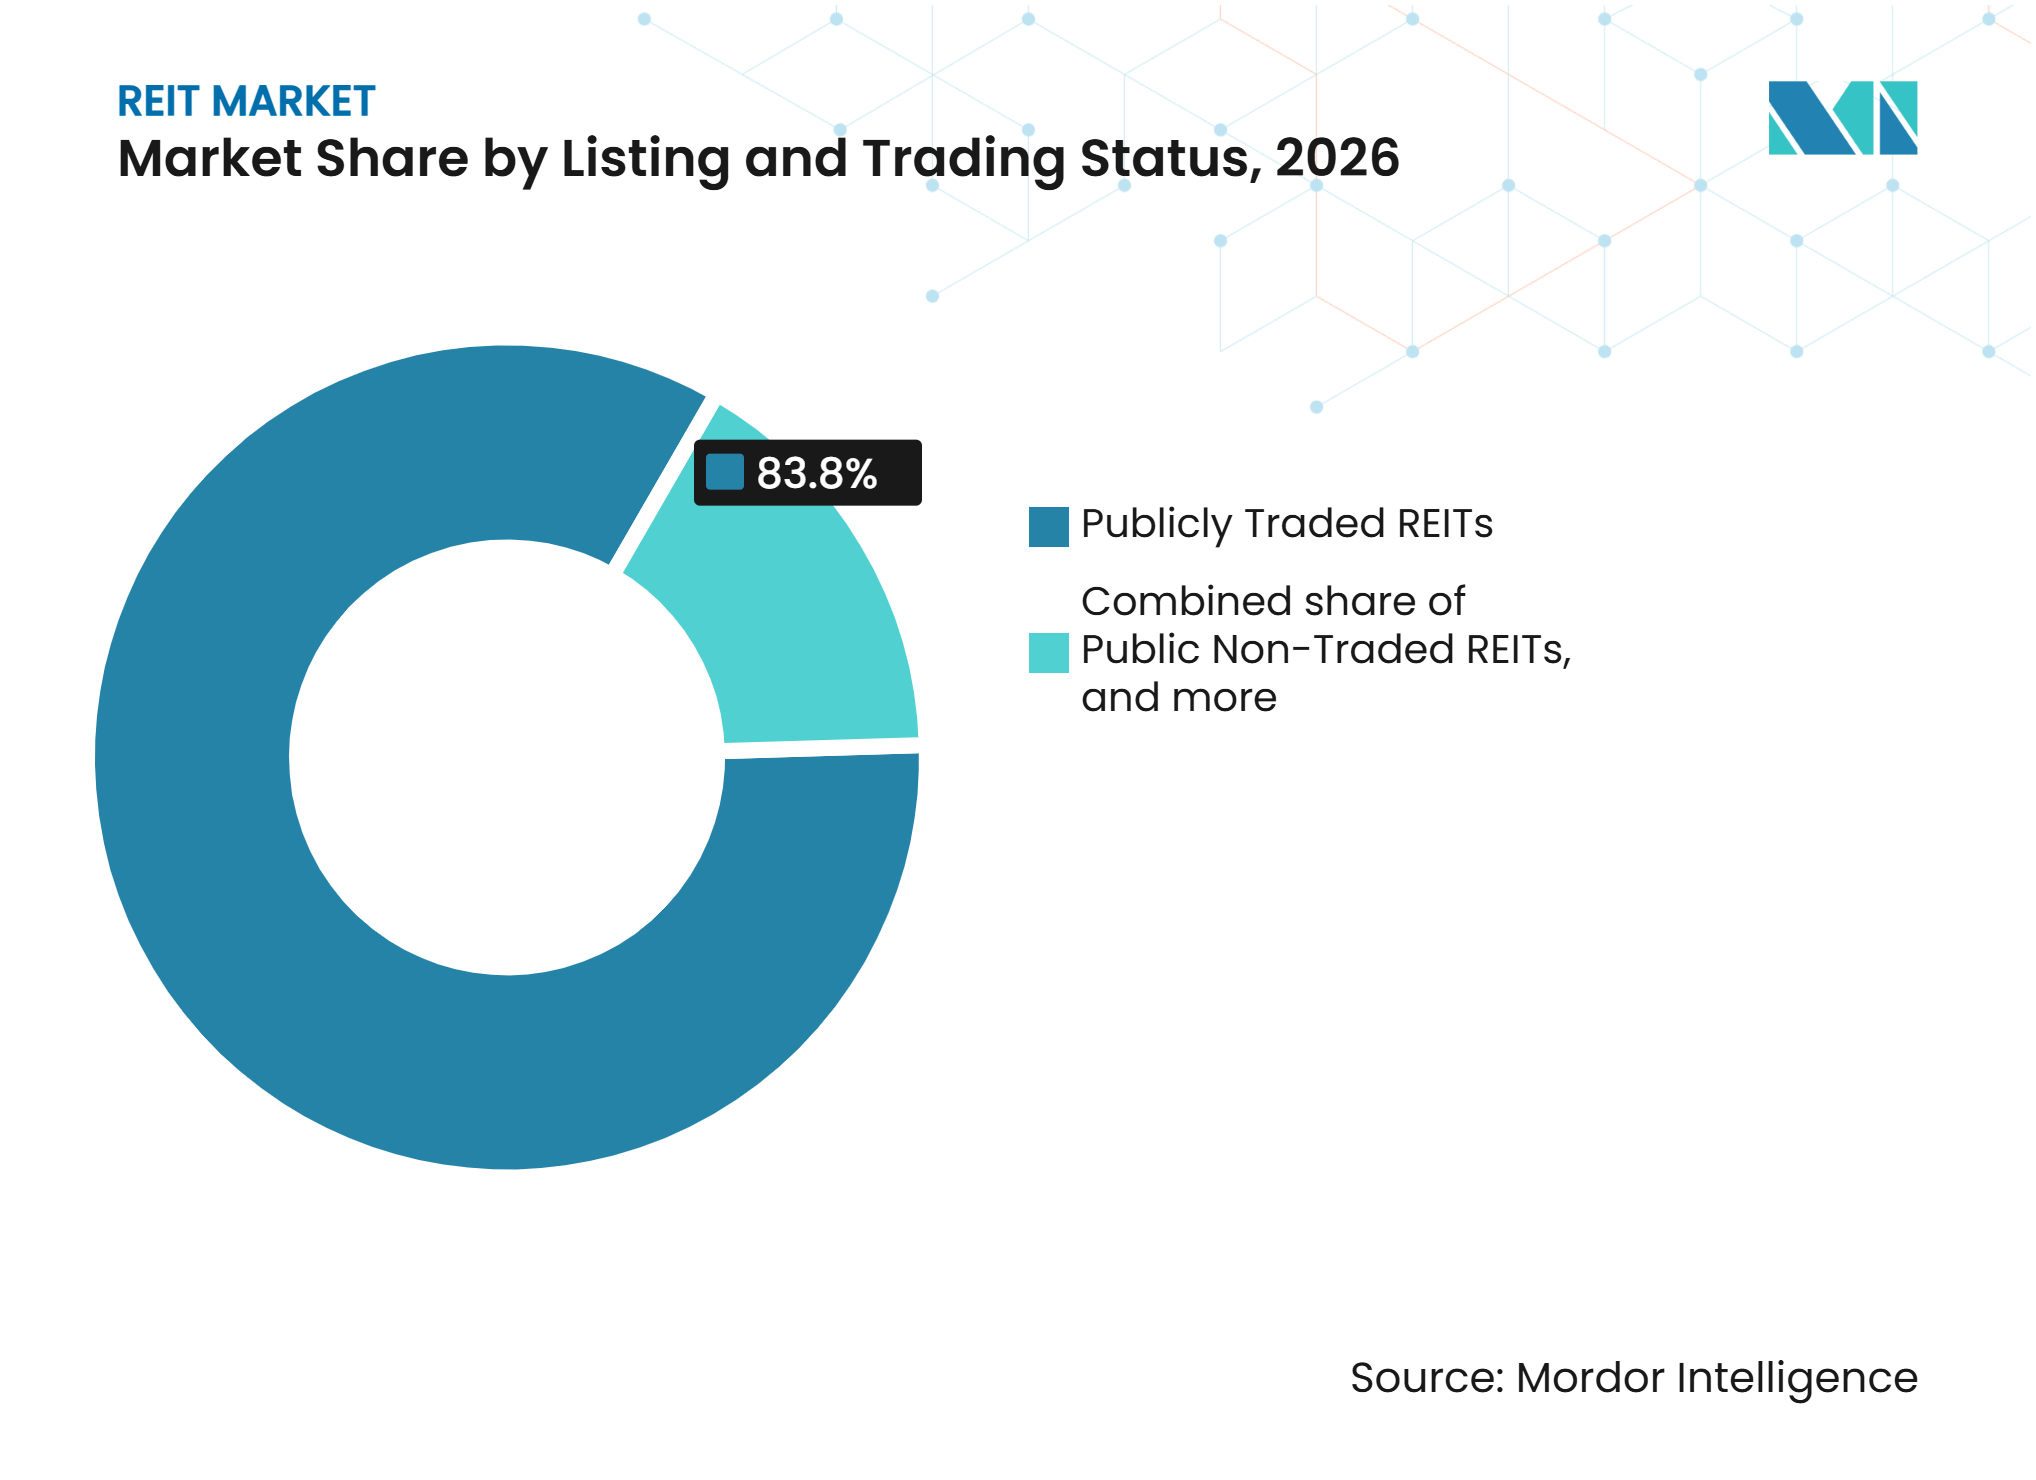
Publicly Traded REITs Lead While Private Vehicles ExpandPublicly traded REITs captured 83.8% of the REIT market size in 2026, providing daily liquidity, market pricing, and regular disclosure. These features suit institutional mandates that need transparent valuations and clear governance. Public non-traded REITs offer an alternative for investors seeking real estate exposure without a listed share price. The three-format structure gives investors choices across liquidity, disclosure, and return preferences. Listing requirements in the United States, United Kingdom, Singapore, and Australia support governance expectations for public vehicles.
Private REITs are projected to grow at a 7.5% CAGR through 2032. These vehicles can appeal to investors who prefer net-asset-value-based returns rather than daily public-market pricing. They may also provide property exposure through newer portfolios with assets valued closer to current conditions. This can limit the effect of legacy asset valuations on reported returns. Their expansion gives the REIT market a broader base of institutional and private capital.

By Market Capitalization Size:
Large-Cap Funding Advantages Contrast With Small-Cap FormationLarge-cap REITs accounted for a 75.1% share of REIT market capitalization in 2026, supported by more extensive access to bonds, preferred equity, and private capital vehicles. This scale can lower funding costs and support large development programs or cross-border acquisitions. In 2026, AvalonBay Communities and Equity Residential announced an all-stock merger that would create Vivmark, the largest REIT merger in United States history. In October 2026, Prologis confirmed SEGRO shareholder approval of the USD 18.8 billion merger. Larger platforms can use their scale to build specialized capabilities that smaller competitors may find difficult to match.
Small-cap REITs are projected to grow at a 6.5% CAGR through 2032 as new programs form in India, Singapore, and the Middle East. India’s REIT value grew 62% between the end of 2024 and March 2026, and the country became Asia’s fourth-largest REIT market by market capitalization. Singapore’s iEdge S-REIT Index includes 40 listed vehicles, with 70% in the small-cap category below SGD 3 billion (USD 2.2 billion). The SGD 5 billion (USD 3.7 billion) Equity Market Development Programme can support further capital formation. Mid-cap operators face a more difficult position because they may lack the scale of large firms while carrying more complex structures than smaller vehicles.
Geography Analysis
North America held 70.3% of the REIT market share in 2026, supported by the United States legislative framework, developed equity markets, and established investor participation. The region’s listed real estate system has operated for decades and offers more depth and liquidity than other regions. Aggregate REIT funds from operations and net operating income reached record levels in the second quarter of 2026. The FTSE Nareit All Equity REITs Index returned 14.9% through mid-year 2026, exceeding the Russell 1000 Index by 4.6 percentage points. Canada has mature REIT structures, while Mexico’s Fibras can benefit as nearshoring supports industrial activity along the United States-Mexico corridor.
Europe has established listed property frameworks in the United Kingdom, France, Germany, Italy, and Spain. Prologis and SEGRO plan to combine their operations after SEGRO shareholder approval, creating a 363-million-square-foot European industrial portfolio when the deal is expected to close in the first half of 2027. South America has a less mature REIT structure, though Brazil’s Fundos de Investimento Imobiliário provide the region’s most developed format. Argentina’s macroeconomic conditions limit institutional REIT formation, while other South American countries remain at earlier stages of framework development.
Asia-Pacific is projected to grow at a 7.8% CAGR through 2032, making it the fastest-growing region in the REIT market. India, Singapore, and China are extending regulatory access and deepening local capital markets. Australia and Japan are important destinations for cross-border property capital, followed by Singapore, South Korea, and India. CapitaLand Ascendas REIT announced USD 1.4 billion in acquisitions in March 2026 across Singapore logistics assets and a Japanese hyperscale data center, alongside a USD 900 million equity raise. The Middle East and Africa are also developing their frameworks, with the United Arab Emirates requiring authorized REITs in the Dubai International Financial Centre to distribute 80% of income and maintain independent board governance, while South Africa retains the most mature sub-Saharan listed property system.
Competitive Landscape
Market Concentration
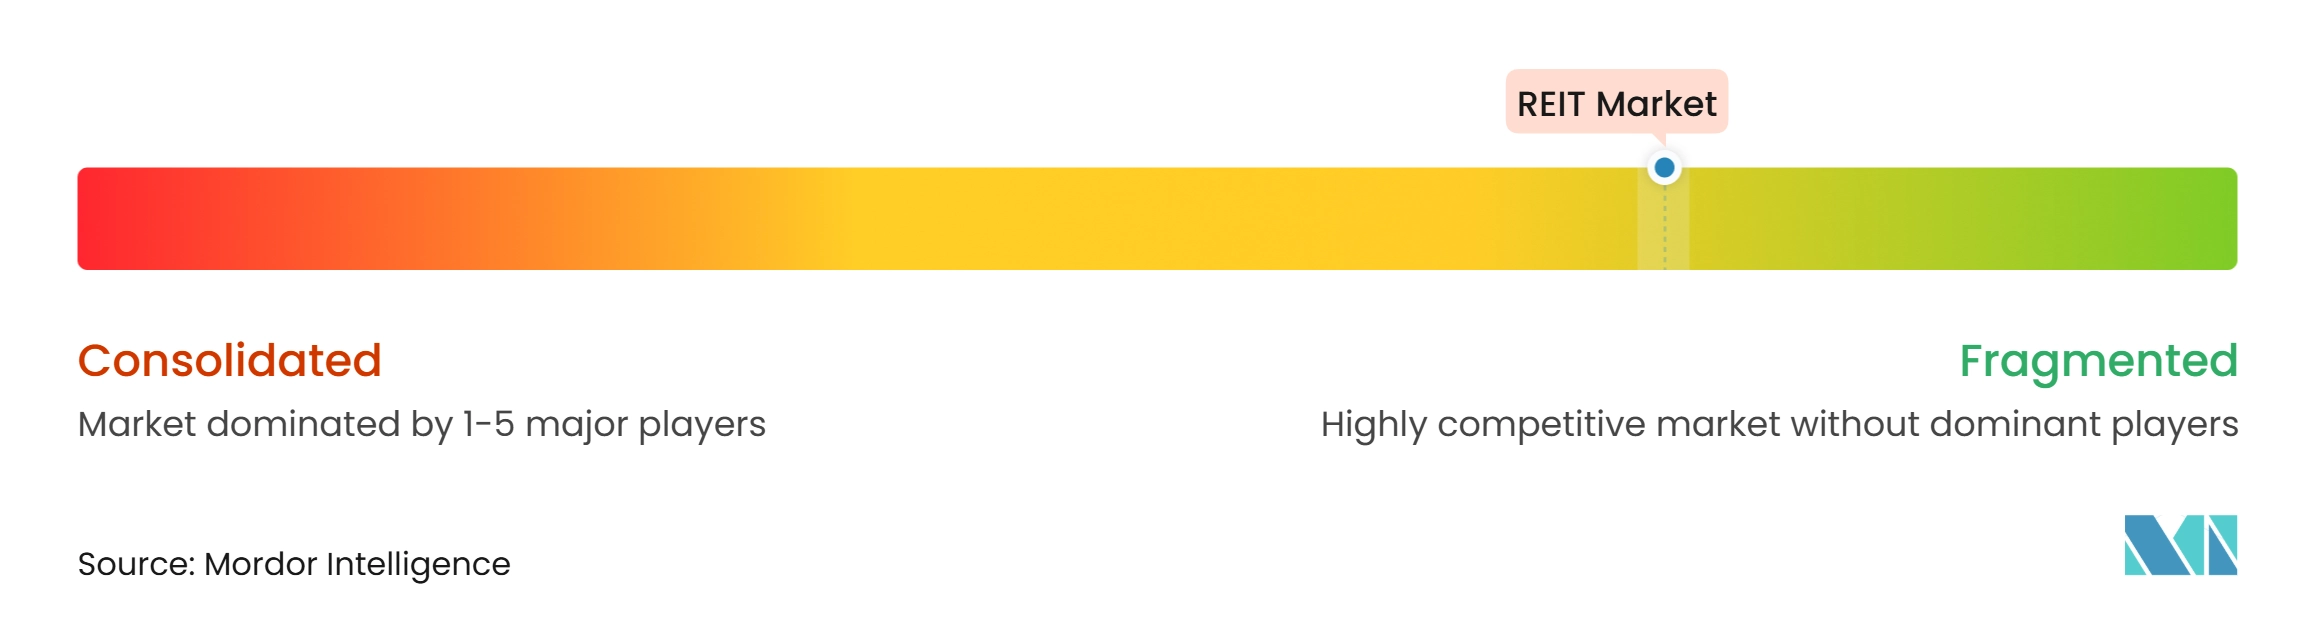
The REIT market is fragmented, with competition spread across multiple property sectors, geographic markets, and specialized operators, despite the presence of large companies with significant capital and development capabilities. Large REITs benefit from access to funding, acquisition opportunities, and technology investments, while smaller operators compete through local expertise and focused portfolios. Nareit reported 14 announced listed REIT acquisitions worth USD 100.9 billion in 2026, comprising six public-to-public transactions worth USD 75.6 billion and eight privatizations worth USD 25.3 billion. Competition varies by property type, with data centers facing higher entry barriers because developers need suitable land, power availability, permits, and relationships with major customers.
Iron Mountain illustrates how specialized REITs can differentiate themselves through compliance, security, and operational reliability. Its data center portfolio supports major hyperscalers and maintains certifications and assurance reports covering ISO 27001, ISO 22301, ISO 9001, SOC 2, and PCI-DSS. Welltower, meanwhile, applies proprietary data systems to occupancy management, care staffing, and revenue optimization across its senior housing portfolio, reporting 87.3% occupancy in the first quarter of 2026. Goodman Group also demonstrates the scale achievable in specialized infrastructure, with its global power bank reaching 6.4 GW and its development work-in-progress pipeline reaching AUD 19.7 billion as of June 2026, of which 78% was attributable to data centers. These examples highlight the advantages of specialist expertise without indicating that the wider REIT market is dominated by a small number of operators.
Growth opportunities remain in power-constrained data center markets, senior housing in secondary cities, and developing REIT markets across Southeast Asia, the Middle East, and Sub-Saharan Africa. Smaller and regional operators can compete through local market knowledge, targeted asset portfolios, and partnerships with institutional investors. For example, Goodman Group and Aware Super established a USD 1.3 billion logistics platform in California in September 2025, initially comprising three properties serving tenants including Amazon, Maersk, and Relativity Space. Sale-leaseback transactions, joint ventures, and institutional capital partnerships can help property owners fund expansion without relying exclusively on public equity markets.
REIT Industry Leaders
-
Welltower
-
Prologis
-
Equinix
-
American Tower
-
Simon Property Group
- *Disclaimer: Major Players sorted in no particular order
REIT Market Companies Covered in this Report
- Welltower Inc.
- Prologis, Inc.
- Equinix, Inc.
- American Tower Corporation
- Simon Property Group, Inc.
- Digital Realty Trust, Inc.
- Realty Income Corporation
- Public Storage
- Goodman Group
- Ventas, Inc.
- Iron Mountain Incorporated
- VICI Properties Inc.
- Extra Space Storage Inc.
- Weyerhaeuser Company
- Unibail-Rodamco-Westfield SE
- Vonovia SE
- SEGRO plc
- CapitaLand Integrated Commercial Trust
- Essex Property Trust, Inc.
- Crown Castle Inc.
Recent Industry Developments in REIT Market
- October 2026: Prologis raised its 2026 development guidance to USD 5.0 billion to USD 5.75 billion and confirmed SEGRO shareholder approval of the USD 18.8 billion merger, which is expected to create a 363-million-square-foot European industrial portfolio in the first half of 2027.
- September 2026: Nareit reported that REITs raised USD 19.8 billion through secondary debt and equity offerings in the third quarter of 2026, taking year-to-date capital raised to USD 65.7 billion.
- August 2026: Goodman Group’s global PowerBank increased to 6.4 GW, and its work-in-progress pipeline was targeted to reach AUD 18 billion (USD 11.7 billion) by June 2026, with 75% in data center assets.
- March 2026: CapitaLand Ascendas REIT announced USD 1.4 billion in acquisitions across Singapore logistics facilities and a 49% stake in a Greater Osaka hyperscale data center, supported by a USD 900 million equity raise.
Global REIT Market Report Scope
Segmentation Overview
| Equity REITs |
| Mortgage REITs |
| Hybrid REITs |
| Residential |
| Retail |
| Industrial and Logistics |
| Office |
| Healthcare |
| Data Centres |
| Telecommunications Infrastructure |
| Self-Storage |
| Lodging and Resorts |
| Gaming |
| Timberland |
| Specialty |
| Diversified |
| Publicly Traded REITs |
| Public Non-Traded REITs |
| Private REITs |
| Large-cap |
| Mid-cap |
| Small-cap |
| North America | United States |
| Canada | |
| Mexico | |
| South America | Brazil |
| Argentina | |
| Rest of South America | |
| Europe | United Kingdom |
| Germany | |
| France | |
| Italy | |
| Spain | |
| Rest of Europe | |
| Asia-Pacific | China |
| Japan | |
| India | |
| South Korea | |
| Australia | |
| Indonesia | |
| Thailand | |
| Malaysia | |
| Singapore | |
| Vietnam | |
| Rest of Asia-Pacific | |
| Middle East and Africa | Saudi Arabia |
| United Arab Emirates | |
| Turkey | |
| South Africa | |
| Egypt | |
| Rest of Middle East and Africa |
| By REIT Structure | Equity REITs | |
| Mortgage REITs | ||
| Hybrid REITs | ||
| By Property Sector | Residential | |
| Retail | ||
| Industrial and Logistics | ||
| Office | ||
| Healthcare | ||
| Data Centres | ||
| Telecommunications Infrastructure | ||
| Self-Storage | ||
| Lodging and Resorts | ||
| Gaming | ||
| Timberland | ||
| Specialty | ||
| Diversified | ||
| By Listing and Trading Status | Publicly Traded REITs | |
| Public Non-Traded REITs | ||
| Private REITs | ||
| By Market Capitalization Size | Large-cap | |
| Mid-cap | ||
| Small-cap | ||
| By Geography | North America | United States |
| Canada | ||
| Mexico | ||
| South America | Brazil | |
| Argentina | ||
| Rest of South America | ||
| Europe | United Kingdom | |
| Germany | ||
| France | ||
| Italy | ||
| Spain | ||
| Rest of Europe | ||
| Asia-Pacific | China | |
| Japan | ||
| India | ||
| South Korea | ||
| Australia | ||
| Indonesia | ||
| Thailand | ||
| Malaysia | ||
| Singapore | ||
| Vietnam | ||
| Rest of Asia-Pacific | ||
| Middle East and Africa | Saudi Arabia | |
| United Arab Emirates | ||
| Turkey | ||
| South Africa | ||
| Egypt | ||
| Rest of Middle East and Africa | ||
Key Questions Answered in the Report
What is driving growth in the REIT market?
The REIT market is projected to grow at a 4.6% CAGR through 2032, supported by institutional allocations, data center demand, senior housing demand, and broader REIT frameworks.
Which REIT property sector is growing fastest?
Data centers are projected to grow at an 11.8% CAGR through 2032 as artificial intelligence workloads increase leasing demand.
Which REIT structure has the largest share?
Equity REITs held 85.7% share in 2026 because direct property ownership remains the dominant listed real estate structure.
Why are private REITs gaining traction?
Private REITs are projected to grow at a 7.5% CAGR through 2032, supported by investors seeking net-asset-value-based returns and diversified capital access.
Which region has the highest REIT share?
North America held 70.3% share in 2026, supported by deep capital markets and an established United States legal framework.
What constrains REIT performance?
Higher refinancing costs, valuation volatility, distribution requirements, and rising property operating costs can reduce returns and limit capital available for investment.