
Real Estate Brokerage Services Market Size and Share
Market Overview
| Study Period | 2021 - 2032 |
|---|---|
| Market Size (2027) | USD 0.95 Trillion |
| Market Size (2032) | USD 1.20 Trillion |
| Growth Rate (2027 - 2032) | 4.76 % |
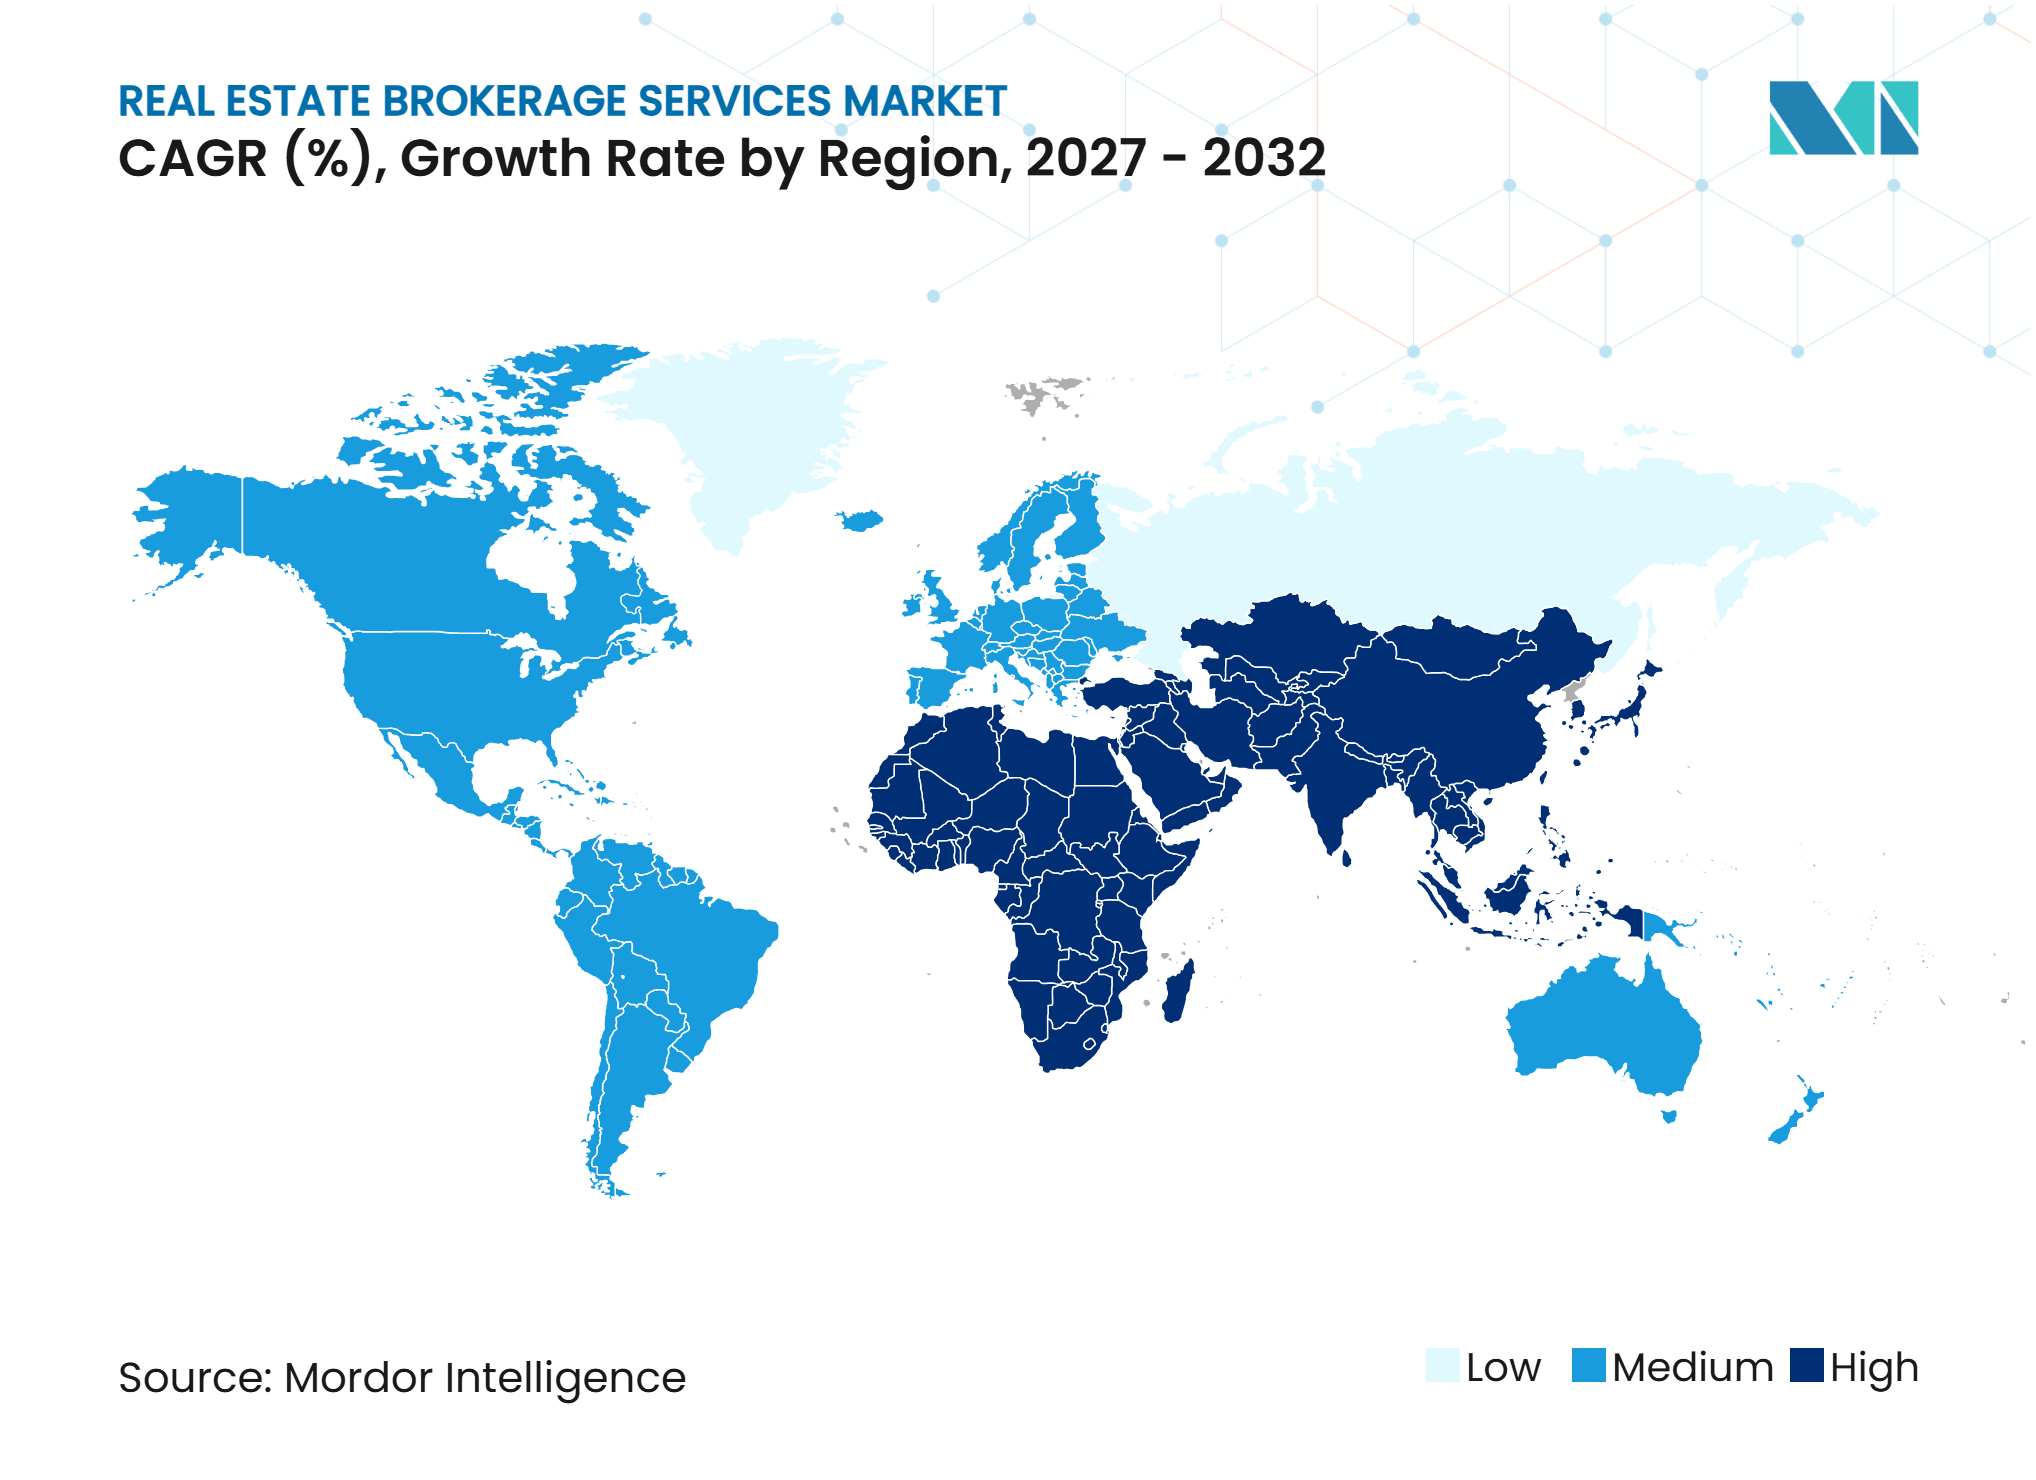
| Fastest Growing Market | Middle East and Africa |
| Largest Market | Asia-Pacific |
| Market Concentration | Medium |
Major Players *Disclaimer: Major Players sorted in no particular order Image © Mordor Intelligence. Reuse requires attribution under CC BY 4.0. | |
Real Estate Brokerage Services Market Analysis by Mordor Intelligence
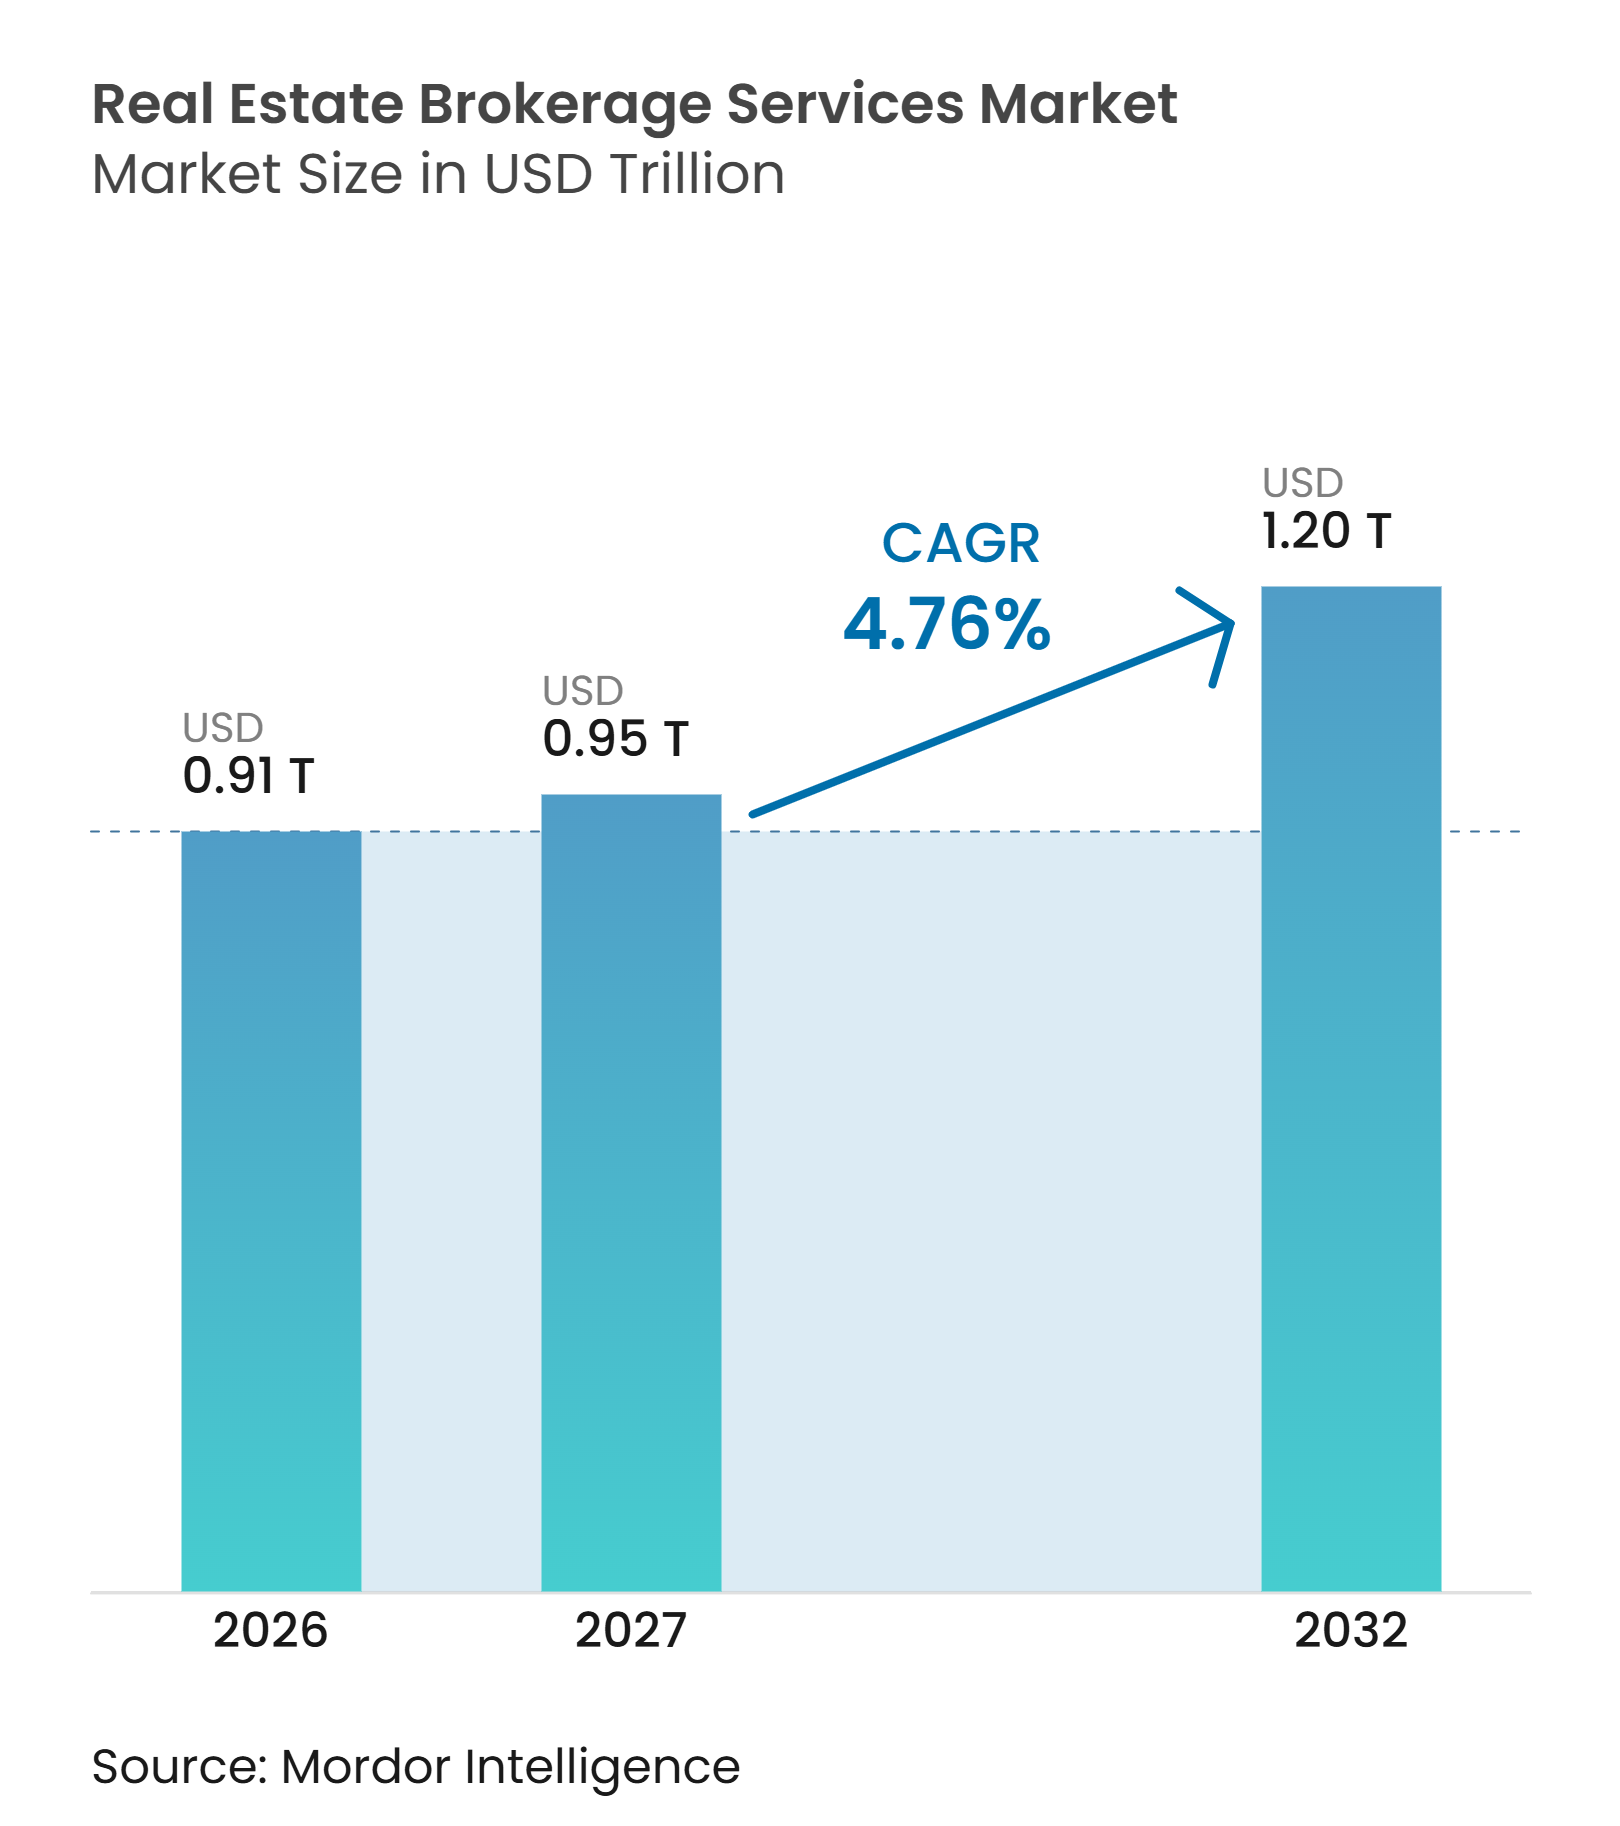
The Real Estate Brokerage Services Market size was USD 0.91 trillion in 2026 and is projected to be USD 0.95 trillion in 2027 and to reach USD 1.20 trillion by 2032, growing at a CAGR of 4.76% from 2027 to 2032.
Urban household formation, rising resale activity, and the growing role of institutional owners are driving demand for real estate brokerage services across sales and leasing. Brokers are handling more complex mandates as investors seek advice on financing, regulation, portfolio strategy, and transactions across borders. Technology is changing the service model because clients expect faster matching, better market data, and more tailored support. Commission reform and high borrowing costs are putting pressure on transaction-led models, which increases the importance of leasing, tenant representation, and advisory work. The real estate brokerage services market is also rewarding firms that combine local execution with specialized knowledge in logistics, digital infrastructure, and institutional property.
Key Report Takeaways
• By business model, sales held a 64.6% share of the real estate brokerage services market in 2026 and represented the largest segment size, while rental is forecast to grow at a 5.58% CAGR through 2032.
• By property type, apartments and condominiums held a 52% share of the real estate brokerage services market in 2026 and represented the largest segment size, while logistics is forecast to expand at a 6.4% CAGR through 2032.
•By client type, individuals and households held a 55% share of the real estate brokerage services market in 2026. They represented the largest segment size, while corporates and small and medium enterprises are forecast to grow at a 5.05% CAGR through 2032.
• By geography, Asia-Pacific accounted for a 43.5% share of the real estate brokerage services market in 2026. It represented the largest regional size, while the Middle East and Africa is forecast to expand at a 6.14% CAGR through 2032.
Note: Market numbers in this report are based on Mordor Intelligence's proprietary estimation framework, which combines nine months of actuals with Q4 projections for base year 2026.
Market Trends and Insights
Drivers Impact Analysis of Real Estate Brokerage Services Market*
| Drivers | (~) % Impact on CAGR Forecast | Geographic Relevance | Impact Timeline |
|---|---|---|---|
| Residential Transaction Activity | +1.5% | Global, with intensity in Asia-Pacific and South America | Short term (≤ 2 years) |
| Institutionalization of Commercial Real Estate | +1.0% | North America, Europe, Asia-Pacific | Medium term (2-4 years) |
| Growth in Logistics and Industrial Property | +0.8% | Asia-Pacific, North America, Europe | Medium term (2-4 years) |
| Cross-Border Capital Flows | +0.6% | Global, led by the United Kingdom, United States, India, and Gulf Cooperation Council markets | Long term (≥ 4 years) |
| Recurring Leasing and Tenant Representation Demand | +0.5% | North America, Europe, Asia-Pacific | Short term (≤ 2 years) |
| Service Differentiation Beyond Listing Access | +0.3% | Global, with early traction in North America and Asia-Pacific | Long term (≥ 4 years) |
| Source: Mordor Intelligence | |||
Residential Transaction Activity Sustains the Core Revenue Base
Urban household formation continues to supply the transaction volume that supports residential brokerage pipelines. China’s Ministry of Housing and Urban-Rural Development reported that second-hand residential transactions exceeded new-home sales in the first half of 2026 and represented 50.4% of national property transactions[1]. This shift gives brokers a larger role in pricing, negotiation, and matching buyers with suitable resale inventory. It also makes proprietary listings and local knowledge more valuable than basic access to a multiple listing service. France maintains a 35% maximum debt-service-to-income limit through the Haut Conseil de Stabilité Financière, which keeps mortgage qualification disciplined and supports a need for professional guidance among eligible buyers. These conditions keep residential activity central to the real estate brokerage services market even when interest rates affect the timing of individual transactions.
Institutionalization of Commercial Real Estate Deepens Advisory Demand
Commercial ownership is moving toward institutional investors, real estate investment trusts, and sovereign wealth funds. This ownership mix raises the value of specialist advice because mandates often include capital markets work, financing, tax considerations, and regulatory reviews. CBRE’s 2026 Asia-Pacific investor survey reported net buying intentions of 17%, while office assets became the most sought-after property type for the first time in 6 years. Australia, Japan, and Singapore were important markets in that shift, which broadens the scope of cross-border advisory work. The real estate brokerage services market therefore benefits when brokers can support institutional clients through larger and more regulated transactions. Firms without that expertise are more exposed to competition based mainly on listings and transaction fees.
Growth in Logistics and Industrial Property Creates a Durable Specialist Niche
E-commerce fulfillment, manufacturing investment, and data center development are increasing the need for logistics and industrial property expertise. JLL Capital Markets arranged the March 2026 sale and acquisition financing of a 7.3-million-square-foot logistics portfolio covering 36 distribution facilities in 12 United States markets. The transaction showed that large logistics mandates require financing capability alongside property marketing and buyer outreach. JLL also reported in November 2026 that global logistics take-up strengthened across regions through demand from third-party logistics providers, e-commerce tenants, manufacturers, and defense occupiers. Logistics is forecast to grow at a 6.4% CAGR, making it the fastest-growing property type within the sales model. The real estate brokerage services market is consequently creating more room for teams that understand industrial locations, tenant requirements, and complex capital structures.
Cross-Border Capital Flows Amplify Transaction Complexity and Broker Value
Cross-border investment broadens the deal pipeline for firms that can advise clients across jurisdictions. International buyers need support with market entry, local regulations, financing practices, and partner selection. The United States, the United Kingdom, and India are important destinations for international property investors in the supplied research, which makes multi-country coverage a useful capability. These transactions tend to place a higher value on established institutional relationships and local execution. The real estate brokerage services market can benefit when platforms connect those relationships across regions instead of handling each transaction as a stand-alone local assignment. That advantage is difficult for smaller firms to reproduce without sustained investment in specialist people and regulatory knowledge.
Restraints Impact Analysis of Real Estate Brokerage Services Market*
| Restraints | (~) % Impact on CAGR Forecast | Geographic Relevance | Impact Timeline |
|---|---|---|---|
| Interest-Rate and Affordability Pressure | -1.2% | Europe, North America, parts of Asia-Pacific | Short term (≤ 2 years) |
| Commission Compression | -0.8% | North America, with spillover to Europe and Australia | Medium term (2-4 years) |
| Low Inventory and Delayed Listings | -0.5% | North America, Western Europe | Short term (≤ 2 years) |
| Local Licensing and Fragmented Supply | -0.3% | Asia-Pacific, Africa, South America | Long term (≥ 4 years) |
| Source: Mordor Intelligence | |||
Interest-Rate and Affordability Pressure Suppresses Transaction Volumes
High borrowing costs continue to constrain home-purchase affordability in several mature markets. In France, the 35% debt-service ceiling under the High Council for Financial Stability's mortgage lending rules remains an important consideration for mortgage applicants, subject to permitted lending exceptions[2]. The French residential property market is projected to record approximately 920,000 transactions in 2026, down from around 952,000 in 2025, reflecting financing constraints and cautious buyer behaviour[3]. Fewer completed transactions can reduce income for brokerages that depend heavily on transaction volumes. Although higher property values can partly support commission pools by increasing transaction values, this may not fully offset lower sales volumes, particularly for firms with high fixed operating costs. The real estate brokerage services market therefore places greater importance on higher-value advisory assignments and recurring services to diversify revenue during periods of restricted affordability.
Commission Compression Tests Revenue Model Resilience
The United States commission framework is changing after the Eighth Circuit Court of Appeals affirmed final approval of the National Association of Realtors settlement in August 2026. The settlement removed the rule that required sellers to offer buyer-broker compensation through multiple listing service listings. Buyers and brokers must now negotiate compensation more directly, which increases pressure on standard percentage-based fees. Median buyer-agent commissions in monitored United States markets declined from 2.7% to 2.4% after implementation, according to the supplied research. The United States Department of Justice continues to examine commission practices, which keeps regulatory pressure on the sector. Brokerages are responding with flat-fee, tiered-service, and subscription options that present advice as a defined service rather than an automatic share of the sale price.
*Our forecasts treat driver/restraint impacts as directional, not additive. The impact forecasts reflect baseline growth, mix effects, and variable interactions.
Real Estate Brokerage Services Market Segment Analysis
By Business Model:
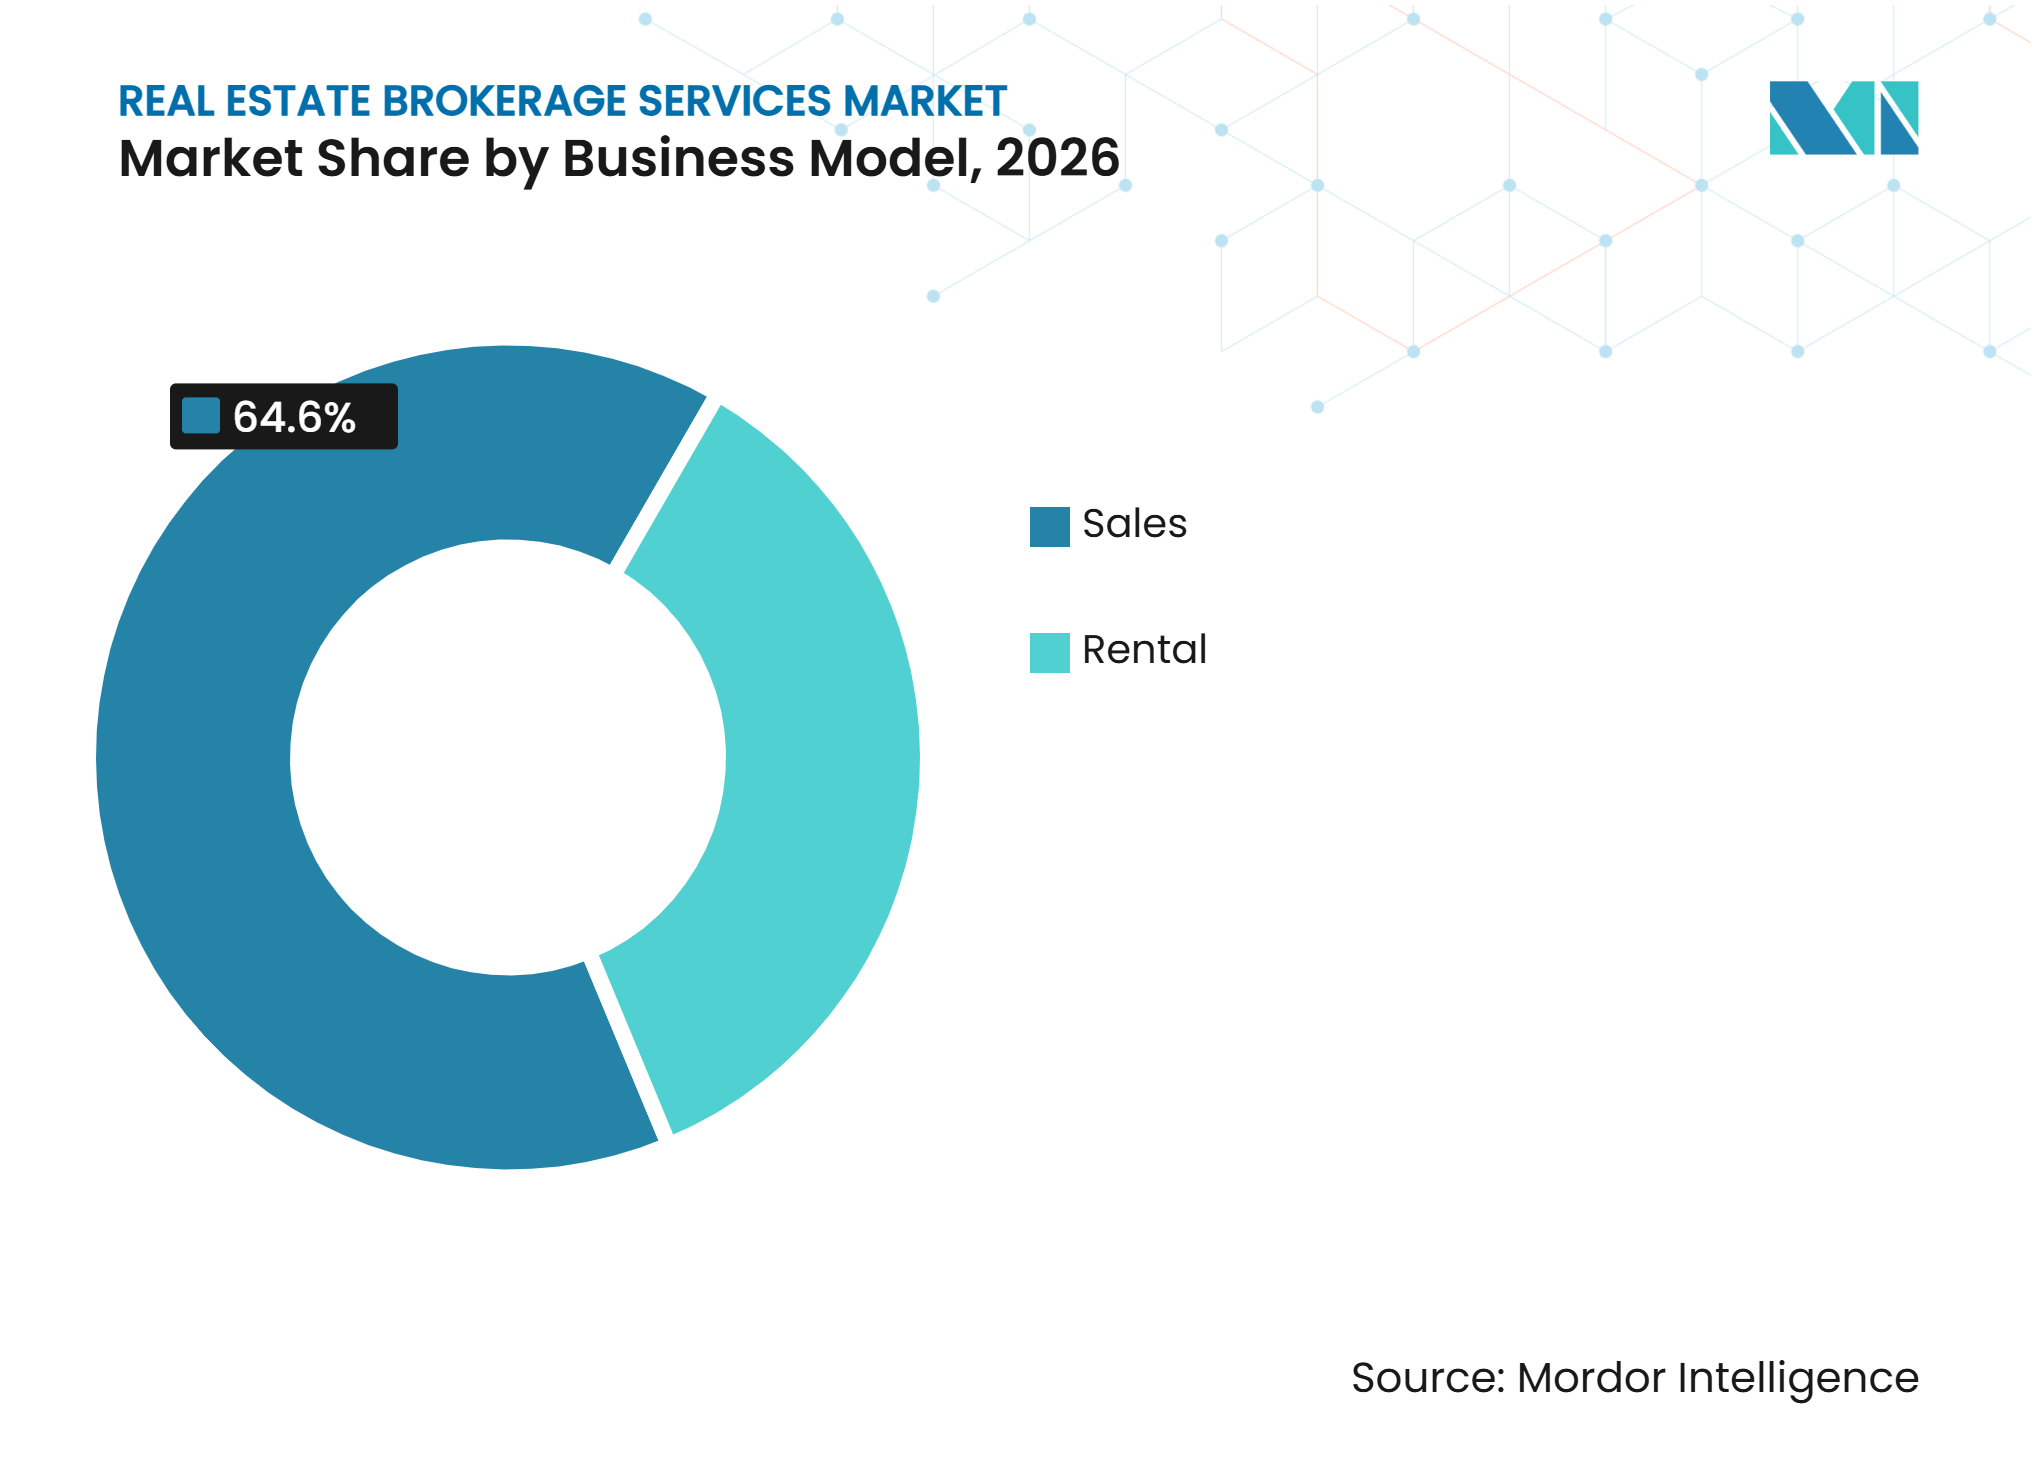
Sales Leads, While Rental Builds Structural MomentumSales held a 64.6% share in 2026 because buyers and sellers often seek professional support for high-value capital decisions. The model is supported by residential sales, which continue to generate large transaction volumes in owner-occupier markets. Australia, Germany, Japan, and South Korea have ownership cultures that continue to support demand for transaction assistance. High interest rates may delay purchase decisions, but household formation still creates a continuing need for homes. In these cases, brokers help clients assess pricing, negotiate terms, and manage the steps needed to complete a transaction.
Rental is forecast to grow at a 5.58% CAGR from 2027 to 2032 as affordability pressure keeps more potential buyers in the rental market for longer. Tenant representation includes lease negotiation, renewal support, location advice, and landlord engagement. These services can produce recurring income instead of a single commission from a completed sale. Corporate tenant representation adds further stability because companies often need ongoing help with office, industrial, and retail portfolios. The real estate brokerage services industry is therefore shifting toward a more balanced model that combines sales commissions with repeat advisory work.


By Property Type (Sales Model):
Apartments Maintain Volume, While Logistics Expands FasterApartments and condominiums accounted for 52% of the real estate brokerage services market size within the sales-model property segmentation in 2026. This position reflects the broad residential transaction base that supports repeated deal flow across many cities. Digital viewing is changing how clients assess these properties before arranging an in-person visit. The 58.com and Anjuke report found that virtual reality property viewing was used by 45% of homebuyers in 2026. Brokers must therefore add value through advice, negotiation, and local market interpretation rather than property discovery alone.
Logistics is forecast to grow at a 6.4% CAGR through 2032, the highest rate among sales-model property types. JLL arranged the sale of Crossroads Logistics Park, an 814,320-square-foot Class A logistics facility in Spartanburg, South Carolina, to Invesco Real Estate in August 2026. The deal reflects continuing institutional interest in properties near manufacturing and distribution corridors. Villas and landed houses remain smaller in transaction volume but can produce higher commission value because of their price points and international buyer interest. Office and retail leasing also showed signs of recovery, with CBRE reporting 29% year-over-year growth in United States office leasing in the second quarter of 2026.
By Client Type (Sales Model):
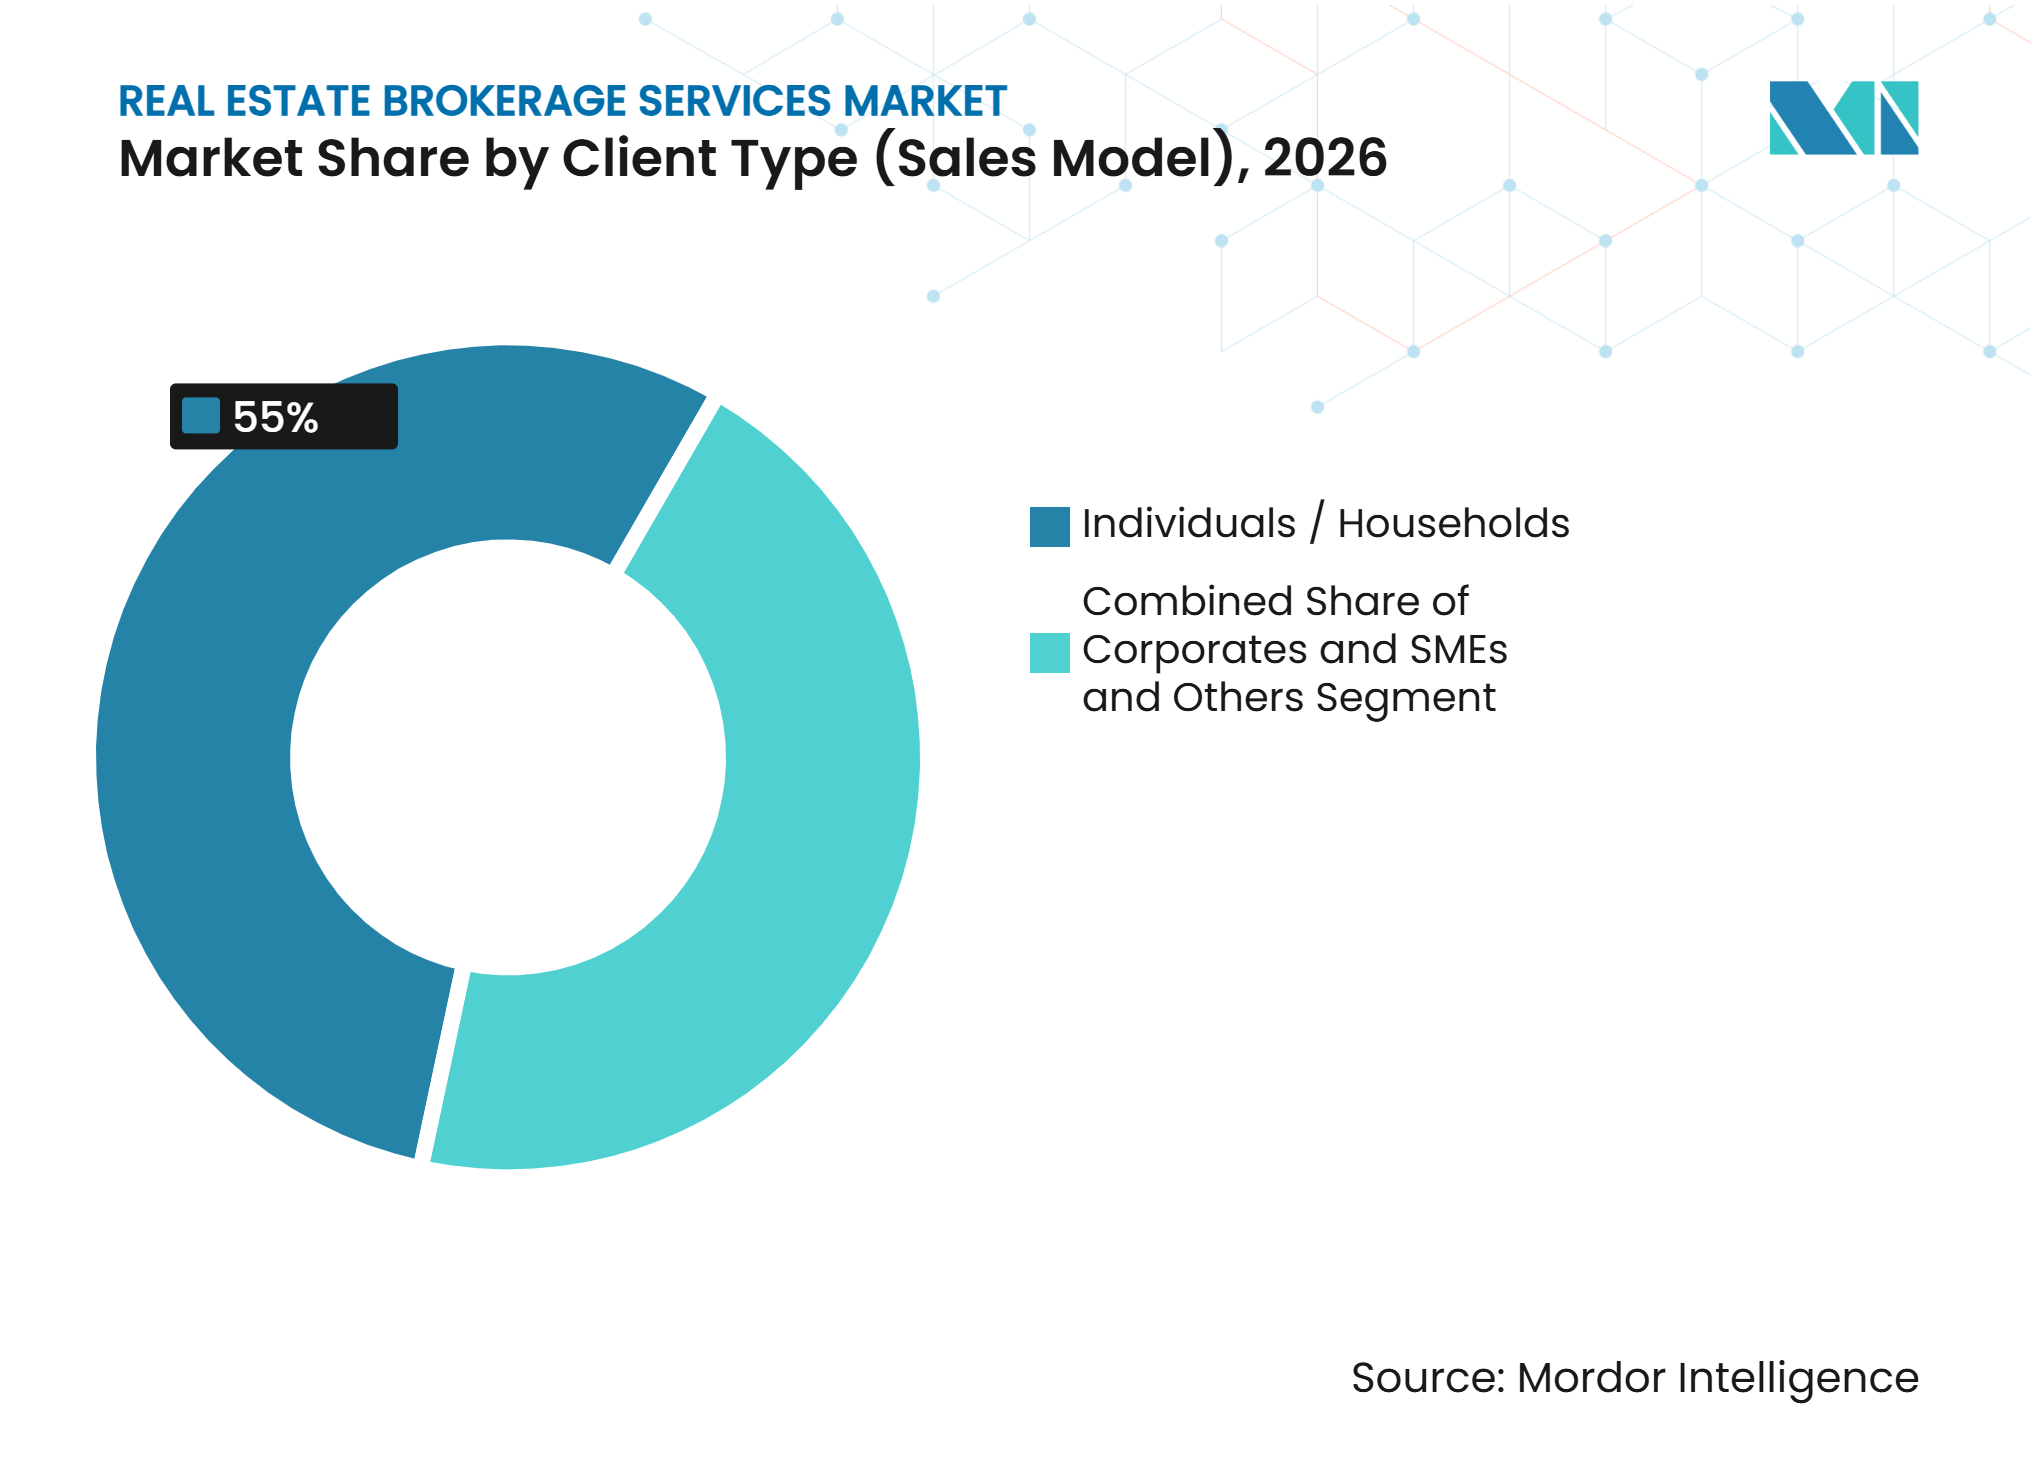
Households Anchor Transaction Volume, While Corporate Mandates GrowIndividuals and households represented 55% of the sales-model client segmentation in 2026. They remain the largest client group in markets with broad owner-occupier demand, including the United States, Germany, Spain, Japan, and China. Household formation, migration, and changing living needs continue to create demand even when affordability conditions postpone some purchases. These clients often need support with valuation, financing coordination, property search, and negotiation. Local presence and trusted advice remain important because residential purchases are significant financial decisions for most households.
Corporates and small and medium enterprises are forecast to grow at a 5.05% CAGR through 2032. Portfolio rationalization, expansion, relocations, and sale-leaseback transactions are increasing the need for specialized corporate advice. A late-2026 survey from CORFAC International found that more than 80% of responding independent commercial broker firms cited existing client expansions as a business driver. In comparison, 62% reported new corporate relocations in their markets. These mandates may involve multiple properties, longer planning periods, and more detailed lease or capital analysis. Government bodies and nonprofit organizations also contribute steady work, particularly when infrastructure-related property needs are involved.


Geography Analysis
Asia-Pacific
Asia-Pacific held 43.5% of the real estate brokerage services market share in 2026, supported by extensive residential and commercial transaction pipelines in China, India, Japan, Australia, and Southeast Asia. CBRE reported net buying intentions of 17% in 2026, with office assets becoming the preferred sector and Australia, Japan, Singapore, and Seoul favored destinations. China’s Ministry of Housing and Urban-Rural Development reported that second-hand homes exceeded new-home sales in the first half. In contrast, KE Holdings reported USD 231.8 billion in total transaction value. Singapore’s cooling measures, China’s advertising requirements, and Philippine licensing standards favor platforms with strong governance and local operating knowledge. Virtual reality viewing and artificial intelligence tools are also increasing expectations for faster matching and stronger agent support.
Middle East and Africa
The Middle East and Africa real estate brokerage services market is forecast to grow at a 6.14% CAGR from 2027 to 2032. Gulf Cooperation Council investment programs, expatriate growth, and foreign interest in the United Arab Emirates and Saudi Arabia support this outlook. Abu Dhabi recorded USD 31.9 billion in real estate transactions in the first half of 2026, while foreign direct investment reached USD 3.8 billion and new professional licenses rose 34% to 2,040. Byit formed Byit Ventures in the United Arab Emirates to connect Egyptian property supply with Gulf investor demand through artificial intelligence tools. Yakeey raised USD 15 million to expand its digital marketplace and network of more than 800 independent brokers across North Africa.
North America, Europe, and South America
North America remains a large brokerage market, where CBRE reported USD 11.2 billion in second-quarter 2026 revenue, JLL reported USD 6.9 billion, and Cushman and Wakefield reported USD 2.8 billion. Corporate leasing, industrial activity, and capital markets recovery support this performance, while residential activity faces affordability pressure and changing commission practices. In Europe, the United Kingdom, Spain, and Nordic markets performed better in the supplied research. However, Spain had more than 60,000 intermediary businesses, and shortages limited completed transactions. Brazil, Chile, and Argentina offer longer-term demand through urbanization and middle-class formation, but local knowledge remains necessary because currency and fiscal volatility can interrupt activity.
Competitive Landscape
Market Concentration
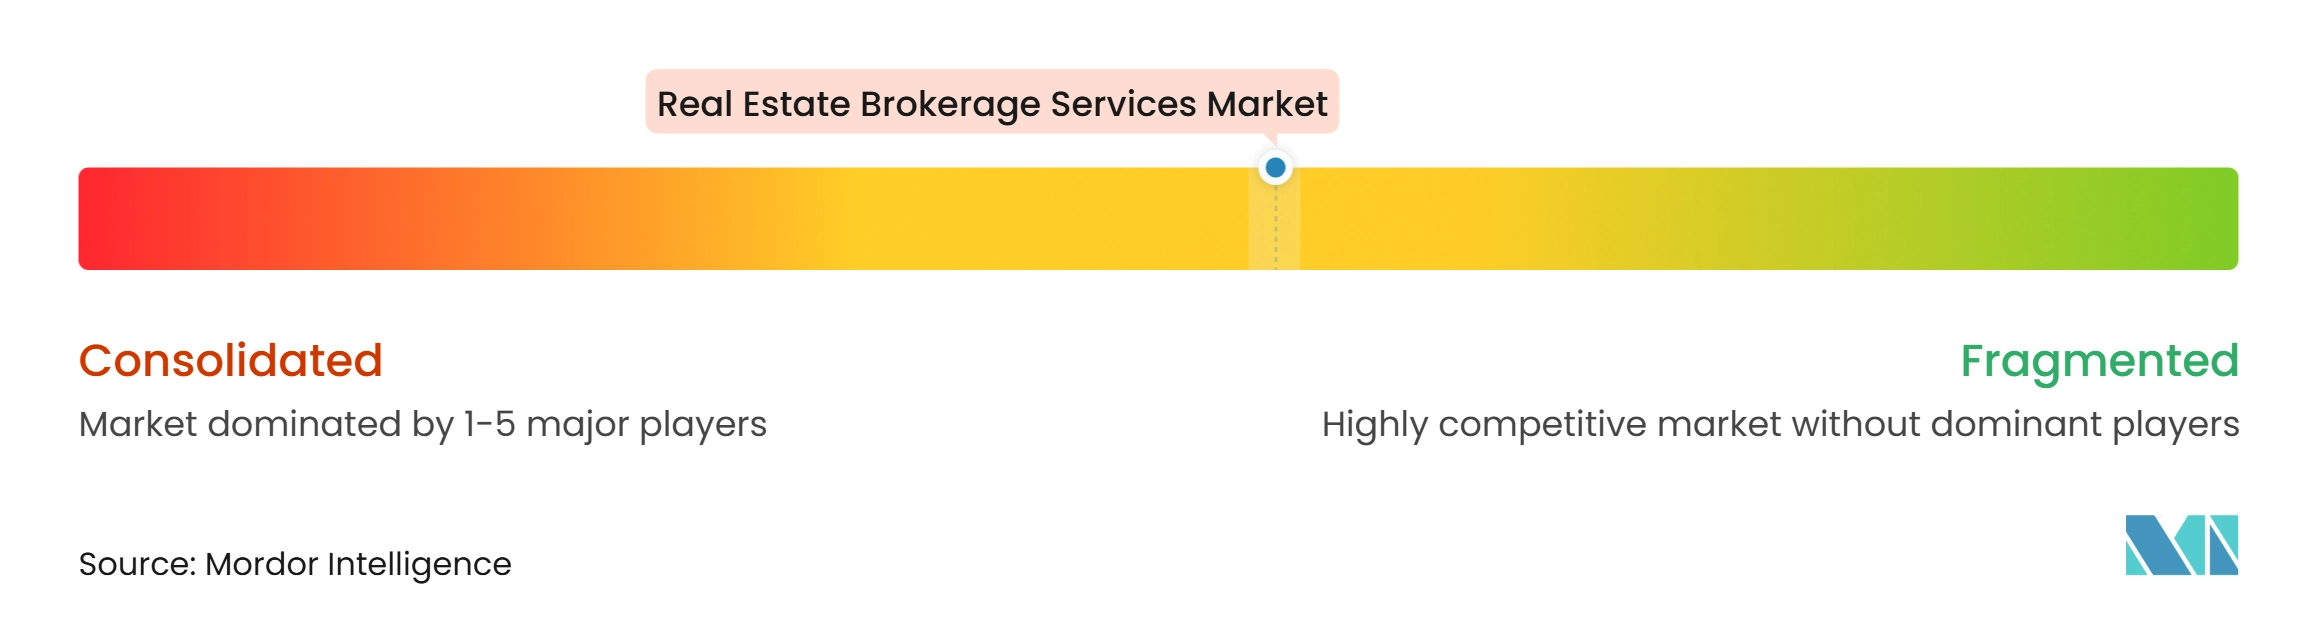
The real estate brokerage services market has a concentrated commercial segment and a fragmented residential segment. CBRE, JLL, Cushman and Wakefield, Colliers International Group, and Newmark Group manage a large share of institutional mandates. At the same time, residential business is spread across independent firms, franchise networks, and digital platforms. Independent and virtual models represented 28.8% of United States top brokerage rankings in 2026, which reflects their appeal in price-sensitive residential work. Major commercial firms compete on specialist capability and geographic reach, while residential firms compete on service models, local presence, agent recruitment, and technology.
Technology and infrastructure advice are key areas of competition in the real estate brokerage services market. CBRE’s data center services generated more than USD 700 million in second-quarter 2026 revenue, and the company expects 25% annual growth over the next 5 years. In October 2026, CBRE agreed to acquire Onnec Group for an initial USD 610 million plus an earnout of up to USD 400 million. The transaction adds technical services to CBRE’s established advisory work. JLL and Cushman and Wakefield are also integrating infrastructure advice, which responds to investor interest in data centers and other digital assets.
Artificial intelligence adoption is changing agent workflows and competitive requirements across the real estate brokerage services market. The 58.com and Anjuke report found that 49.7% of Chinese agents used artificial intelligence tools, rising to 58.9% in tier-one cities. The National Association of Realtors found that 54% of United States agents monitored generative artificial intelligence for content creation and 48% evaluated artificial intelligence-based lead generation. The Real Brokerage and eXp Realty use agent-equity models that compete with traditional franchise models for productive agents. Tenant representation, sustainable building advice, and North Africa to Gulf sales remain areas where differentiated service can matter.
Real Estate Brokerage Services Industry Leaders
-
CBRE Group, Inc.
-
Jones Lang LaSalle Incorporated
-
Cushman & Wakefield plc
-
Colliers International Group Inc.
-
Savills plc
- *Disclaimer: Major Players sorted in no particular order
Real Estate Brokerage Services Market Companies Covered in this Report
- CBRE Group, Inc.
- Jones Lang LaSalle Incorporated
- Cushman & Wakefield plc
- Colliers International Group Inc.
- Savills plc
- Knight Frank LLP
- Newmark Group, Inc.
- BNP Paribas Real Estate S.A.
- Engel & Völkers GmbH
- Marcus & Millichap, Inc.
- Keller Williams Realty, Inc.
- RE/MAX, LLC
- Berkshire Hathaway HomeServices
- eXp Realty, LLC
- The Real Brokerage Inc.
- Compass, Inc.
- Sotheby’s International Realty Affiliates LLC
- Douglas Elliman Inc.
- LPT Realty
- Howard Hanna Real Estate Services
Recent Industry Developments in Real Estate Brokerage Services Market
- October 2026: CBRE Group Inc. announced a definitive agreement to acquire Onnec Group Limited, a data center infrastructure services provider operating in Europe and Asia-Pacific, for an initial purchase price of USD 610 million in cash, plus an earnout of up to USD 400 million contingent on Onnec meeting specified growth thresholds. The deal is expected to bring CBRE's Critical Infrastructure Services revenue to nearly USD 4.5 billion in 2027 and is subject to customary regulatory approvals.
- August 2026: The United States Eighth Circuit Court of Appeals affirmed final approval of the National Association of Realtors class action settlement, valued at more than USD 1 billion, in Burnett v. National Association of Realtors. The ruling eliminates the Cooperative Compensation Rule requiring sellers to offer buyer-broker compensation through multiple listing service listings, formally restructuring compensation negotiation across the United States residential brokerage market.
- August 2026: JLL Capital Markets arranged the sale of Crossroads Logistics Park, a 3-building, 814,320-square-foot Class A logistics facility in Spartanburg, South Carolina, to Invesco Real Estate on behalf of sellers Brennan Investment Group and Grandview Partners, in a transaction underscoring sustained institutional capital appetite for best-in-class logistics assets in key manufacturing and distribution corridors.
Global Real Estate Brokerage Services Market Report Scope
Segmentation Overview
| Residential | Apartments and Condominiums |
| Villas and Landed Houses | |
| Commercial | Office |
| Retail | |
| Logistics |
| Individuals / Households |
| Corporates & SMEs |
| Others |
| North America | United States |
| Canada | |
| Mexico | |
| South America | Brazil |
| Argentina | |
| Chile | |
| Rest of South America | |
| Europe | United Kingdom |
| Germany | |
| France | |
| Italy | |
| Spain | |
| Russia | |
| Rest of Europe | |
| Asia - Pacific | China |
| India | |
| Japan | |
| South Korea | |
| Australia | |
| Rest of Asia - Pacific | |
| Middle East and Africa | United Arab Emirates |
| Saudi Arabia | |
| South Africa | |
| Nigeria | |
| Rest of Middle East & Africa |
| By Property Type | Residential | Apartments and Condominiums |
| Villas and Landed Houses | ||
| Commercial | Office | |
| Retail | ||
| Logistics | ||
| By Client Type | Individuals / Households | |
| Corporates & SMEs | ||
| Others | ||
| By Geography | North America | United States |
| Canada | ||
| Mexico | ||
| South America | Brazil | |
| Argentina | ||
| Chile | ||
| Rest of South America | ||
| Europe | United Kingdom | |
| Germany | ||
| France | ||
| Italy | ||
| Spain | ||
| Russia | ||
| Rest of Europe | ||
| Asia - Pacific | China | |
| India | ||
| Japan | ||
| South Korea | ||
| Australia | ||
| Rest of Asia - Pacific | ||
| Middle East and Africa | United Arab Emirates | |
| Saudi Arabia | ||
| South Africa | ||
| Nigeria | ||
| Rest of Middle East & Africa | ||
Key Questions Answered in the Report
What is the projected value of real estate brokerage services by 2032?
The sector is projected to reach USD 1.20 trillion by 2032, growing at a 4.76% CAGR from 2027 to 2032.
Which business model has the largest share in real estate brokerage services?
Logistics is forecast to grow at a 6.4% CAGR through 2032, supported by demand from e-commerce, manufacturing, and third-party logistics occupiers.
Why is Asia-Pacific important for real estate brokers?
Asia-Pacific held a 43.5% share in 2026 and combines large transaction volumes with rising institutional demand and expanding resale activity.
What is changing broker commission practices in the United States?
The National Association of Realtors settlement removed the requirement for seller-offered buyer-broker compensation through multiple listing service listings.
How are artificial intelligence tools changing brokerage services?
Brokers are using artificial intelligence for lead generation, property matching, content support, and workflow automation, while clients still require advice for high-value decisions.