
QoE Analytics For Telecom Operators Market Size and Share
Market Overview
| Study Period | 2020 - 2031 |
|---|---|
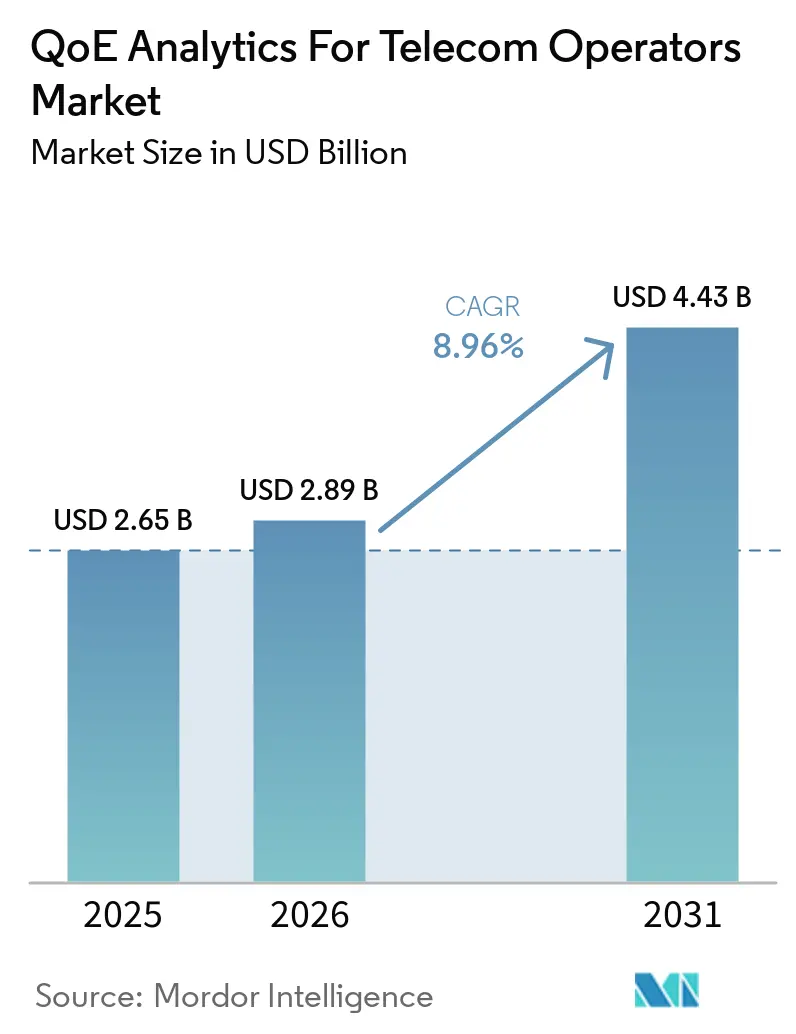
| Market Size (2026) | USD 2.89 Billion |
| Market Size (2031) | USD 4.43 Billion |
| Growth Rate (2026 - 2031) | 8.96 % |
| Fastest Growing Market | Africa |
| Largest Market | North America |
| Market Concentration | Medium |
Major Players *Disclaimer: Major Players sorted in no particular order Image © Mordor Intelligence. Reuse requires attribution under CC BY 4.0. | |
QoE Analytics For Telecom Operators Market Analysis by Mordor Intelligence
The QoE analytics for telecom operators market size was valued at USD 2.89 billion in 2026 and is estimated to reach USD 4.434 billion by 2031, at a CAGR of 8.96% during the forecast period 2026-2031. 5G standalone architecture is increasing the volume and variety of telemetry that operators must interpret across radio, transport, and core networks. This change is moving procurement toward unified software platforms that connect network data with subscriber experience data. Operators also need clearer evidence that 5G services provide a better customer experience than older networks, especially where service plans are similar. Cloud delivery can help platforms handle uneven traffic loads, although privacy and data-residency rules continue to shape deployment choices. The QoE analytics for telecom operators market is therefore becoming more closely linked to automated operations, retention programs, and enterprise service commitments.
Key Report Takeaways
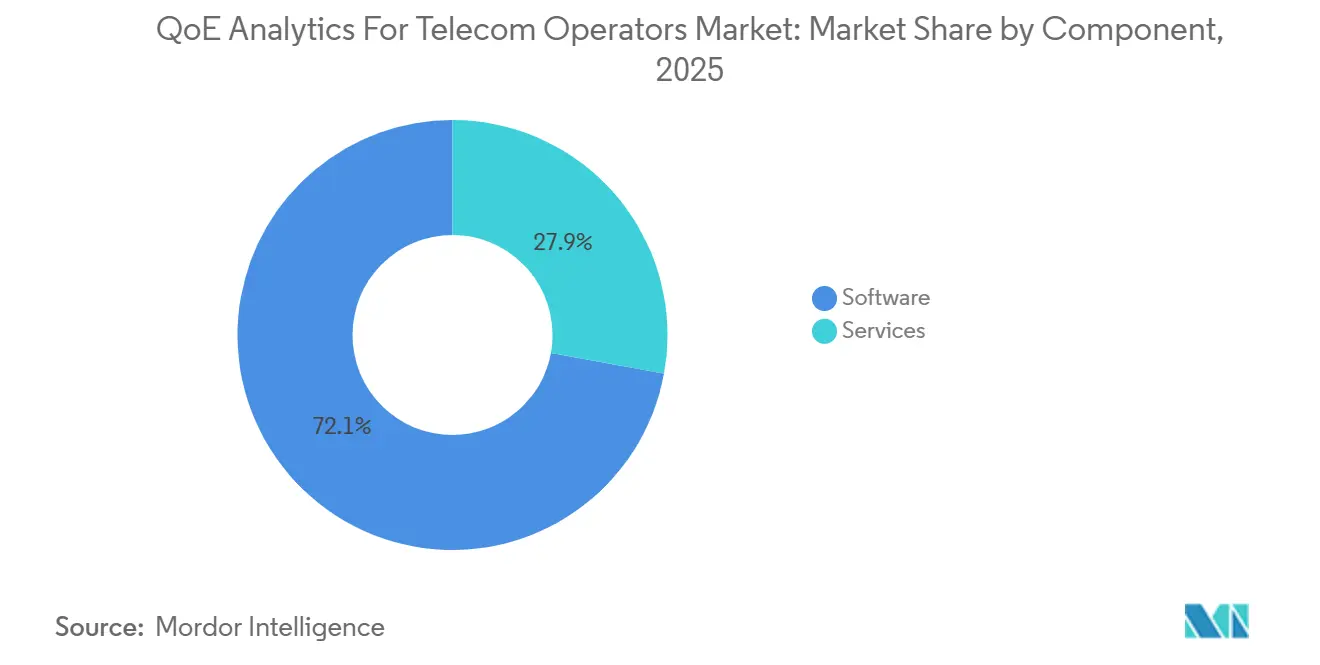
- By component, software held 72.13% of the QoE analytics for telecom operators market share in 2025, while predictive and prescriptive analytics is projected to expand at a 9.16% CAGR through 2031.
- By deployment mode, cloud deployment held 42,34% of the QoE analytics for telecom operators market share and is expected to expand at a 9.22% CAGR through 2031.
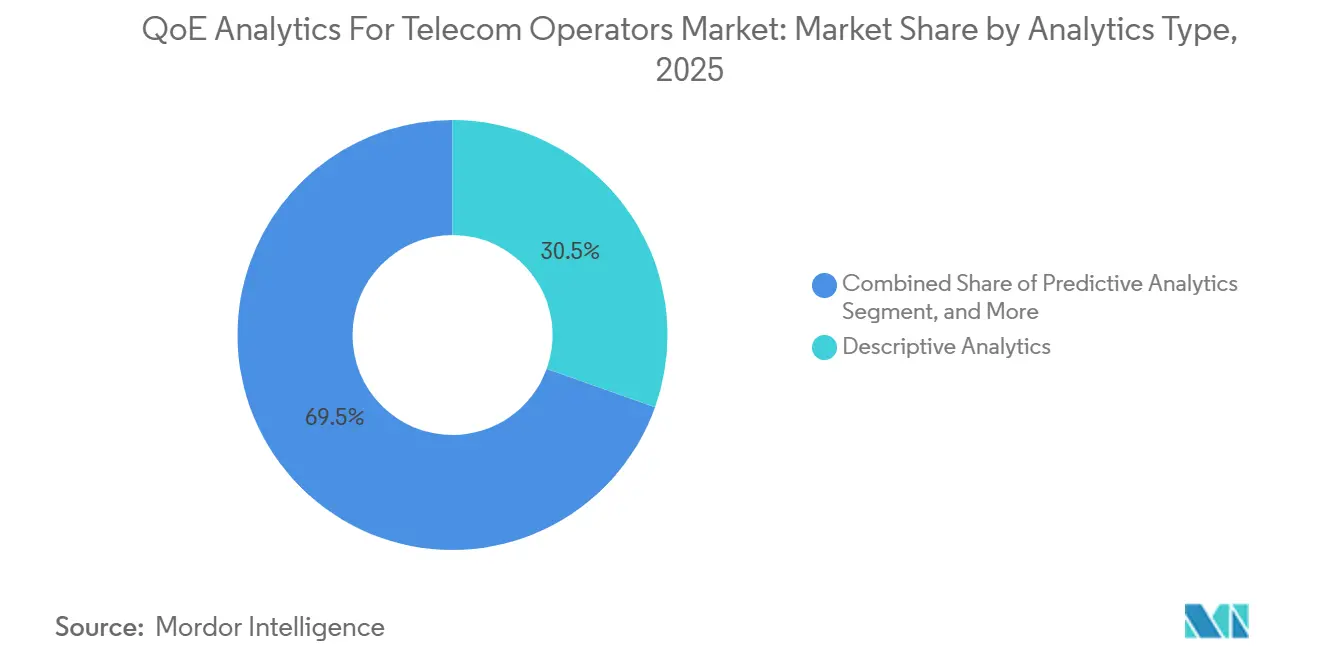
- By analytics type, descriptive analytics held 30.46% of revenue in 2025, and is expeceted to expand at a 9.26% CAGR throgh 2031.
- By application, network performance management accounted for 24.53% of revenue in 2025 and is projected to expand at a 9.33% CAGR through 2031.
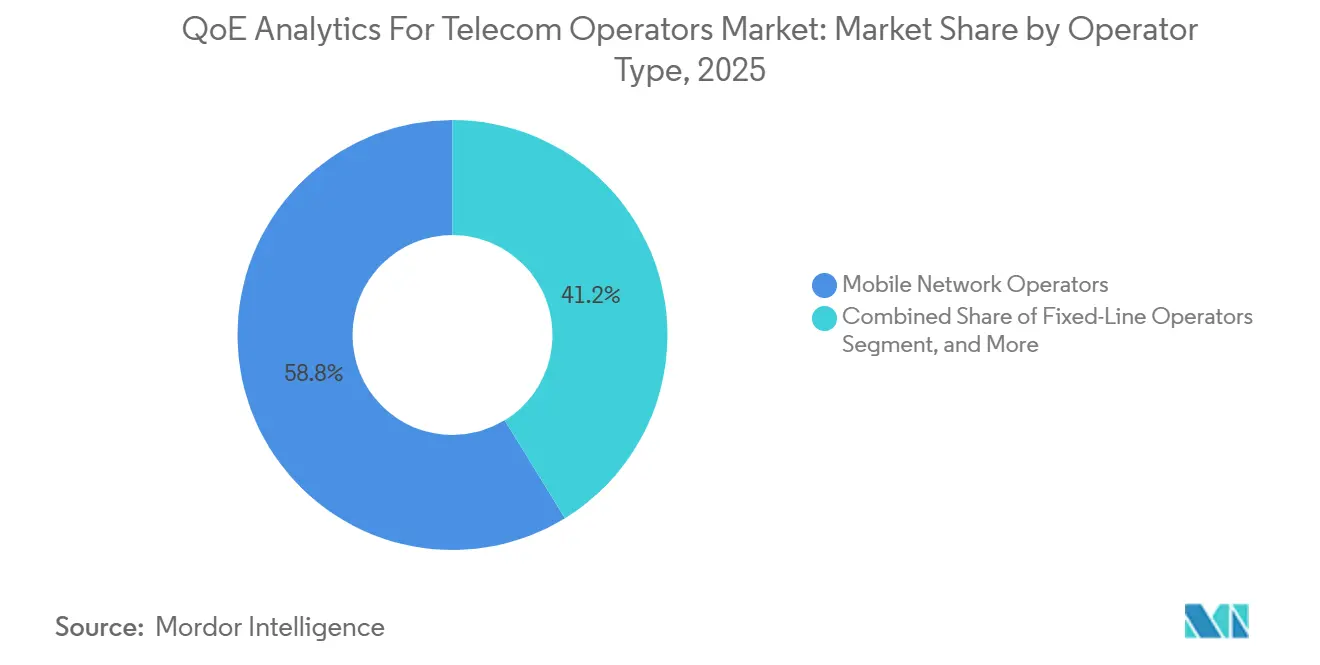
- By operator type, mobile network operators held 58.76% of revenue in 2025, and is expected to expand at a 9.68% CAGR through 2031.
- By organization size, large enterprises held 88.22% of revenue in 2025 and are projected to expand at a 9.82% CAGR through 2031.
- By geography, North America held 28.27% of revenue in 2025, while Africa is projected to expand at a 9.71% CAGR through 2031.
Note: Market size and forecast figures in this report are generated using Mordor Intelligence’s proprietary estimation framework, updated with the latest available data and insights as of January 2026.
Market Trends and Insights
Drivers Impact Analysis of QoE Analytics For Telecom Operators Market*
| Driver | (~) % Impact on CAGR Forecast | Geographic Relevance | Impact Timeline |
|---|---|---|---|
| AI-Driven Closed-Loop Service Assurance | +2.8% | Global, with early adoption in North America, Japan, South Korea, and Germany | Short term (≤ 2 years) |
| 5G Standalone Complexity and Telemetry Growth | +2.3% | Global, with strong activity in North America, China, South Korea, and Gulf Cooperation Council states | Medium term (2-4 years) |
| Subscriber Churn and Retention Economics | +1.6% | Global, especially North America and Western Europe | Medium term (2-4 years) |
| Streaming, Gaming, and Latency-Sensitive Services | +1.2% | Global, with high demand in Asia-Pacific and North America | Medium term (2-4 years) |
| Subscriber-Level Experience Monetization | +0.9% | Global, led by Gulf Cooperation Council states, North America, and Northeast Asia | Long term (≥ 4 years) |
| Network Slice and Edge-Service Validation | +0.7% | North America, Europe, Asia-Pacific, and the Middle East | Long term (≥ 4 years) |
| Source: Mordor Intelligence | |||
Shift Toward AI-Driven Closed-Loop Service Assurance
The QoE analytics for telecom operators market is benefiting from a shift away from rules-based alerts toward systems that detect, diagnose, and address network conditions with limited manual intervention. This approach extends analytics from a reporting function into an operational layer that can support service assurance decisions. RADCOM launched Neura in February 2026, with agents for customer experience, service quality, and network optimization that operate on its full-traffic analysis infrastructure.[1]RADCOM Ltd., “RADCOM Launches Neura, an AI Agent Suite Designed for Integration into Agentic AI Ecosystems,” RADCOM, radcom.com The platform can process traffic at up to 800 Gbps on a commercial off-the-shelf server, which supports deployments that require high data throughput. Recommendation M.3389, published in March 2025, set requirements for AI-based customer experience management in telecom services.[2]International Telecommunication Union, “Recommendation ITU-T M.3389: Requirements for AI-Based Customer Experience Management of Telecom Services,” International Telecommunication Union, itu.int This standard supports procurement requirements for operators that need governed and explainable AI-based customer experience processes.
5G Standalone Network Complexity and Telemetry Growth
5G standalone networks use cloud-native service-based functions that create distinct telemetry streams across the core, user plane, policy layer, and radio network. The QoE analytics for the telecom operators market addresses the need to correlate these streams at the subscriber level when an experience issue occurs. Network slicing adds a further requirement because operators must validate service-level agreements for each enterprise slice. NTT Docomo deployed Nokia MantaRay AutoPilot in June 2026 for AI-driven RAN quality optimization on a public cloud. The deployment used 15-minute closed-loop cycles instead of the earlier daily cycle and supported NTT Docomo’s Autonomous Network Level 4 objective. KT and Samsung also validated AI RAN optimization on a commercial 5G network in South Korea during 2025, using user-level AI configurations to predict service disruptions.[3]GSMA Intelligence, “Service Assurance Trends in the AI Era,” GSMA Intelligence, gsmaintelligence.com
Rising Subscriber Churn and Retention Economics
In mature telecom markets, retaining high-value subscribers can be more commercially important than acquiring new customers. The QoE analytics for the telecom operators market supports this priority by identifying experience patterns that may precede a cancellation or a lower level of usage. A Scientific Reports study of telecom subscribers found that QoE indicators produced stronger churn signals than traditional network counters alone. The model in that study achieved high accuracy and strong predictive performance. TM Forum reported that proactive resolution of network issues linked to actual user experience can reduce churn at scale. These results make service quality data relevant to customer care, retention, and network investment decisions.
Expansion of Streaming, Gaming, and Latency-Sensitive Services
Streaming, cloud gaming, and extended-reality services require stable throughput, low latency, and low jitter at the application level. Network metrics alone do not always show whether a subscriber receives the expected quality for these services. The QoE analytics for the telecom operators market helps operators connect network conditions with the service behavior seen by an end user. MedUX reported material differences in 5G user experience across 15 major European cities during the first quarter of 2025. The findings showed that advertised coverage and application-layer performance can differ even where 5G coverage is extensive. Nokia’s Deepfield Cloud Intelligence provides visibility into encrypted and over-the-top traffic at a large scale without physical probes, which allows operators to monitor services they do not control directly.
Restraints Impact Analysis of QoE Analytics For Telecom Operators Market*
| Restraint | (~) % Impact on CAGR Forecast | Geographic Relevance | Impact Timeline |
|---|---|---|---|
| Subscriber Data Privacy and Data-Residency Constraints | -0.9% | Europe, Middle East, Southeast Asia, and Africa | Medium term (2-4 years) |
| OSS, BSS, and Multivendor Integration Complexity | -0.6% | Global, especially Europe, South America, and Southeast Asia | Medium term (2-4 years) |
| Inconsistent QoE Labels Across Devices and Applications | -0.4% | Global, especially Asia-Pacific and Africa | Long term (≥ 4 years) |
| Resistance to Automated Decisions Without Explainability | -0.3% | Global, especially Europe and North America | Long term (≥ 4 years) |
| Source: Mordor Intelligence | |||
Subscriber Data Privacy and Data-Residency Constraints
Subscriber-level QoE platforms use information that can include device location, application use, session records, and behavior linked to SIM identities. Europe’s General Data Protection Regulation and similar rules in Southeast Asia and the Middle East restrict where this information can be processed and stored. The QoE analytics for telecom operators market must therefore support architectures that keep identifiable data within an operator’s required territory. 3GPP network data analytics specifications require subscriber-level data aggregation in the 5G core, which can create practical tension with cross-border data restrictions. Operators in regulated markets may choose on-premises or hybrid designs, increasing their capital needs and integration work. AWS documented an edge architecture in 2026 that processes and redacts subscriber identifiers before cloud inference workloads receive data.
High Integration Complexity Across OSS, BSS, and Multivendor Networks
QoE platforms must combine radio, core, transport, customer, service, and commercial data that often sit in separate systems. These systems can have proprietary interfaces and inconsistent key performance indicator definitions because they were deployed over many years. The QoE analytics for the telecom operators market consequently depends on connectors, normalized data models, and interoperable workflows. GSMA Intelligence identified gaps in process automation and data correlation as significant barriers to agentic AI deployment in service assurance. The burden is higher for converged operators because a single customer event may require data from fixed broadband, home equipment, mobile radio systems, and billing platforms. RADCOM introduced its Analytics Designer Module in June 2026 to let analysts configure datasets, KPIs, and alarms without a vendor engagement or software release cycle.
*Our forecasts treat driver/restraint impacts as directional, not additive. The impact forecasts reflect baseline growth, mix effects, and variable interactions.
QoE Analytics For Telecom Operators Market Segment Analysis
By Component:
Software Platforms Are Reshaping ProcurementSoftware accounted for 72.13% of the QoE analytics for telecom operators' market share in 2025, reflecting the move from hardware probes toward platforms that process network traffic in software. Software can examine encrypted and unencrypted traffic while connecting performance information with experience indicators. Customer experience management, predictive analytics, and prescriptive analytics are receiving greater attention as operators move beyond historical network reports. Predictive and prescriptive analytics within software is projected to expand at a 9.16% CAGR through 2031. The QoE analytics for the telecom operators market size for software is supported by platforms that can recommend a corrective action before service degradation reaches a subscriber. This function gives operators a way to focus engineering attention on likely experience failures rather than every network event.
Services retain a complementary role because many deployments require integration, ongoing support, and operational expertise. Managed services are relevant for operators that need the platform’s capabilities but do not intend to create a large internal analytics team. The QoE analytics for the telecom operators industry is also moving toward ready-to-use applications that reduce the need for bespoke model development. Nokia’s Experience Prescriptions provides cloud-native applications that combine anomaly detection and root-cause analysis within one subscriber experience workflow. ITU-T Recommendation M.3389 provides a recognized baseline for AI-based customer experience management, which can favor software platforms over custom-built tools. Procurement decisions increasingly turn on whether software can work across the full network estate and meet applicable governance requirements.


By Deployment Mode:
Cloud Architecture Advances Alongside Sovereignty RequirementsCloud deployment is projected to expand at a 9.22% CAGR through 2031 as operators seek flexible capacity for 5G standalone telemetry. Traffic volumes can change sharply during congestion or major events, making permanent infrastructure capacity less efficient for some workloads. The QoE analytics for the telecom operators market supports cloud designs that use consumption-based pricing and can scale without a large upfront commitment. Cloud delivery can also shorten access to analytical tools where a provider manages platform upgrades centrally. Its value depends on whether an operator can use cloud resources without compromising data-residency requirements.
Hybrid deployment remains important where subscriber-identifiable data must stay on premises, while anonymized data and inference workloads can use cloud resources. On-premises deployment continues to be the default for some tier-1 operators in China and the Middle East because sovereignty requirements restrict public-cloud processing of subscriber telemetry. Nokia expanded its Google Cloud collaboration in 2026 to provide its analytics stack as a software-as-a-service application, on Google Distributed Cloud on premises, and in hybrid configurations. Polystar’s deployment for MasOrange combined a centralized on-premises bare-metal installation with Kubernetes-based processing on Google Cloud. The QoE analytics for telecom operators market therefore does not treat hybrid delivery as a temporary arrangement. It provides a long-term way to balance privacy, performance, and operating cost across a converged network.
By Analytics Type:
Descriptive Analytics Remains the Operating BaseDescriptive analytics held 30.46% of 2025 revenue, making it the largest analytics type in the QoE analytics for telecom operators market. Historical key performance indicator dashboards and network experience reports remain necessary for regulatory filings, service-level reporting, and internal reviews. Operators use these records to establish what happened before they move into a predictive or prescriptive workflow. Descriptive tools also provide the baseline data that automated systems require for validation. This installed operating practice explains why historical reporting continues to have value even as AI capabilities become more common.
Predictive and prescriptive functions are becoming more important as service assurance teams look for earlier identification of emerging issues. GSMA Intelligence reported that customer-related analytics and closed-loop automation are the fastest-growing AI deployment areas in telecom service assurance. Diagnostic analytics remains useful when a degraded experience needs to be traced through a multivendor network and across several domains. The QoE analytics for the telecom operators industry must connect these functions rather than treat them as separate products. 3GPP network data analytics requirements influence how diagnostic and predictive capabilities fit within the 5G core. Large language model approaches may support explainable diagnosis, but established operational controls remain essential for operator adoption.

By Application:
Network Performance Management Anchors DemandNetwork performance management accounted for 24.53% of revenue in 2025 and is expected to expand at a 9.33% CAGR through 2031. This application requires continuous validation across radio access, transport, and core networks as operators introduce 5G standalone functions. The QoE analytics for the telecom operators market supports a broader view than point monitoring tools because performance events can affect several network domains at once. Automated root-cause analysis can identify affected cells, correlate subscriber complaints, and present resolution recommendations. These capabilities can help teams reduce the time spent moving from an alarm to a verified service issue.
Service quality monitoring and customer experience management form another major application group. They translate technical signals into experience scores that can inform customer care, pricing, and retention activity. Recent Scientific Reports research showed that AI churn models using QoE indicators delivered strong predictive performance. Churn prediction and retention management are therefore closely tied to the same data sources used for performance management. Network investment and capacity planning also use QoE data to prioritize locations with weaker experience relative to subscriber density and revenue contribution. TM Forum’s Open Digital Architecture provides interoperability guidance between QoE outputs and broader OSS and BSS systems.
By Operator Type:
MNOs Lead Because 5G Radio Networks Create High Analytical DemandMobile network operators held 58.76% of 2025 revenue, the highest share among operator types. The QoE analytics for telecom operators market is especially relevant to MNOs because 5G radio networks create high volumes of dynamic subscriber and session data. Spectrum limits, traffic-management choices, and competitive service positioning require visibility at subscriber and session levels. MNOs can use QoE data to identify service degradation that conventional passive monitoring may not show at 5G standalone scale. This creates a direct operational reason for MNOs to invest in continuous experience monitoring.
Converged operators are a growing customer group because they must connect fixed and mobile experience information for the same household or business. Fixed-line operators are also increasing service-quality monitoring as fiber-to-the-premises rollouts introduce enterprise services with service-level obligations. Cable operators face a related need when fiber competition creates a higher risk of customers leaving after sustained service problems. The QoE analytics for the telecom operators market can bring these data sources into a common operating view. GSMA reported that mobile technologies generated significant economic value across Africa and represented a notable share of the regional gross domestic product. This scale is also increasing interest in standardized QoE benchmarking for MNOs operating across the region.
By Organization Size:
Large Enterprises Dominate While Smaller Operators Gain AccessLarge enterprises accounted for 88.22% of revenue in 2025 and are projected to expand at a 9.82% CAGR through 2031. Tier-1 operators have subscriber volumes and multivendor networks that can justify dedicated data collection, licensing, and platform customization. They also face material costs when a network issue takes longer to identify and resolve. The QoE analytics for the telecom operators market is consequently concentrated among operators that have complex data environments and significant retention exposure. Large enterprises can combine dedicated probes, multivendor integrations, and internal specialist teams to support a broad deployment.
Small and medium-sized operators contribute less revenue today, but cloud-managed services and consumption-based prices can reduce their entry cost. These operators may choose a provider-operated model rather than build a large internal analytics organization. NETSCOUT extended Omnis AI Insights to communications service providers in February 2026, adding tools intended to transform 5G, RAN, core, mobile edge computing, and transport telemetry into curated AI-ready data. The QoE analytics for the telecom operators market could therefore broaden as suppliers offer pre-built integration and managed data capabilities. Vendors that simplify onboarding will be better placed to serve operators with smaller engineering teams. This opportunity depends on proving that the platform can deliver useful experience information at a scale that fits a smaller operator’s budget.
Geography Analysis
North America and Europe QoE Analytics for Telecom Operators Market
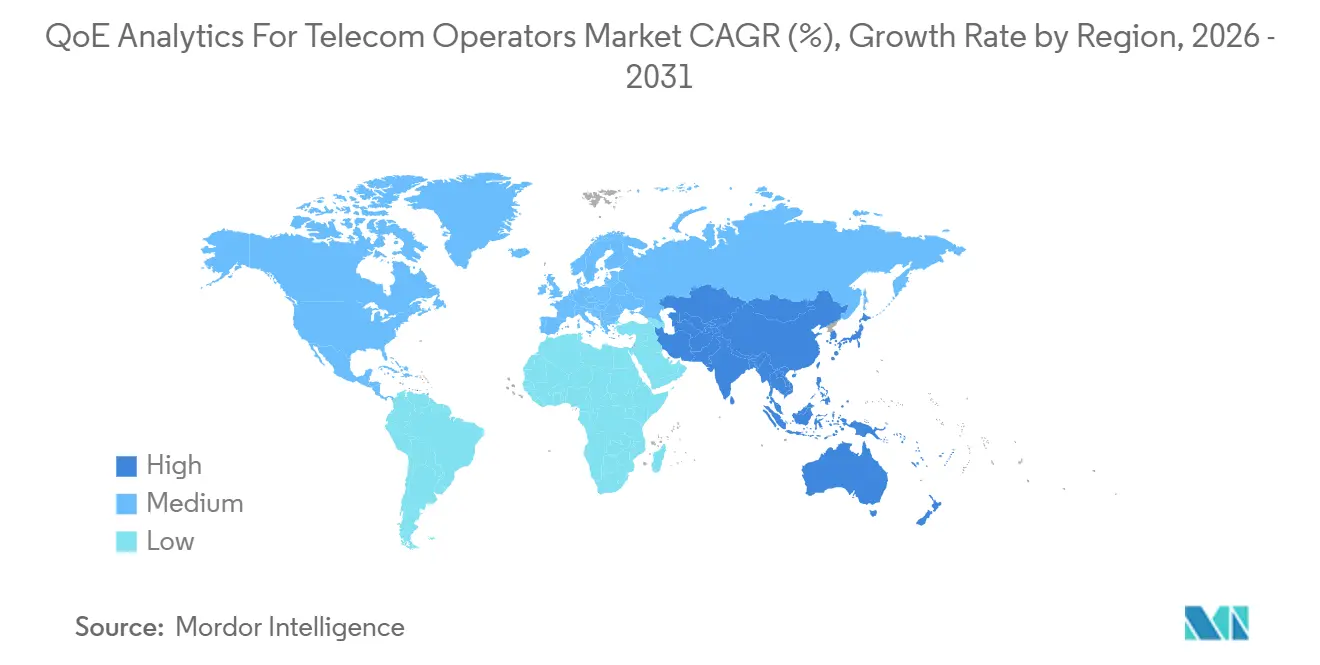
North America held 28.27% of 2025 revenue, making it the largest regional share in the QoE analytics for telecom operators market. Early 5G standalone activity, competitive national carriers, and established data-driven network practices support demand in the region. Operators were early users of cloud-native OSS designs, creating a stronger fit for platforms that connect with DevOps and AIOps workflows. Europe ranked second, with spending concentrated in the United Kingdom, Germany, France, and Nordic countries. GDPR affects both platform architecture and procurement timing, favoring suppliers that can support on-premises and hybrid models. CONNECT Europe reported that 5G coverage reached most of the European population by the end of the reporting period, while adoption accounted for a significant share of mobile connections.
Europe and APAC QoE Analytics for Telecom Operators Market
The difference between European coverage and adoption increases the need for operators to show service quality that customers can recognize. Deutsche Telekom worked with Google Cloud in February 2026 on an AI agent for autonomous RAN operations, targeting lower operating costs and improved customer experience. Asia-Pacific is another high-activity region, led by Japan, South Korea, China, and India, though each country has a different level of 5G standalone maturity. NTT Docomo deployed Nokia MantaRay AutoPilot in June 2026 as a cloud-hosted AI quality optimization system for a national commercial network. Its October 2025 CNX rollout used AI to quantify subscriber-perceived communication quality. India’s 5G subscriber expansion through Reliance Jio and Bharti Airtel is also creating demand for experience differentiation in a price-sensitive environment.
MEA and South America QoE Analytics for Telecom Operators Market
Africa is projected to expand at a 9.71% CAGR through 2031, the fastest regional rate in the QoE analytics for telecom operators market. GSMA Intelligence recorded the expansion of commercial 5G services across several African markets. It projected strong growth in 5G connections in Africa over the coming years. Egypt’s National Spectrum Strategy and Morocco’s tower expansion plan add to the near-term infrastructure pipeline. Gulf Cooperation Council operators create premium demand for slice analytics and subscriber-level monetization, while South America is at an earlier stage as operators modernize legacy OSS and BSS environments.

Competitive Landscape
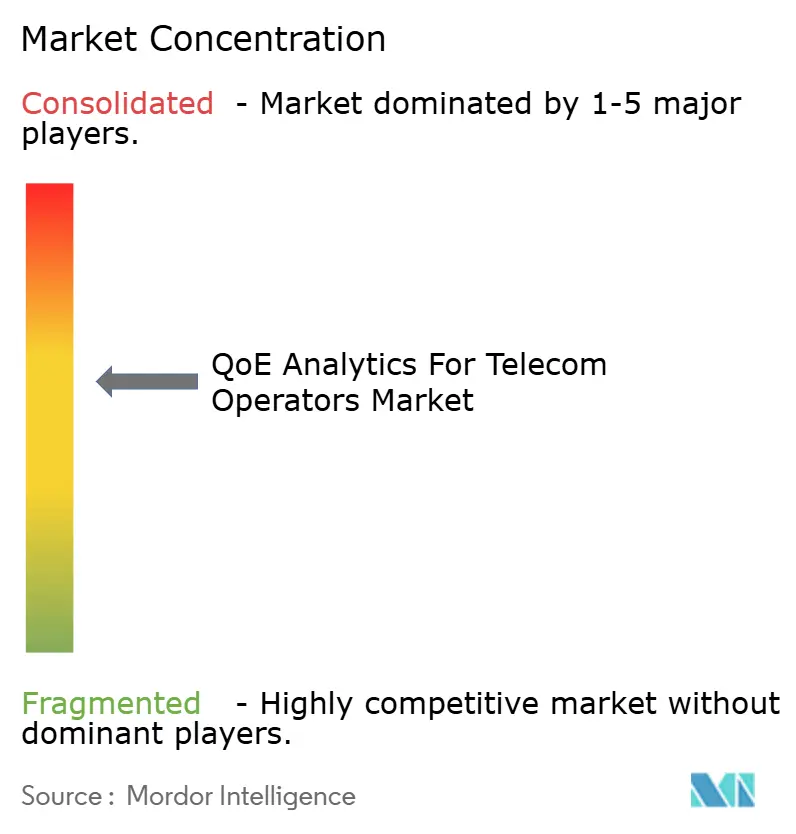
The QoE analytics for telecom operators market is moderately concentrated among upper-tier suppliers and fragmented across specialist providers. Ericsson, Nokia, Huawei, and Cisco use their established network visibility to include QoE tools in wider network-management contracts. This model can appeal to operators that already use the supplier’s radio, core, or transport systems. RADCOM, NETSCOUT, Infovista, TEOCO, and Subex compete through multivendor support, analytical depth, and AI-oriented data architectures. Their position rests on the ability to offer experience analytics without requiring an operator to use one equipment supplier across every network domain.
RADCOM launched the Analytics Designer Module in June 2026, allowing network data analysts to define, configure, and deploy custom datasets, KPIs, and alarms in real time. This type of configuration flexibility can reduce reliance on vendor release cycles and can be useful in a fast-changing operational setting. Huawei introduced AI-Native SmartCare, combining Spatio-temporal Digital Twin technology with its SRCON domain-specific large model. Huawei reported that a pilot with an Asia-Pacific operator improved the network's net promoter score, increased data usage per user, and reduced network-related complaints. Vendors increasingly need to connect their platforms to measurable service and commercial outcomes instead of presenting analytics only as a technical reporting tool.
Amdocs introduced aOS in February 2026 as an agentic operating system designed to operate across BSS and OSS stacks. Its approach places AI within end-to-end telecom operations rather than treating it as a separate analytics layer. Nokia also launched Autonomous Network Fabric in 2026 and expanded its work with Google Cloud for software-as-a-service and hybrid delivery of its network and QoE assurance stack. The QoE analytics for telecom operators market rewards suppliers that can integrate their data, automation, and operating workflows with existing operator systems. No combined market share for leading suppliers is provided, so a concentration score cannot be determined under the stated scoring methodology.
QoE Analytics For Telecom Operators Industry Leaders
Telefonaktiebolaget LM Ericsson
Nokia Corporation
Cisco Systems, Inc.
Mobileum Inc.
RADCOM Ltd.
- *Disclaimer: Major Players sorted in no particular order
QoE Analytics For Telecom Operators Market Companies Covered in this Report
- Ericsson
- Nokia Corporation
- Cisco Systems, Inc.
- Mobileum Inc.
- RADCOM Ltd.
- NETSCOUT SYSTEMS, INC.
- Infovista S.A.S.
- MedUX
- Ookla, LLC
- Rohde & Schwarz GmbH & Co KG
- VIAVI Solutions Inc.
- Keysight Technologies, Inc.
- Spirent Communications plc
- EXFO Inc.
- TEOCO Corporation
- Subex Limited
- Huawei Technologies Co., Ltd.
- Samsung Electronics Co., Ltd.
- Amdocs Limited
- Oracle Corporation
- Broadcom Inc.
- ZTE Corporation
- Sandvine Corporation

Recent Industry Developments in QoE Analytics For Telecom Operators Market
- June 2026: RADCOM launched the Analytics Designer Module, enabling network data analysts to define, configure, and deploy custom datasets and KPIs in real time without vendor engagement, reducing analytics change cycles from months to the same day. The module is targeted for general availability to RADCOM ACE customers in Q3 2026.
- June 2026: NTT Docomo deployed Nokia's MantaRay AutoPilot on a public cloud, Japan's first AI-driven automated RAN quality optimization deployment and the world's first cloud-hosted implementation. The deployment achieved closed-loop control at 15-minute intervals instead of the prior daily cycle and supports NTT Docomo's target of TM Forum Autonomous Network Level 4.
- June 2026: Nokia unveiled an upgraded Autonomous Networks Agent Library and enhanced agentic AI capabilities at DTW26 in Copenhagen, including WaveSuite, an agentic framework for optical network operations that provides proactive KPI anomaly detection before service performance is affected.
- February 2026: RADCOM launched Neura, an AI agent suite integrating Customer Experience, Service Quality, and Network Optimization agents on the RADCOM ACE platform through Model Context Protocol, designed to transform service assurance into autonomous, intent-driven network operations.


Global QoE Analytics For Telecom Operators Market Report Scope
QoE Analytics for Telecom Operators Market refers to software platforms and services that measure, monitor, and optimize subscribers’ perceived experience across mobile, fixed, broadband, and digital telecom services. These solutions correlate network performance, application behavior, traffic flows, device data, and customer interactions to evaluate end-user satisfaction and service quality.
The QoE Analytics for Telecom Operators Market Report is Segmented by Component (Software, and Services), Deployment Mode (Cloud, On-Premises, and Hybrid), Analytics Type (Descriptive Analytics, Diagnostic Analytics, Predictive Analytics, and Prescriptive Analytics), Application (Network Performance Management, Service Quality Monitoring, Customer Experience Management, Churn Prediction and Retention Management, Root-Cause Analysis and Anomaly Detection, and Network Investment and Capacity Planning), Operator Type (Mobile Network Operators, Fixed-Line Operators, Converged Operators, Cable Operators, and Other Operator Types), Organization Size (Large Enterprise, Small and Medium-Sized Operators), and Geography (North America, South America, Europe, Asia-Pacific, Middle East, and Africa). The Market Forecasts are Provided in Terms of Value (USD).
| Software | Network Analytics |
| Performance Monitoring Tools | |
| Customer Experience Management | |
| Predictive and Prescriptive Analytics | |
| Other Softwares | |
| Services | Professional Services |
| Managed Services | |
| Support and Maintenance Services |
| Cloud |
| On-Premises |
| Hybrid |
| Descriptive Analytics |
| Diagnostic Analytics |
| Predictive Analytics |
| Prescriptive Analytics |
| Other Analytics Types |
| Network Performance Management |
| Service Quality Monitoring |
| Customer Experience Management |
| Churn Prediction and Retention Management |
| Root-Cause Analysis and Anomaly Detection |
| Network Investment and Capacity Planning |
| Other Applications |
| Mobile Network Operators |
| Fixed-Line Operators |
| Converged Operators |
| Cable Operators |
| Other Operator Types |
| Large Enterprise |
| Small and Medium-Sized Operators |
| North America | United States |
| Canada | |
| Mexico | |
| South America | Brazil |
| Argentina | |
| Colombia | |
| Chile | |
| Rest of South America | |
| Europe | United Kingdom |
| Germany | |
| France | |
| Italy | |
| Spain | |
| Russia | |
| Rest of Europe | |
| Asia-Pacific | China |
| Japan | |
| India | |
| South Korea | |
| Australia | |
| Southeast Asia | |
| Rest of Asia-Pacific | |
| Middle East | Saudi Arabia |
| United Arab Emirates | |
| Qatar | |
| Israel | |
| Turkey | |
| Rest of Middle East | |
| Africa | South Africa |
| Egypt | |
| Nigeria | |
| Morocco | |
| Rest of Africa |
| By Component | Software | Network Analytics |
| Performance Monitoring Tools | ||
| Customer Experience Management | ||
| Predictive and Prescriptive Analytics | ||
| Other Softwares | ||
| Services | Professional Services | |
| Managed Services | ||
| Support and Maintenance Services | ||
| By Deployment Mode | Cloud | |
| On-Premises | ||
| Hybrid | ||
| By Analytics Type | Descriptive Analytics | |
| Diagnostic Analytics | ||
| Predictive Analytics | ||
| Prescriptive Analytics | ||
| Other Analytics Types | ||
| By Application | Network Performance Management | |
| Service Quality Monitoring | ||
| Customer Experience Management | ||
| Churn Prediction and Retention Management | ||
| Root-Cause Analysis and Anomaly Detection | ||
| Network Investment and Capacity Planning | ||
| Other Applications | ||
| By Operator Type | Mobile Network Operators | |
| Fixed-Line Operators | ||
| Converged Operators | ||
| Cable Operators | ||
| Other Operator Types | ||
| By Organization Size | Large Enterprise | |
| Small and Medium-Sized Operators | ||
| By Geography | North America | United States |
| Canada | ||
| Mexico | ||
| South America | Brazil | |
| Argentina | ||
| Colombia | ||
| Chile | ||
| Rest of South America | ||
| Europe | United Kingdom | |
| Germany | ||
| France | ||
| Italy | ||
| Spain | ||
| Russia | ||
| Rest of Europe | ||
| Asia-Pacific | China | |
| Japan | ||
| India | ||
| South Korea | ||
| Australia | ||
| Southeast Asia | ||
| Rest of Asia-Pacific | ||
| Middle East | Saudi Arabia | |
| United Arab Emirates | ||
| Qatar | ||
| Israel | ||
| Turkey | ||
| Rest of Middle East | ||
| Africa | South Africa | |
| Egypt | ||
| Nigeria | ||
| Morocco | ||
| Rest of Africa | ||


Key Questions Answered in the Report
What is the size of the QoE analytics for telecom operators market?
The QoE analytics for telecom operators market was valued at USD 2.89 billion in 2026 and is estimated to reach USD 4.434 billion by 2031 at an 8.96% CAGR.
Why are telecom operators using QoE analytics platforms?
Operators use these platforms to connect network data with subscriber experience, support churn reduction, and automate service assurance actions.
Which component leads QoE analytics spending for telecom operators?
Software led with 72.13% of 2025 revenue because operators are replacing isolated monitoring tools with unified analytics platforms.
Which application has the strongest projected expansion through 2031?
Network performance management is projected to expand at a 9.33% CAGR through 2031 as 5G standalone networks require continuous cross-domain validation.
What deployment approach is most relevant where subscriber data must remain local?
Hybrid deployment keeps identifiable data on premises while allowing anonymized data and AI workloads to use cloud resources.
Which region is expected to expand most quickly through 2031?
Africa is projected to expand at a 9.71% CAGR through 2031, supported by 5G commercialization across 61 operators in 37 markets as of May 2026.
Page last updated on:





