Market Overview
| Study Period | 2020 - 2031 |
|---|---|
| Forecast Data Period | 2026 - 2031 |
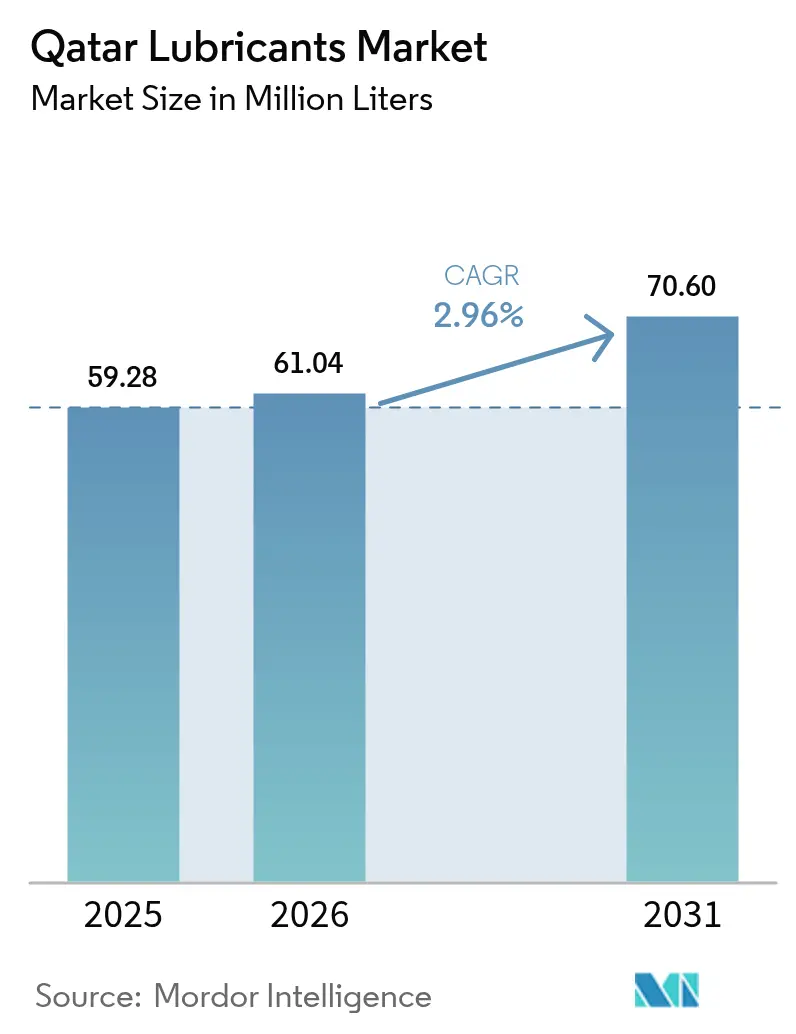
| Base Year Market Size (2025) | 59.28 Million Liters |
| Market Volume (2026) | 61.04 Million Liters |
| Market Volume (2031) | 70.6 Million Liters |
| Growth Rate (2026 - 2031) | 2.96% CAGR |
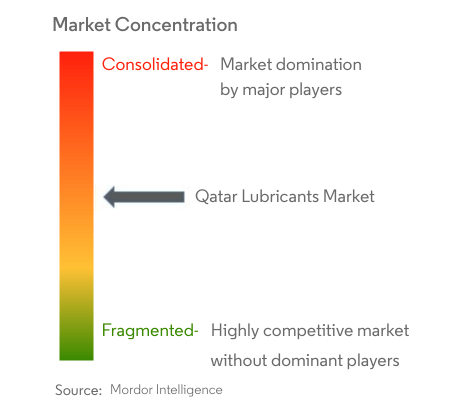
| Market Concentration | High |
Major Players *Disclaimer: Major Players sorted in no particular order Image © Mordor Intelligence. Reuse requires attribution under CC BY 4.0. | |
Qatar Lubricants Market Analysis by Mordor Intelligence
Qatar Lubricants Market size in 2026 is estimated at 61.04 million liters, growing from 2025 value of 59.28 million liters with 2031 projections showing 70.6 million liters, growing at 2.96% CAGR over 2026-2031.
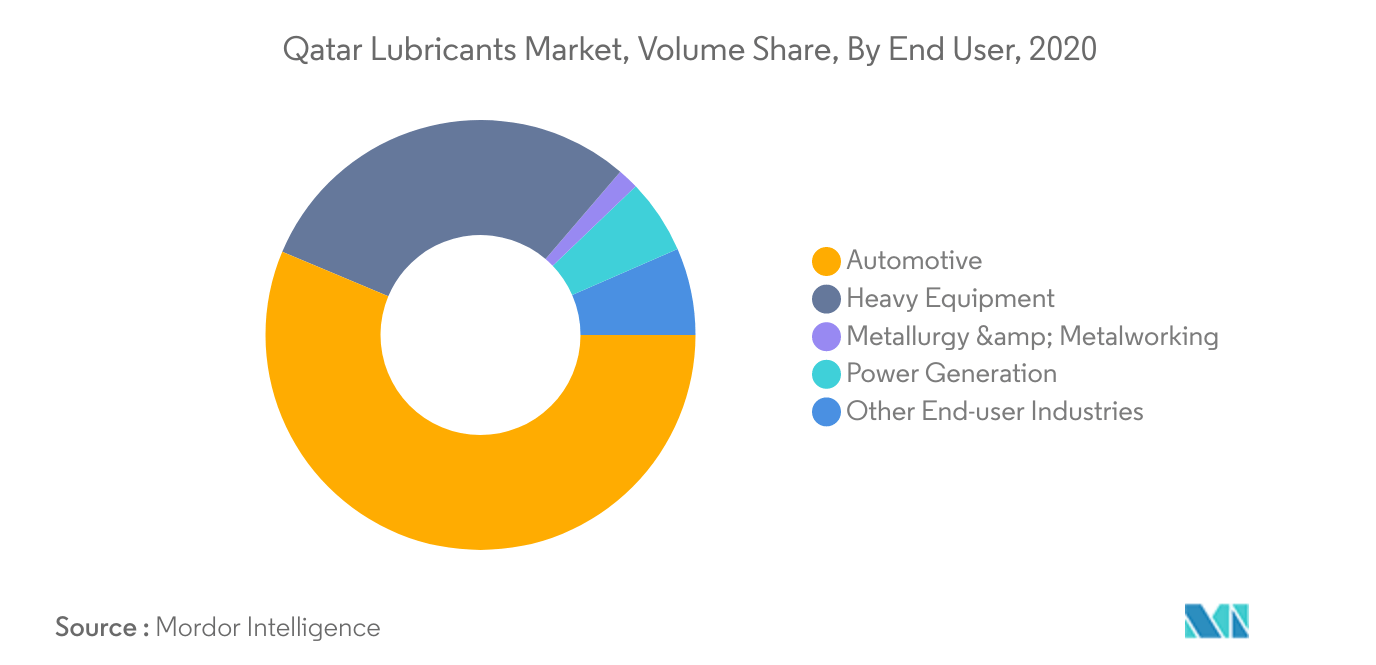
- Largest Segment by End-user Industry - Automotive : Automotive was the largest end-user segment in the UAE due to the large presence of high-end vehicles and SUVs and higher oil replacement cycles compared to other segments.
- Fastest Segment by End-user Industry - Power Generation : Due to the increasing use of natural gas reactors and wind turbines for energy generation, power generation is projected to be the fastest-growing end user in Qatar.
- Largest Segment by Product Type - Engine Oils : Engine oil is the most consumed product type in Qatar due to the high volume of engine oil and high replacement frequencies required to lubricate car and truck engines.
- Fastest Segment by Product Type - Greases : Grease is required for the smooth operation of industrial machinery, and with the country's manufacturing industry growing, grease consumption is likely to rise even faster.
Note: Market size and forecast figures in this report are generated using Mordor Intelligence’s proprietary estimation framework, updated with the latest available data and insights as of 2026.
Qatar Lubricants Market Trends and Insights
Largest Segment By End User : <span style="font-family: 'regular_bold';color:#0e7db3;">Automotive</span>
- In 2020, the Qatar Lubricants Market was dominated by the automotive industry, which accounted for around 56% of the total lubricant consumption in the country. During 2015-2019, lubricant consumption in the automotive industry increased by around 11.8%.
- In 2020, COVID-19-related restrictions led to declined maintenance requirements from several industries. The major impact was observed in the metallurgy and metalworking sectors, which recorded a dip of 16.9%, followed by heavy equipment (7.9%) during the year.
- Power generation is likely to be the fastest-growing end-user industry of the market studied, with a CAGR of 5.35% over the period 2021-2026, followed by automotive (2.89%). The growing capacity addition of power generation in the country is likely to drive the consumption of Qatar Lubricants Market in the power generation industry.


Competitive Landscape
The Qatar Lubricants Market is moderately consolidated, with the top five companies occupying 54.11%. The major players in this market are ExxonMobil Corporation, Qatar Lubricants Company (QALCO), Royal Dutch Shell PLC, TotalEnergies and Valvoline Inc. (sorted alphabetically).
Qatar Lubricants Industry Leaders
ExxonMobil Corporation
Qatar Lubricants Company (QALCO)
Royal Dutch Shell PLC
TotalEnergies
Valvoline Inc.
- *Disclaimer: Major Players sorted in no particular order

Recent Industry Developments
- May 2022: TotalEnergies, NEXUS Automotive Extend Strategic Partnership for a period of five years. As part of this partnership, TotalEnergies Lubricants will be expanding its presence in the burgeoning N! community, which has seen rapid growth in sales from EUR 7.2 billion in 2015 to nearly EUR 35 billion by the end of 2021.
- March 2022: ExxonMobil Corporation company has appointed Jay Hooley as lead managing director of the company.
- January 2022: Effective April 1, ExxonMobil Corporation was organized along three business lines - ExxonMobil Upstream Company, ExxonMobil Product Solutions and ExxonMobil Low Carbon Solutions.


Qatar Lubricants Market Report Scope
By End User
| Automotive |
| Heavy Equipment |
| Metallurgy & Metalworking |
| Power Generation |
| Other End-user Industries |
By Product Type
| Engine Oils |
| Greases |
| Hydraulic Fluids |
| Metalworking Fluids |
| Transmission & Gear Oils |
| Other Product Types |
| By End User | Automotive |
| Heavy Equipment | |
| Metallurgy & Metalworking | |
| Power Generation | |
| Other End-user Industries | |
| By Product Type | Engine Oils |
| Greases | |
| Hydraulic Fluids | |
| Metalworking Fluids | |
| Transmission & Gear Oils | |
| Other Product Types |


Key Questions Answered in the Report
How big is the Qatar Lubricants Market?
The Qatar Lubricants Market size is expected to reach 61.04 million Liters in 2026 and grow at a CAGR of 2.96% to reach 70.6 million Liters by 2031.
What is the current Qatar Lubricants Market size?
In 2026, the Qatar Lubricants Market size is expected to reach 61.04 million Liters.
Who are the key players in Qatar Lubricants Market?
ExxonMobil Corporation, Qatar Lubricants Company (QALCO), Royal Dutch Shell PLC, TotalEnergies and Valvoline Inc. are the major companies operating in the Qatar Lubricants Market.
What years does this Qatar Lubricants Market cover, and what was the market size in 2025?
In 2025, the Qatar Lubricants Market size was estimated at 59.28 million Liters. The report covers the Qatar Lubricants Market historical market size for years: 2020, 2021, 2022, 2023, 2024 and 2025. The report also forecasts the Qatar Lubricants Market size for years: 2026, 2027, 2028, 2029, 2030 and 2031.
Page last updated on:


