
Proton Exchange Membrane (PEM) Electrolyzer Market Size and Share
Market Overview
| Study Period | 2022 - 2032 |
|---|---|
| Market Size (2027) | USD 2.60 Billion |
| Market Size (2032) | USD 9.11 Billion |
| Growth Rate (2027 - 2032) | 28.45 % |
| Fastest Growing Market | Asia-Pacific |
| Largest Market | Europe |
| Market Concentration | Medium |
Major Players *Disclaimer: Major Players sorted in no particular order Image © Mordor Intelligence. Reuse requires attribution under CC BY 4.0. | |
Proton Exchange Membrane (PEM) Electrolyzer Market Analysis by Mordor Intelligence
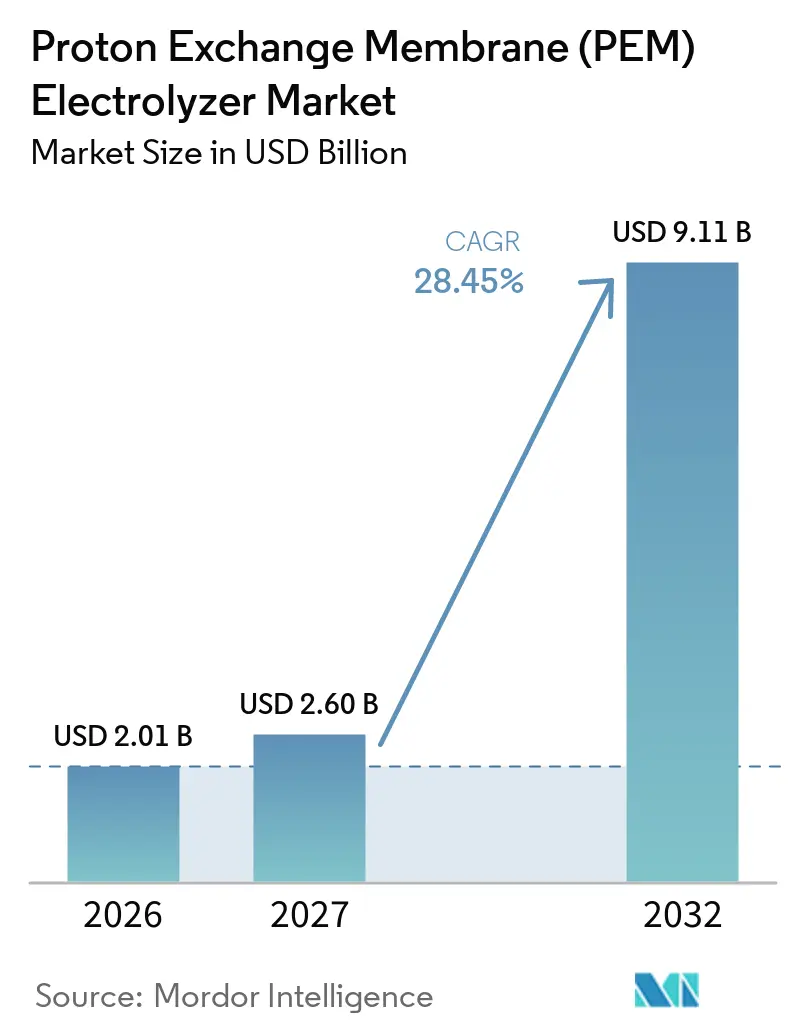
The Proton Exchange Membrane Electrolyzer Market size is expected to grow from USD 2.01 billion in 2026 to USD 2.60 billion in 2027 and is forecast to reach USD 9.11 billion by 2032 at 28.45% CAGR over 2027-2032. Industrial decarbonization is increasing demand for renewable hydrogen in steel, chemicals, refining, and other energy-intensive operations. PEM systems are suited to variable renewable power because they can respond quickly and operate across a broad load range. Installed water-electrolysis capacity exceeded 3 GW by mid-2025, showing that deployment has moved beyond early pilots.[1] Policy support, local manufacturing programs, and long-term industrial offtake are shaping procurement decisions in the Proton Exchange Membrane (PEM) Electrolyzer Market. The opportunity is strongest where renewable generation, industrial demand, grid access, and permitting can be coordinated within the same project.
Key Report Takeaways
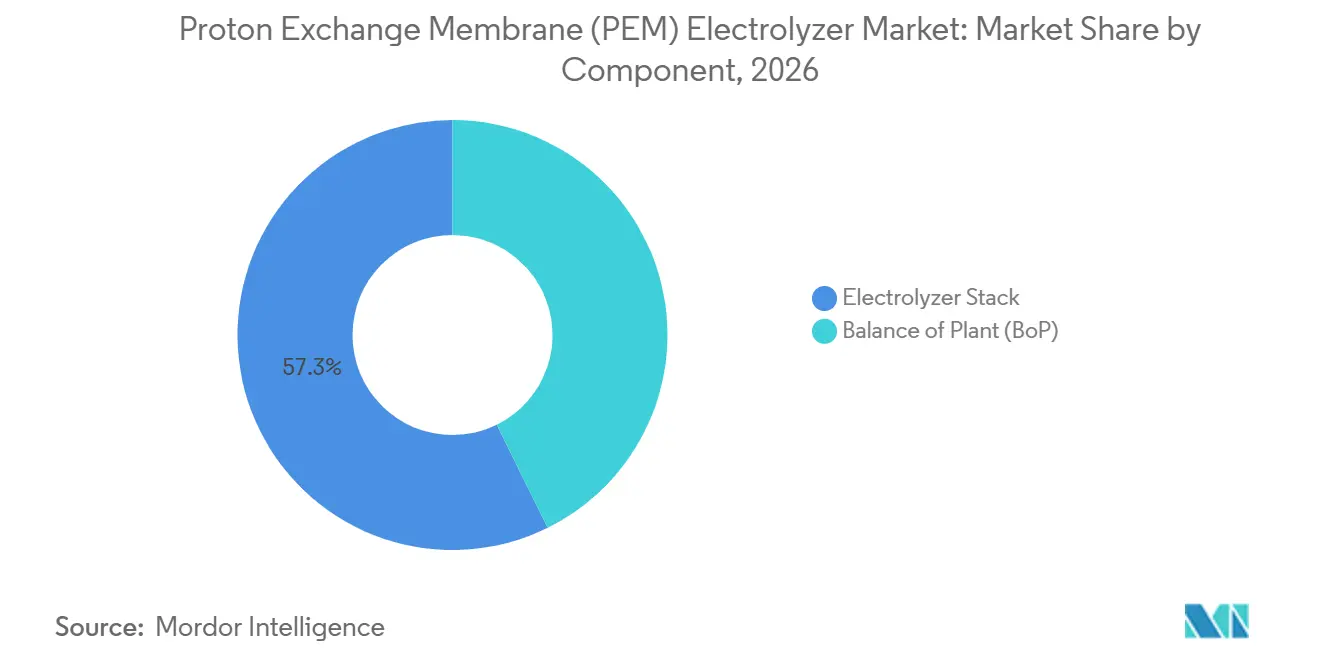
- By component, Electrolyzer Stack held 57.3% of the Proton Exchange Membrane (PEM) Electrolyzer Market share in 2026, while Balance of Plant is forecast to expand at a 28.9% CAGR through 2032.
- By capacity, Above 2 MW accounted for 49.7% of the Proton Exchange Membrane (PEM) Electrolyzer Market size in 2026 and is projected to grow at a 29.4% CAGR through 2032.
- By end user, Hydrogen Producers held 31.2% of the Proton Exchange Membrane (PEM) Electrolyzer Market share in 2026, while Steel and Metals Manufacturers recorded the highest projected CAGR at 30.6% through 2032.
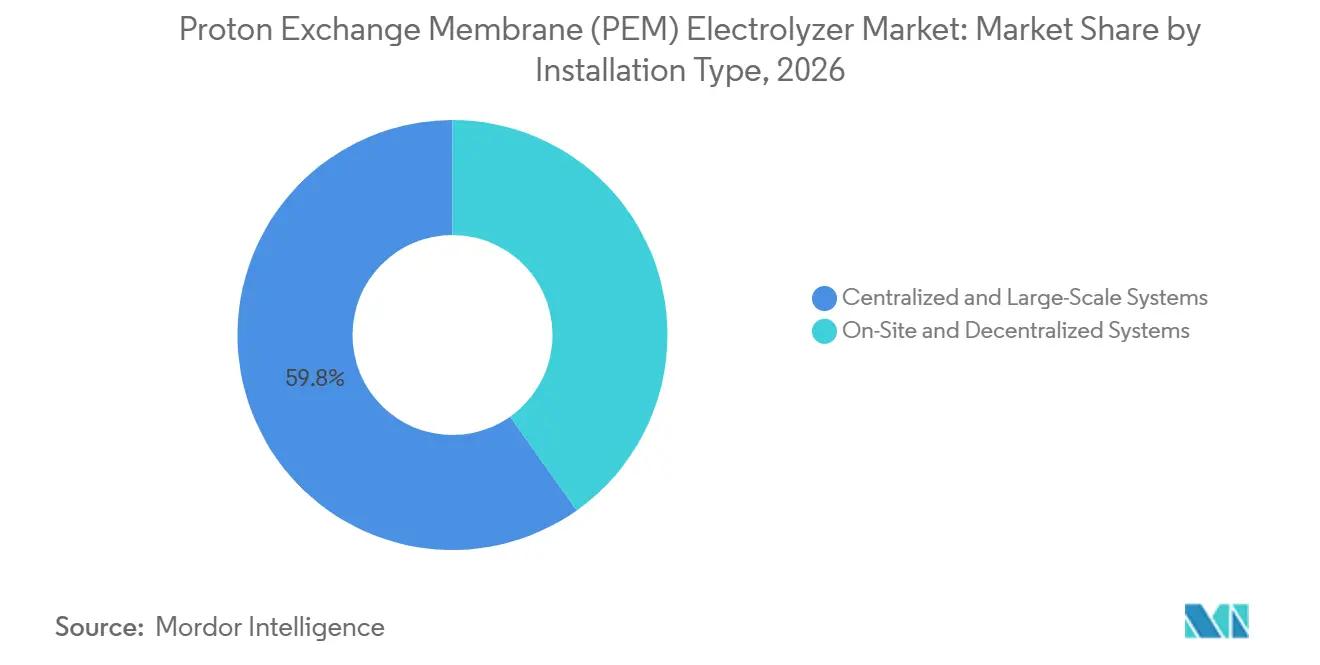
- By installation type, Centralized and Large-Scale Systems accounted for 59.8% of the Proton Exchange Membrane (PEM) Electrolyzer Market size in 2026 and are advancing at a 31.2% CAGR through 2032.
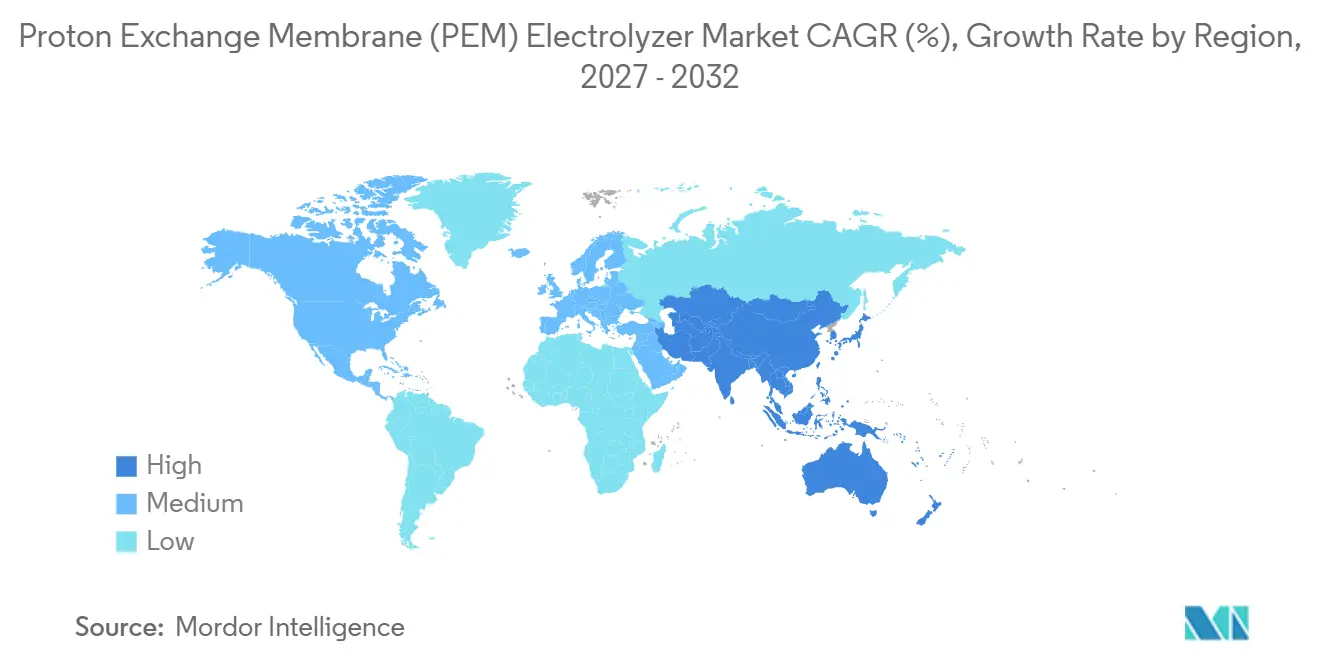
- By geography, Europe held 39.5% revenue share in 2026, while Asia-Pacific is forecast to expand at a 30.3% CAGR through 2032.
Note: Market numbers in this report are based on Mordor Intelligence's proprietary estimation framework, which combines nine months of actuals with Q4 projections for base year 2026.
Market Trends and Insights
Drivers Impact Analysis of Proton Exchange Membrane (PEM) Electrolyzer Market*
| Driver | (~) % Impact on CAGR Forecast | Geographic Relevance | Impact Timeline |
|---|---|---|---|
| Renewable Hydrogen Deployment for Industrial Decarbonization | +8.5% | Global, highest in EU, Japan, and India | Long term (≥ 4 years) |
| Integration With Intermittent Renewable Power | +5.8% | Europe, North America, China, and Australia | Medium term (2-4 years) |
| Hydrogen Refueling and Distributed Production Expansion | +3.2% | Europe, South Korea, Japan, and North America | Short term (≤ 2 years) |
| Government Hydrogen Incentives and Domestic Manufacturing Mandates | +5% | Global, EU, US, India, and South Korea | Medium term (2-4 years) |
| Falling Catalyst Loadings and Stack Cost Reduction | +3.8% | Global, with R&D activity in EU and US | Long term (≥ 4 years) |
| Large-Scale Industrial Hydrogen Offtake Commitments | +3.5% | EU, Middle East, and North America | Medium term (2-4 years) |
| Source: Mordor Intelligence | |||
Renewable Hydrogen Deployment for Industrial Decarbonization
Hard-to-abate industries are making renewable hydrogen procurement more relevant to the Proton Exchange Membrane (PEM) Electrolyzer Market. The OECD estimated that hydrogen-based direct reduced iron could cut steelmaking emissions by up to 90% compared with the blast furnace and basic oxygen furnace route.[2] Only 9.2% of the 164 million metric tons of direct reduced iron capacity planned through 2030 was hydrogen-based, leaving substantial room for conversion as carbon policy and project economics develop. OECD Voestalpine expanded the H2FUTURE facility in Linz in 2025 with compression and purification equipment, and testing of the upgraded system began in early 2026.[3] A 2025 study found that combining PEM electrolysis with electric arc furnaces could lower cumulative emissions by up to 71% in wind-rich Indiana scenarios by 2050.[4]
Integration With Intermittent Renewable Power
PEM electrolyzers can operate over a 5% to 120% power range with sub-second response, which supports their use alongside changing wind and solar output. A 2025 review found that fast-frequency-response operation from PEM systems could reduce grid frequency deviations by up to 50%. The same review linked this advantage at partial load to transistor-based power electronics that are not used in alkaline systems. Polish grid data cited in the review recorded 44 GWh of solar curtailment in 1 month during 2024, showing the value of flexible demand near renewable assets. The Joint Research Centre reported that large European projects faced costs of EUR 2,630 per kW to EUR 3,050 per kW, partly because grid connection costs were underestimated. This makes direct integration with renewable assets a durable cost advantage for the Proton Exchange Membrane (PEM) Electrolyzer Market.
Government Hydrogen Incentives and Domestic Manufacturing Mandates
Government programs are moving beyond general subsidies toward certification rules, domestic-content requirements, and competitive auctions. In March 2025, the European Commission approved EUR 400 million for Austria and EUR 36 million for Lithuania under the Hydrogen Bank Auctions-as-a-Service mechanism. Both schemes require compliance with the European Union rules for renewable fuels of non-biological origin. India allocated 862,000 tons of annual green hydrogen production capacity to 19 companies and 3,000 MW per year of electrolyzer manufacturing capacity in May 2025. The U.S. Department of Energy set a 2026 capital-cost target of USD 100 per kW for PEM stacks, compared with USD 450 per kW in 2022, while also targeting lower platinum-group-metal loading. These measures provide a clearer demand base for suppliers in the Proton Exchange Membrane (PEM) Electrolyzer Market.
Large-Scale Industrial Hydrogen Offtake Commitments
Long-term industrial contracts are becoming important foundations for projects above 10 MW. Accelera announced in February 2025 that it would supply a 100 MW PEM system for bp’s Lingen refinery, using 20 HyLYZER-1000 units. The plant is designed to produce 11,000 tons of green hydrogen per year when it enters service in 2027. Projects that have reached final investment decision represented 9% of the announced low-emissions hydrogen pipeline through 2030. The International Energy Agency also reported that almost 45% of announced low-emissions hydrogen projects target export, although export-oriented projects are less likely to reach final investment decision. Near-term demand therefore favors industrial clusters with domestic buyers and secure offtake arrangements.
Restraints Impact Analysis of Proton Exchange Membrane (PEM) Electrolyzer Market*
| Restraint | (~) % Impact on CAGR Forecast | Geographic Relevance | Impact Timeline |
|---|---|---|---|
| High Iridium and Platinum Supply Concentration | -0.9% | Global, sourcing concentrated in South Africa, Russia, and Zimbabwe | Long term (≥ 4 years) |
| High Installed System Cost and Hydrogen Price Gap | -0.8% | Global, most acute outside subsidy-backed markets | Medium term (2-4 years) |
| Limited Hydrogen Pipelines, Storage, and Refueling Infrastructure | -0.6% | Eastern Europe, North America, and South America | Long term (≥ 4 years) |
| Underutilized Manufacturing Capacity and Delayed Project Final Investment Decisions (FIDs) | -0.4% | Global, acute in EU and US, with structural overcapacity in China | Short term (≤ 2 years) |
| Source: Mordor Intelligence | |||
High Iridium and Platinum Supply Concentration
Iridium supply remains a material constraint because the metal is produced as a by-product of platinum mining. South Africa, Russia, and Zimbabwe control more than 90% of platinum group metal mining, concentrating supply risk across the Proton Exchange Membrane (PEM) Electrolyzer Market. A 2025 study measured an iridium Herfindahl-Hirschman Index of 3,906, indicating a highly concentrated supply base. The study also identified South Africa’s aging power grid as a possible disruption pathway in addition to geopolitical exposure. Research published in 2025 demonstrated an 80% reduction in anode catalyst cost through a 95% decrease in iridium loading. These advances are important, but broad commercial deployment will take time and near-term projects remain exposed to price changes.
High Installed System Cost and Hydrogen Price Gap
PEM systems outside China cost USD 2,000 per kW to USD 2,600 per kW to install and can produce green hydrogen at more than USD 3 per kg. This remains USD 1 per kg to USD 2 per kg above gray hydrogen in regions with low natural-gas prices. The Joint Research Centre found that projects above 100 MW in Europe incurred actual capital costs of EUR 2,630 per kW to EUR 3,050 per kW. The UK Government reported that renewable electricity accounts for 70% of the green hydrogen production cost. Equipment costs are therefore only one part of the cost challenge, and electricity prices, engineering costs, and carbon penalties also determine project viability.
*Our forecasts treat driver/restraint impacts as directional, not additive. The impact forecasts reflect baseline growth, mix effects, and variable interactions.
Proton Exchange Membrane (PEM) Electrolyzer Market Segment Analysis
By Component:
Stack Leads, but BoP Value Is RisingThe Electrolyzer Stack held 57.3% of the Proton Exchange Membrane (PEM) Electrolyzer Market size in 2026 because it contains the core electrochemical equipment and a large share of the technology value. Balance of Plant is forecast to grow at a 28.9% CAGR from 2027 to 2032. The category includes power electronics, water purification, compression, thermal management, and other systems needed to operate the stack. Its faster growth reflects the greater engineering complexity of larger installations. The stack remains central to performance, durability, and intellectual property. Suppliers with proven stack manufacturing capability therefore retain an important position in project selection.
The cost mix changes as projects move above 100 MW. The International Energy Agency reported that Balance of Plant can account for more than 50% of total system investment at this scale. The Joint Research Centre attributed several European project overruns mainly to integration work rather than stack supply. This shifts attention toward system design, site engineering, and factory testing. Nel’s containerized Modular Containerized (MC) platform incorporates Balance of Plant equipment in standard container footprints and supports commissioning before delivery. Standardized system packages can reduce site work and assist compliance with International Electrotechnical Commission (IEC) 62282 safety requirements. These conditions give integration specialists a growing role in the Proton Exchange Membrane (PEM) Electrolyzer Market.

By Capacity:
Gigawatt-Scale Projects Define the FrontierInstallations above 2 MW held 49.7% of the Proton Exchange Membrane (PEM) Electrolyzer Market in 2026 and are projected to grow at a 29.4% CAGR through 2032. This combination shows that commercial deployment is moving beyond demonstration-scale assets. Siemens Energy delivered the first 9 of 12 electrolyzers for Air Liquide’s 200 MW Normand’Hy project in France in September 2025. Accelera also announced its 100 MW supply agreement for bp’s Lingen project in 2025. Large systems offer scale economies in manufacturing, procurement, and site operations. They are most practical where a major industrial buyer can secure long-term electricity and hydrogen arrangements.
The 500 kW to 2 MW range continues to serve distributed industrial uses and hydrogen refueling projects. Its share is likely to be constrained by the stronger pull toward larger industrial projects. Systems below 500 kW remain relevant for mobility and research needs. Hystar supplied PEM stacks to Sunbo Unitech for the KOMIPO Shin Boryeong fuel-cell bus refueling project in South Korea. These smaller installations can establish operating experience and local demand before bigger projects are developed. The U.S. Department of Energy’s stack cost target benefits higher-capacity projects because they can spread fixed manufacturing and delivery costs over more output. Capacity selection will therefore remain tied to buyer scale, available infrastructure, and the expected utilization rate.
By End User:
Steel and Metals Emerge as the Next Demand WaveHydrogen Producers held 31.2% of the Proton Exchange Membrane (PEM) Electrolyzer Market share in 2026, supported by industrial-gas companies and dedicated hydrogen developers. These buyers serve refining and ammonia customers that already use hydrogen at scale. Steel and Metals Manufacturers are forecast to grow at a 30.6% CAGR through 2032. Their demand is linked to direct reduced iron processes and the need to lower emissions from primary steel production. A 2026 research paper identified Minnesota and Michigan as potential concentration points for electrolyzer demand in a U.S. steel transition. Demand can therefore cluster around existing steel assets rather than spread evenly across regions.
Oil and Gas Companies provide another source of high-volume demand. bp’s Lingen project shows the scale of PEM procurement that refinery operators can undertake when supported by a defined use case. Chemical and Petrochemical Companies, Power Utilities, and Renewable Energy Developers remain important middle-tier buyers. Transportation and Mobility Operators support smaller distributed systems that serve refueling networks. These installations can build demand as vehicle fleets expand. The Proton Exchange Membrane (PEM) industry will depend on whether such projects secure power, land, permitting, and offtake at the same pace. End-user requirements differ, but each group is increasingly assessing supply reliability alongside equipment performance.
By Installation Type:
Centralized Scale Versus Decentralized ResilienceCentralized and Large-Scale Systems accounted for 59.8% of the Proton Exchange Membrane (PEM) Electrolyzer Market in 2026 and are forecast to advance at a 31.2% CAGR through 2032. Large industrial buyers prefer a single source of supply when hydrogen volumes are high. Scale can also reduce costs per kW through more efficient stack manufacturing and common site infrastructure. The 280 MW EWE Clean Hydrogen Coastline project in Emden and Air Liquide’s 200 MW Normand’Hy project show that projects above 100 MW are progressing in Europe. These projects need firm power arrangements and detailed integration planning. They are most compelling in industrial clusters with large and predictable demand.
On-Site and Decentralized Systems held the remaining 40.2% share in 2026. They provide local hydrogen supply, avoid some pipeline transportation needs, and can be paired directly with local renewable generation. Accelera announced a 5 MW PEM project for Tyczka Hydrogen at the Port of Schweinfurt in September 2025. The project received a EUR 5 million grant from Bavaria and is intended to serve mobility, industrial, and research customers. The European Network of Transmission System Operators for Electricity (ENTSO-E) noted that transmission system operator requirements do not yet fully address hydrogen-storage flexibility from electrolyzers. Clearer rules could improve the revenue case for decentralized systems that provide grid services.
Geography Analysis
Europe Proton Exchange Membrane (PEM) Electrolyzer Market
Europe held 39.5% of the Proton Exchange Membrane (PEM) Electrolyzer Market share in 2026, supported by renewable hydrogen rules, public funding, and manufacturing capacity. The European Hydrogen Bank committed EUR 3 billion across 3 auction rounds.The Renewable Fuels of Non-Biological Origin (RFNBO) standard under RED III links electrolysis to additional renewable generation and time-based European manufacturers deployed 142 MW of electrolyzers across the EU27, European Free Trade Association (EFTA), and the UK in 2024, which was 118% more than in 2023. PEM technology represented 66% of that volume.
APAC Proton Exchange Membrane (PEM) Electrolyzer Market
Asia-Pacific is projected to record a 30.3% CAGR from 2027 to 2032, the fastest regional pace in the Proton Exchange Membrane (PEM) Electrolyzer Market. China accounted for 65% of global installed electrolyzer capacity and 60% of global manufacturing capacity in 2025. However, the region’s PEM demand also depends on South Korea, Japan, India, and Australia rather than China alone. South Korea targets 5.2 million tons of green hydrogen production per year by 2040. HYSTAR India’s allocation of 862,000 tons per year of green hydrogen capacity and 3,000 MW per year of electrolyzer manufacturing capacity supports a future domestic supply base. These markets have distinct policy approaches, but all link hydrogen development with energy security and industrial competitiveness.
The Americas and MEA Proton Exchange Membrane (PEM) Electrolyzer Market
North America is supported by the U.S. Section 45V hydrogen production tax credit of up to USD 3 per kg. Accelera delivered a 35 MW PEM system to Linde’s Niagara Falls facility in September 2025, using renewable hydroelectric power. Nel received USD 29 million in additional manufacturing tax credits for its Connecticut expansion in January 2025, which supports a 500 MW annual PEM manufacturing program. NEL ASA Canada is also emerging as a project location through Plug Power’s work with Hy2gen in Quebec. South America and the Middle East and Africa represent a later demand horizon, with export strategies dependent on projects reaching final investment decision.
Competitive Landscape
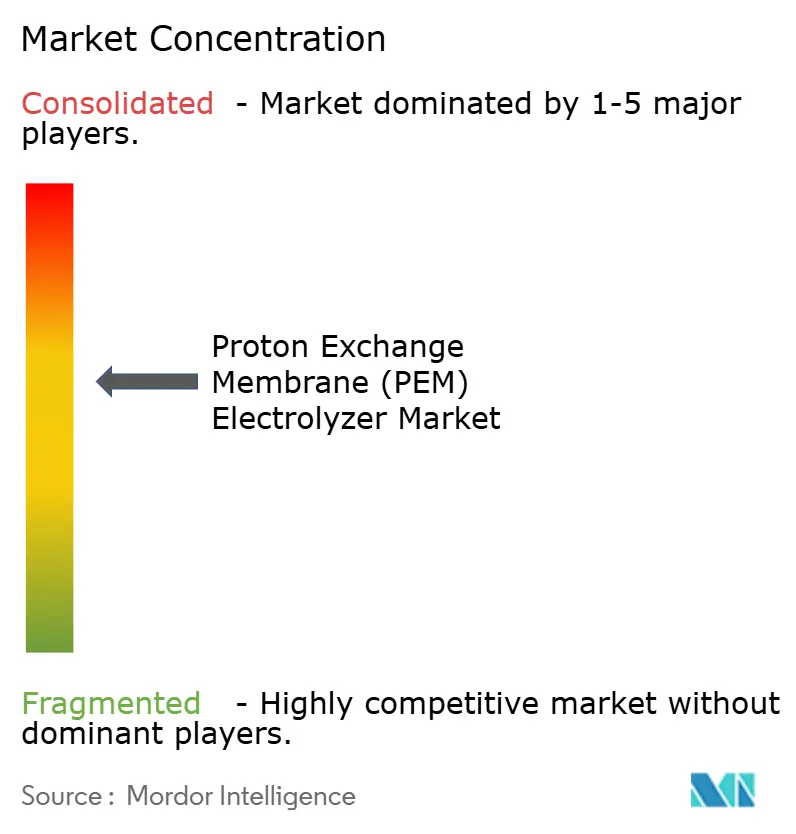
The Proton Exchange Membrane (PEM) Electrolyzer Market is moderately concentrated at the upper tier. Siemens Energy, Nel ASA, Plug Power, ITM Power, and Accelera by Cummins are active in large industrial projects, while regional and specialized firms compete in systems below 5 MW. Power reported FY25 revenue growth of more than 50% year over year and 400% over 2 years, driven by project deliveries. Nel reported a 473% increase in PEM order intake during the third quarter of 2026 to NOK 245 million, equal to USD 25.7 million. The same company stated that 48% of its consolidated backlog carried material delay or cancellation risk, which shows that contracting certainty remains important.
The Air Liquide and Siemens Energy partnership operates a Berlin factory with capacity of up to 1 GW per year for PEM stacks and plans to expand toward 3 GW. Its structure combines equipment technology, manufacturing, and access to large industrial projects. Nel partnered with Rheinmetall in October 2026 on the Giga PtX synthetic fuel project, extending PEM use into e-fuels. Nel also formed a framework agreement with Hydrasun in September 2026 to support European assembly and system integration. These moves reflect a need to provide complete systems rather than stacks alone. They also show that strategic partnerships are becoming a practical way to manage integration and delivery requirements.
Balance of Plant integration is a key opportunity where local engineering capability is limited and projects range from 50 MW to 200 MW. Iridium recovery and circular-economy services could also become more important as material-security requirements become stronger. Electric Hydrogen is pursuing high-current-density stack designs for applications above 100 MW. Ohmium International uses modular deployment and subscription-based commercial models to lower initial customer commitments. ISO/TC 197 standards and IEC 62282 safety requirements are increasingly relevant to procurement by European large-scale buyers. Larger suppliers with established certification and operating references can use these requirements to strengthen their position.
Proton Exchange Membrane (PEM) Electrolyzer Industry Leaders
-
Ohmium International
-
Siemens Energy AG
-
ITM Power plc
-
Nel ASA
-
Cummins Inc.
- *Disclaimer: Major Players sorted in no particular order
Proton Exchange Membrane (PEM) Electrolyzer Market Companies Covered in this Report
- Air Liquide
- Air Products and Chemicals, Inc.
- Bosch
- Cummins Inc.
- Electric Hydrogen
- Elogen
- Fortescue
- H-TEC SYSTEMS GmbH
- Hystar AS
- ITM Power plc
- John Cockerill
- McPhy Energy S.A.
- Nel ASA
- Next Hydrogen Solutions Inc.
- Ohmium International
- PERIC Hydrogen Technologies Co., Ltd.
- Plug Power Inc.
- Siemens Energy AG
- Sungrow Hydrogen
- thyssenkrupp nucera AG & Co. KGaA
Recent Industry Developments in Proton Exchange Membrane (PEM) Electrolyzer Market
- October 2026: Nel ASA received a purchase order for multiple containerized PEM solutions from a leading U.S. technology customer, and in a separate announcement partnered with Rheinmetall on the Giga PtX project for decentralized synthetic fuel production, expanding the application frontier of PEM hydrogen generation into e-fuels.
- September 2026: Nel ASA secured additional purchase orders for submarine PEM electrolyzer stacks from the U.S. defense sector via Collins Aerospace, marking a strategic diversification into military applications beyond commercial hydrogen markets.
- September 2026: Nel ASA entered a framework agreement with Hydrasun establishing European assembly and integration capacity for PEM electrolyzer solutions, enabling co-located Balance of Plant integration and containerized hydrogen-production deliveries across European markets.
- April 2026: Nel ASA received a USD 7 million purchase order from Mesure Process, a Synqo Energies subsidiary, for containerized PEM equipment to supply hydrogen refueling stations and industrial end users at a European site targeted for 2027 operations, reflecting repeat-order confidence in Nel’s modular MC platform.
Global Proton Exchange Membrane (PEM) Electrolyzer Market Report Scope
A Proton Exchange Membrane (PEM) electrolyzer is an electrochemical system that splits water (H₂O) into hydrogen (H₂) and oxygen (O₂) using electricity and a solid polymer electrolyte membrane. The system uses a thin, solid polymer membrane (such as Nafion) that conducts positively charged hydrogen ions (protons) from the anode to the cathode while blocking electrons and product gases.
The global PEM electrolyzer market is segmented by component, capacity, end user, installation type, and geography. By component, the market is segmented into electrolyzer stacks and balance of plant (BoP). By capacity, the market is segmented into systems below 500 kW, 500 kW to 2 MW, and above 2 MW. By end user, the market is segmented into hydrogen producers, oil and gas companies, chemical and petrochemical companies, steel and metals manufacturers, power utilities and renewable energy developers, and transportation and mobility operators. By installation type, the market is segmented into on-site and decentralized systems and centralized and large-scale systems. The report also covers the market size and forecasts for the global proton exchange membrane electrolyzer market across 22 countries in key regions. For each segment, the market sizing and forecasts have been provided on the basis of value (USD).
Segmentation Overview
| Electrolyzer Stack |
| Balance of Plant (BoP) |
| Below 500 kW |
| 500 kW to 2 MW |
| Above 2 MW |
| Hydrogen Producers |
| Oil and Gas Companies |
| Chemical and Petrochemical Companies |
| Steel and Metals Manufacturers |
| Power Utilities and Renewable Energy Developers |
| Transportation and Mobility Operators |
| On-Site and Decentralized Systems |
| Centralized and Large-Scale Systems |
| North America | United States |
| Canada | |
| Mexico | |
| Europe | Germany |
| France | |
| Italy | |
| Spain | |
| United Kingdom | |
| Poland | |
| Netherlands | |
| Russia | |
| Rest of Europe | |
| Asia-Pacific | China |
| India | |
| Japan | |
| South Korea | |
| Australia | |
| Rest of Asia-Pacific | |
| South America | Brazil |
| Argentina | |
| Rest of South America | |
| Middle East and Africa | Saudi Arabia |
| United Arab Emirates | |
| Israel | |
| South Africa | |
| Rest of Middle East and Africa |
| By Component | Electrolyzer Stack | |
| Balance of Plant (BoP) | ||
| By Capacity | Below 500 kW | |
| 500 kW to 2 MW | ||
| Above 2 MW | ||
| By End User | Hydrogen Producers | |
| Oil and Gas Companies | ||
| Chemical and Petrochemical Companies | ||
| Steel and Metals Manufacturers | ||
| Power Utilities and Renewable Energy Developers | ||
| Transportation and Mobility Operators | ||
| By Installation Type | On-Site and Decentralized Systems | |
| Centralized and Large-Scale Systems | ||
| By Geography | North America | United States |
| Canada | ||
| Mexico | ||
| Europe | Germany | |
| France | ||
| Italy | ||
| Spain | ||
| United Kingdom | ||
| Poland | ||
| Netherlands | ||
| Russia | ||
| Rest of Europe | ||
| Asia-Pacific | China | |
| India | ||
| Japan | ||
| South Korea | ||
| Australia | ||
| Rest of Asia-Pacific | ||
| South America | Brazil | |
| Argentina | ||
| Rest of South America | ||
| Middle East and Africa | Saudi Arabia | |
| United Arab Emirates | ||
| Israel | ||
| South Africa | ||
| Rest of Middle East and Africa | ||
Key Questions Answered in the Report
What is driving demand for PEM electrolyzers?
Industrial hydrogen demand, renewable-power integration, policy incentives, and large offtake agreements are supporting growth. The report projects a 28.45% CAGR from 2027 to 2032.
Which PEM electrolyzer component is growing fastest?
Balance of Plant is projected to grow at a 28.9% CAGR through 2032 as larger projects require more power conversion, compression, water treatment, and thermal management equipment.
Why are projects above 2 MW gaining share?
Installations above 2 MW held 49.7% share in 2026 and are projected to grow at a 29.4% CAGR because industrial users need high-volume hydrogen supply.
Which end user is expected to grow fastest?
Steel and Metals Manufacturers are projected to grow at a 30.6% CAGR through 2032 as hydrogen-based direct reduced iron gains relevance for lower-emissions steelmaking.
Which region leads PEM electrolyzer deployment?
Europe held 39.5% share in 2026, supported by RFNBO rules, Hydrogen Bank funding, and established manufacturing capacity.
What are the main constraints on PEM electrolyzer adoption?
Iridium supply concentration, high installed costs, electricity prices, incomplete hydrogen infrastructure, and delayed final investment decisions remain the principal constraints.