
Property Insurance Market Size and Share
Market Overview
| Study Period | 2020 - 2031 |
|---|---|
| Market Size (2026) | USD 748.60 Billion |
| Market Size (2031) | USD 946.30 Billion |
| Growth Rate (2026 - 2031) | 4.80 % |
| Fastest Growing Market | Asia-Pacific |
| Largest Market | North America |
| Market Concentration | Low |
Major Players *Disclaimer: Major Players sorted in no particular order Image © Mordor Intelligence. Reuse requires attribution under CC BY 4.0. | |
Property Insurance Market Analysis by Mordor Intelligence
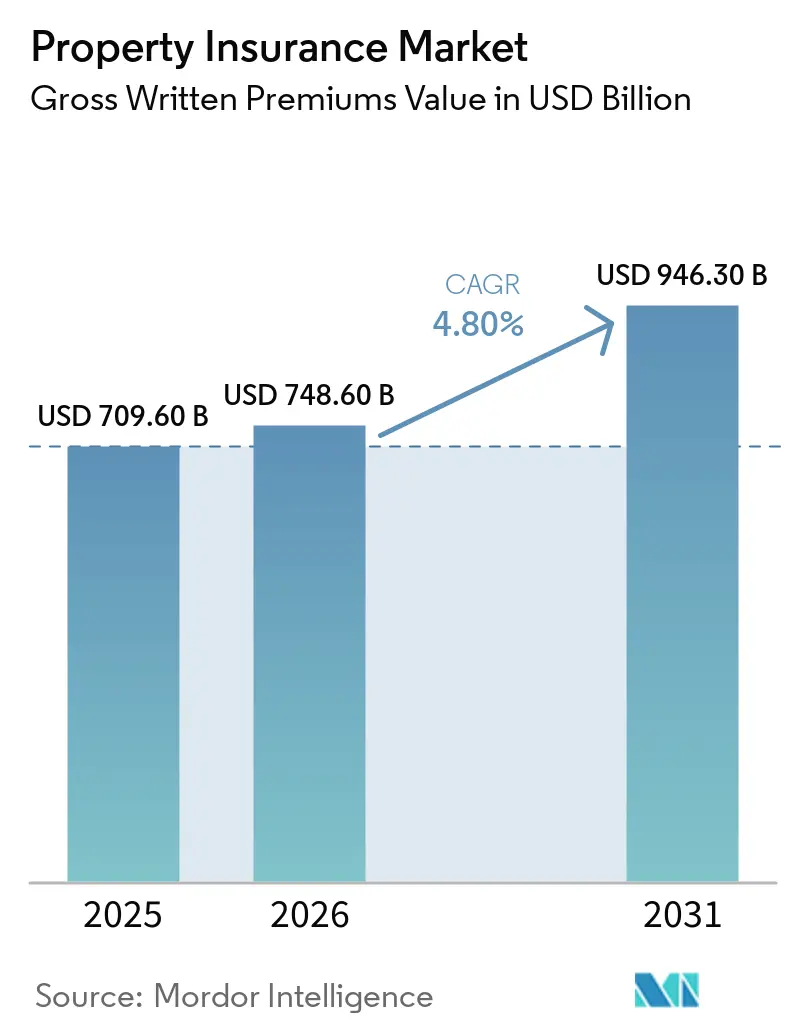
The property insurance market, measured in terms of gross written premiums, was valued at USD 709.60 billion in 2025, is estimated at USD 748.60 billion in 2026, and is forecast to reach USD 946.30 billion by 2031, growing at a CAGR of 4.80% from 2026 to 2031. The property insurance market is expanding because weather-related losses are changing how insurers price and select risks. Secondary perils, including wildfire, severe convective storms, and floods, accounted for 92% of USD 107 billion in global insured natural catastrophe losses in 2025. The resulting demand for better risk data is encouraging the use of satellite imagery, building sensors, and location-specific underwriting tools. Investment in data centers, logistics facilities, and other high-value assets is also increasing the need for larger and more specialized insurance placements. Competitive conditions are becoming more difficult as reinsurance capacity improves and commercial property pricing softens, although rising replacement costs and an insurance protection gap continue to support long-term demand.
Key Report Takeaways
- By insurance product, homeowners' insurance captured 46.3% of the property insurance market share in 2025, while landlord insurance is projected to grow at a 6.4% CAGR through 2031.
- By coverage type, building and structural coverage held 61.6% of the property insurance market share in 2025, while business interruption and loss-of-income coverage is forecast to grow at a 6.1% CAGR through 2031.
- By property type, residential properties accounted for 56.3% of the property insurance market share in 2025, while industrial and manufacturing property insurance is projected to grow at a 5.8% CAGR through 2031.
- By policyholder, households held 49.1% of the property insurance market share in 2025, while professional real-estate owners are forecast to grow at a 6.8% CAGR through 2031.
- By distribution channel, agents and brokers captured 69.5% of the property insurance market share in 2025, while embedded and affinity channels are projected to grow at a 9.8% CAGR through 2031.
- By geography, North America held 46.8% of the property insurance market share in 2025, while Asia-Pacific is forecast to grow at a 6.5% CAGR through 2031.
Note: Market size and forecast figures in this report are generated using Mordor Intelligence’s proprietary estimation framework, updated with the latest available data and insights as of January 2026.
Global Property Insurance Market Trends and Insights
Drivers Impact Analysis*
| Driver | (~) % Impact on CAGR Forecast | Geographic Relevance | Impact Timeline |
|---|---|---|---|
| Rising Frequency and Severity of Property-Damaging Natural Catastrophes | +1.5% | Global, concentrated in North America, Asia-Pacific coastal zones, and Southern Europe | Short term (≤ 2 years) |
| Increasing Global Property Values and Replacement Costs | +0.8% | North America and Western Europe, with spillover to Gulf states and advanced Asia-Pacific | Medium term (2-4 years) |
| Growing Urbanization and Expansion of Residential and Commercial Building Stock | +0.6% | Asia-Pacific core, with spillover to the Middle East, Africa, and Latin America | Long term (≥ 4 years) |
| Increasing Adoption of Artificial Intelligence, Geospatial Analytics, IoT, and Digital Property Underwriting | +0.5% | Global, with adoption concentrated in North America and Western Europe | Medium term (2-4 years) |
| Growing Insurance Requirements for Mortgaged Properties and Commercial Assets | +0.4% | North America and Europe, with developing adoption in South and Southeast Asia | Medium term (2-4 years) |
| Expansion of High-Value Assets, Including Data Centers, Logistics Facilities, and Critical Infrastructure | +0.5% | Global, concentrated in the United States, United Kingdom, Germany, Singapore, and Gulf states | Short term (≤ 2 years) |
| Source: Mordor Intelligence | |||
Rising Frequency and Severity of Property-Damaging Natural Catastrophes
Six consecutive years of global insured natural catastrophe losses above USD 100 billion have reset underwriting expectations across the property insurance market. Secondary perils accounted for 92% of USD 107 billion in insured losses during 2025, and Swiss Re reported that a normalized 2026 loss would total USD 148 billion. Munich Re stated that wildfire insured losses in 2025 were more than 2 times the inflation-adjusted 30-year average[1]. Verisk placed the global modeled insured average annual property loss at USD 171 billion, which provides a benchmark for loss provisioning and premium adequacy. Insurers are revising their risk appetite, adding wildfire and hail deductibles, and pricing portfolios against a higher long-term loss baseline. These measures are particularly important in areas exposed to recurring wildfire, flood, and severe storm losses.
Increasing Adoption of Artificial Intelligence, Geospatial Analytics, IoT, and Digital Property Underwriting
Digital tools are shortening property risk assessment and allowing insurers to differentiate risk at the individual location level. State Farm’s August 2026 patent application described artificial intelligence models that combine smart-building sensor readings across multi-property portfolios with claims history to create location-specific recommendations. Convr and Property Guardian integrated property-level wildfire intelligence into an underwriting workbench in June 2026, reducing reliance on broad regional scores[2]. The National Association of Insurance Commissioners began an artificial intelligence systems evaluation tool pilot across 12 states in March 2026, increasing the importance of governance and documentation for algorithmic pricing. The property insurance market is therefore placing more value on data that can show the condition and exposure of a specific building. Carriers that improve this information base can make more consistent underwriting decisions in catastrophe-exposed portfolios.
Expansion of High-Value Assets, Including Data Centers, Logistics Facilities, and Critical Infrastructure
The expansion of hyperscale data centers is creating property risks that can exceed the capacity of traditional insurance programs. Swiss Re estimated that global data center insurance premiums will reach USD 24.2 billion by 2030, compared with USD 10.6 billion currently[3]. The same research stated that 40% of the United States data center capacity is located in areas with significant tornado activity. Business interruption exposure can exceed the physical replacement value of the building once facilities contain GPU-equipped servers and contractual service obligations. Allianz Commercial noted that a single artificial intelligence campus can cost more than USD 20 billion to construct. The property insurance market is responding with layered placements and specialized capacity designed for data center and digital infrastructure risks.
Growing Urbanization and Expansion of Residential and Commercial Building Stock
Urban growth is placing more residential and commercial assets in areas exposed to natural hazards. Asia represented 30% of global economic catastrophe losses in 2025 but only 5% of insured losses, which shows the scale of the regional protection gap. Swiss Re reported that emerging Asia had a catastrophe insurance resilience score of 5% in mid-2026, leaving 95% of economic catastrophe losses uninsured. India’s insurance sector is forecast to grow 6.9% annually in real terms during 2026-2030, supported by more than USD 26 trillion of property exposed to natural catastrophe perils[4]. In coastal China, urbanization, industrial upgrading, and port expansion are concentrating assets in typhoon and storm-surge zones. This growing asset base supports demand, while the limited level of coverage also leaves insurers exposed to difficult accumulation and affordability questions.
Restraints Impact Analysis*
| Restraint | (~) % Impact on CAGR Forecast | Geographic Relevance | Impact Timeline |
|---|---|---|---|
| Rising Property Insurance Premiums and Deductibles in Catastrophe-Prone Locations | -0.8% | North America, including Florida, California, and the Gulf Coast, Southern Europe, and coastal Asia-Pacific | Short term (≤ 2 years) |
| Escalating Catastrophe Claims and Reinsurance Costs Increasing Insurers’ Cost of Risk | -0.7% | Global, with North American primary markets most exposed | Medium term (2-4 years) |
| Insurer Capacity Constraints, Underwriting Restrictions, and Non-Renewals in High-Risk Markets | -0.6% | North American wildfire and hurricane zones, Mediterranean Europe, and coastal Asia-Pacific | Short term (≤ 2 years) |
| Limited Property-Level Risk Data and Regulatory Constraints on Risk-Based Pricing | -0.5% | Emerging markets in Asia-Pacific, the Middle East, Africa, and South America, with regulatory friction in selected United States | Long term (≥ 4 years) |
| Source: Mordor Intelligence | |||
Rising Property Insurance Premiums and Deductibles in Catastrophe-Prone Locations
Higher premiums and deductibles are creating pressure for households in the most exposed property insurance market locations. Cumulative United States home insurance premium increases reached 46.8% between 2020 and 2025, while the national increase moderated to 6% in 2025. Colorado and Minnesota recorded increases of 18.3% and 17%, respectively, during 2025. California’s FAIR Plan exposure reached USD 649.4 billion in June 2025, and policy count increased 31% to 610,179. Policyholders can respond by accepting higher deductibles or reducing optional protection, which lowers actual coverage even when premium revenue rises. Rate-filing requirements, including California’s Proposition 103 framework, can limit the ability of insurers to match prices quickly to changing risk.
Insurer Capacity Constraints, Underwriting Restrictions, and Non-Renewals in High-Risk Markets
Carrier withdrawals are moving more catastrophe-exposed risk into excess and surplus lines and state-backed plans. The United States non-renewal rate in the highest-risk homeowner quintile increased 120% between 2018 and 2022, and average non-renewal rates across the 15 highest-rate states were 3 times higher in 2024 than in 2018. International Association of Insurance Supervisors capital frameworks require insurers in high-risk markets to hold more risk-based capital. This requirement can discourage commercial expansion into locations with lower penetration and higher expected severity. Public insurers of last resort cannot fully close the protection gap without clear government risk-sharing arrangements. The property insurance market, therefore, faces a continuing tension between the places with the greatest need for coverage and the places where private capacity is least available.
*Our forecasts treat driver/restraint impacts as directional, not additive. The impact forecasts reflect baseline growth, mix effects, and variable interactions.
Segment Analysis
By Insurance Product: Landlord Coverage Gains Ground as Rental Markets Institutionalize
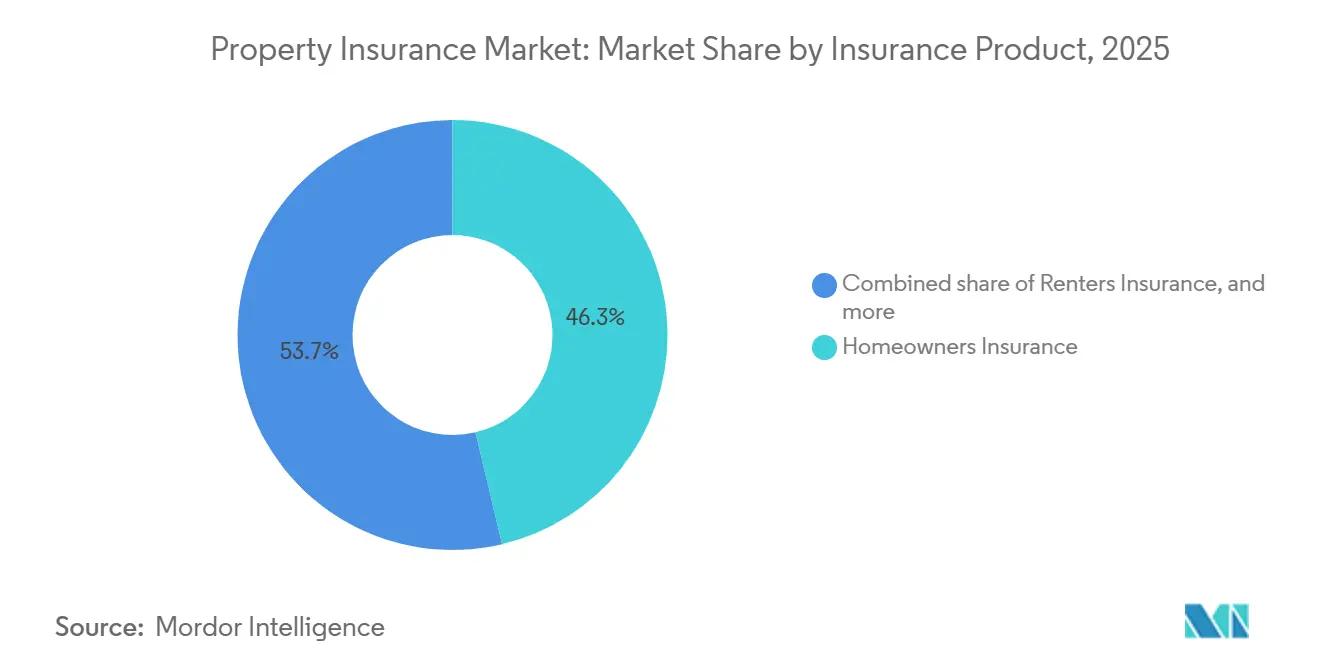
Landlord insurance is forecast to grow at a 6.4% CAGR during 2026-2031, making it the fastest-growing insurance product within the property insurance market. Rental demand is expanding the insurable landlord base in advanced economies, where affordability and interest-rate pressure have kept potential buyers in rental housing. Institutional ownership is also moving policy design toward portfolio-rated coverage that includes loss-of-rent and liability features. Homeowners insurance retained the largest position with 46.3% of the property insurance market size in 2025. Commercial property insurance continues to benefit from lender requirements, lease obligations, and regulatory mandates. Renters insurance is gaining attention through distribution partnerships that place coverage within the rental transaction. Chubb’s national renters program, approved in 44 states in 2026, targets multifamily operators and institutional housing platforms. The initiative indicates a move away from individual-agent acquisition toward coverage placed within leasing activity.
Institutional investors, real estate investment trusts, property funds, and single-family rental operators are increasing demand for portfolio-rated landlord programs. Honeycomb Insurance introduced Lessor’s Risk Only coverage for office and retail properties in August 2026, extending its offer beyond residential property. Obie integrated landlord insurance with RentSpree’s rental software in August 2026, allowing coverage to be quoted and bound within the leasing workflow. These models bring product design, distribution, and property management technology closer together. United Kingdom renter reform legislation and European Union energy performance certificate requirements can create additional insurance demand for professional operators. The property insurance industry is adapting to larger insured values, more standardized portfolio data, and policy terms designed for professional owners.
By Coverage Type: Structural Coverage Anchors Portfolios While Business Interruption Accelerates
Building and structural coverage accounted for 61.6% of the property insurance market size in 2025. Its scale reflects its role as the basic coverage required by mortgage lenders, commercial leases, and regulatory frameworks. Replacement cost inflation has created underinsurance risk because construction material costs increased 30-40% between 2020 and 2025. Contents and business personal property coverage protects inventory, equipment, and information technology hardware that structural cover does not include. Business interruption and loss-of-income coverage is forecast to grow at a 6.1% CAGR through 2031. The faster growth reflects increased attention to the cost of operational downtime at asset-intensive businesses.
Allianz Global Corporate and Specialty reported that the average business interruption property insurance claim exceeded EUR 3.8 million (USD 4.1 million), compared with EUR 3.1 million (USD 3.4 million) in the prior 5-year period. Supply chain complexity and a larger share of intangible revenue are contributing to higher disruption costs. Data centers illustrate the issue because lost compute capacity and service-level obligations can exceed the cost to replace the facility itself. Swiss Re stated that new premiums from hyperscale data centers are expected to reach USD 10 billion annually in 2026. ISO and IEC continuity standards are increasingly appearing in underwriting submissions. These standards influence eligibility and terms for specialized business interruption coverage. The growing value of equipment, inventory, and digital services means that policy limits require closer attention to the risk of a prolonged interruption. Coverage design must address both physical damage and the revenue effects that follow a facility shutdown.
By Property Type: Residential Scale Anchors the Base While Industrial Momentum Builds
Residential properties represented 56.3% of the property insurance market size in 2025 and form the broad base of the property insurance market. The segment reflects the depth of housing stock across North America, Europe, and advanced Asia-Pacific economies. Industrial and manufacturing property insurance is forecast to grow at a 5.8% CAGR during 2026-2031. Advanced manufacturing expansion, nearshoring, and automated facilities are increasing the value concentrated at individual sites. Commercial, public, institutional, and agricultural buildings add further premium volume across the property base. Government spending on health, education, and transport infrastructure also supports public and institutional exposure. These property classes often combine large building values with essential operating functions. Their insurance requirements can therefore include engineering reviews, detailed replacement-cost information, and business interruption protection.
Insurance capacity returned to manufacturing property in 2026, with Lloyd’s aggregate stamp capacity projected to increase 4%. The input also identifies 6 new domestic United States property carriers or managing general agents and 7 new Lloyd’s syndicates expected to open during 2026. Nearshoring is increasing demand in Mexico, Vietnam, Eastern Europe, and Southeast Asia, where new facilities need coverage from construction onward. Fire protection systems, probable maximum loss studies, and engineering records have become important underwriting factors. The European Union Green Deal building-efficiency requirements are affecting how insurers assess replacement costs and obsolescence risk for industrial assets. Agricultural building cover is also gaining relevance as precision agriculture and vertical farming increase the value of farm infrastructure.
By Policyholder: Household Scale Contrasts With Professional Owner Momentum
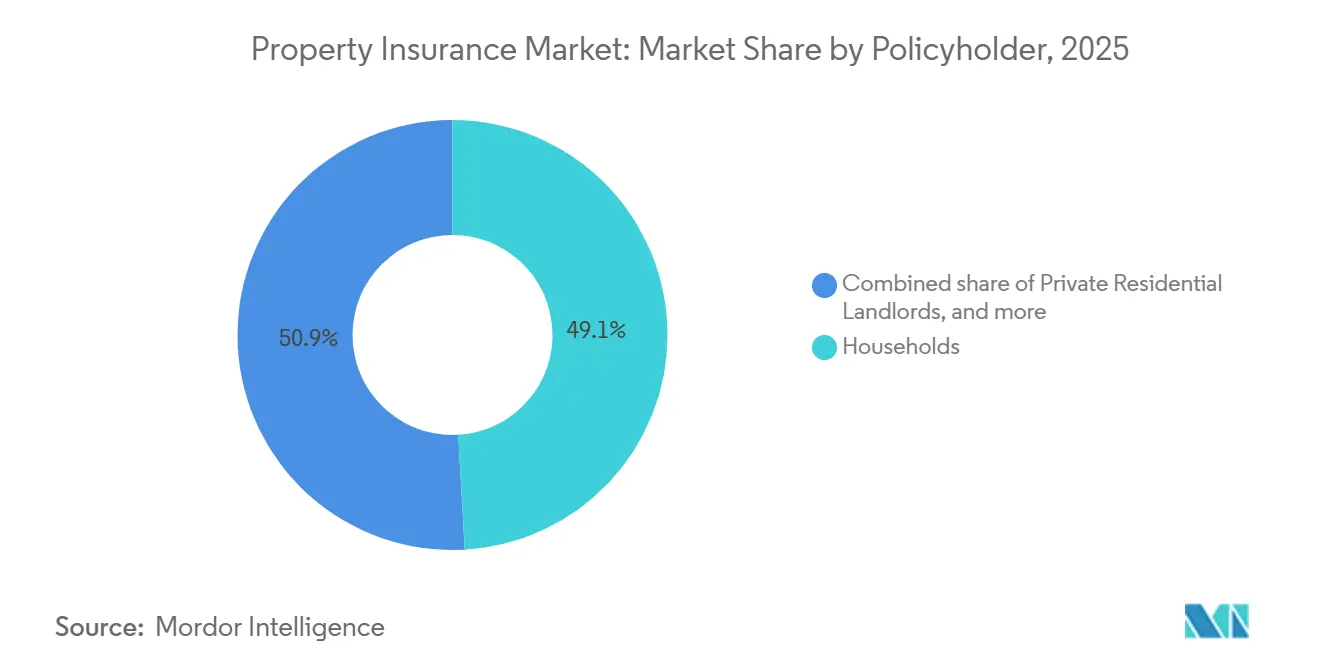
Households, including owner-occupiers and tenants, held 49.1% of the property insurance market share in 2025. Mortgage-linked insurance requirements, consumer regulation, and the size of the global housing stock support this leading position. Professional real-estate owners are forecast to grow at a 6.8% CAGR during 2026-2031. Institutional capital is concentrating in income-producing property and increasing demand for portfolio-rated programs, parametric catastrophe cover, and integrated business interruption protection. Small and medium-sized enterprise occupiers remain exposed to underinsurance when replacement values are not updated for construction inflation. Public sector and state-owned entities hold concentrated exposure through hospitals, schools, and utility infrastructure in flood plains and wildfire corridors. These entities can face limited commercial capacity when facilities are located in high-risk areas. Their coverage needs remain linked to the availability of public risk-sharing arrangements and the adequacy of resilience measures.
Private residential landlords are seeking broader cover that includes legal liability, tenant default, and loss-of-rent protection. Large enterprise occupiers use multinational programs that coordinate local admitted coverage with global master policies. This approach helps risk managers seek more consistent terms across multiple jurisdictions. The movement from fragmented individual ownership to institutional platforms is increasing average policy values. It also requires higher insured values, portfolio-related sub-limits, and data feeds for continuing risk monitoring. United Kingdom renter reform requirements and European Union energy performance standards can add compliance-related demand for professional property operators.
By Distribution Channel: Brokers Command Scale While Embedded Models Expand
Agents and brokers held 69.5% of the global property insurance market in 2025. Their leading position reflects the technical demands of commercial placements, high-value residential risks, and established insurer relationships. Multi-site property programs often need several carriers, risk management support, and placement expertise. Direct insurer channels and bancassurance remain important, particularly in continental Europe and across Asia-Pacific. Embedded and affinity channels are forecast to grow at a 9.8% CAGR during 2026-2031. Their growth is tied to transactions where the customer is already purchasing a mortgage, lease, construction service, or real estate platform membership.
Matic integrated real-time homeowners insurance comparisons into Newrez’s HomeHub mortgage platform in June 2026. Vertical Insure also introduced embedded builder’s risk coverage within Ressio’s construction-management software in May 2026. The examples show that different points in the property lifecycle can support embedded coverage. European Union insurance distribution rules, United Kingdom Financial Conduct Authority rules, and developing Asia-Pacific standards require suitable products and clear disclosures. These requirements make platform operators responsible for meeting established consumer protection expectations. The property insurance market is likely to retain brokers for complex commercial risks while embedded models broaden access in personal lines, landlord cover, and builder’s risk. This creates a channel structure in which complex placements continue to depend on advice and insurer access. Simpler transactions can be offered within mortgage, leasing, and construction platforms when disclosure and suitability standards are met.
Geography Analysis
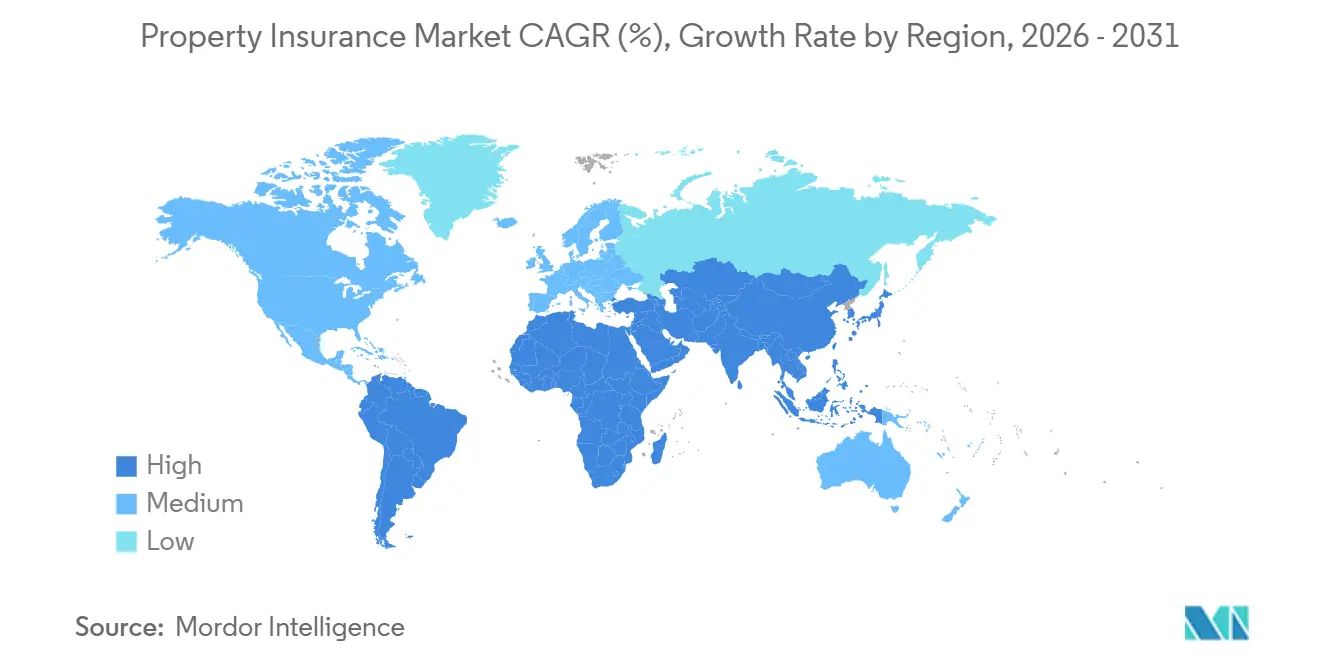
North America accounted for 46.8% of the property insurance market share in 2025. The region has the deepest homeowners insurance base, a developed commercial property sector, and widespread mortgage-linked insurance requirements. United States property and casualty premiums were USD 432.9 billion in 2026, and the supplied forecast places them on a 6% CAGR path to USD 546.2 billion by 2030. Reinsurance rates declined 14.7% at the January 2026 renewal, and commercial property rates softened during 2026. The North American protection gap nevertheless increased 6% to USD 140 billion, showing continued underinsurance in wildfire, hurricane, and flood zones. South America has an emerging share, led by Brazil’s commercial and agricultural property base and a gradual formalization of residential insurance requirements.
Europe’s real property premium growth is expected to slow to 0.3% in 2026 from 2.5% in 2025. Italy stands apart because its 2025 natural catastrophe cover mandate for corporates is expanding the premium base through compliance-driven uptake. European property rates declined 9% in the second quarter of 2026, the seventh consecutive quarter of reductions. Underwriters remain careful with wildfire-exposed Southern European assets, cyber-physical exclusions, and heat-wave exposure at industrial sites. Central and Eastern European markets are growing faster due to lower insurance penetration, and Talanx and UNIQA are expanding their regional operations. Europe’s protection gap increased 11% to USD 90 billion in 2025, which shows that mature markets also face underinsurance as catastrophe exposure rises.
Asia-Pacific is the fastest-growing regional property insurance market, with a forecast CAGR of 6.5% through 2031. India supports this expansion with a forecast 6.9% annual real insurance growth rate during 2026-2030. China’s property insurance growth was 6% in 2025, and growth is expected to range from 5-6% in 2026, supported by government-backed household protection gap efforts. Emerging Asia’s 5% catastrophe insurance resilience score remains the region’s largest coverage opportunity and a major systemic risk. The Middle East and Africa are also expanding as construction adds new insurable property stock. The African Risk Capacity initiative aims to extend insurance protection to 700 million people across the continent by 2034.
Competitive Landscape
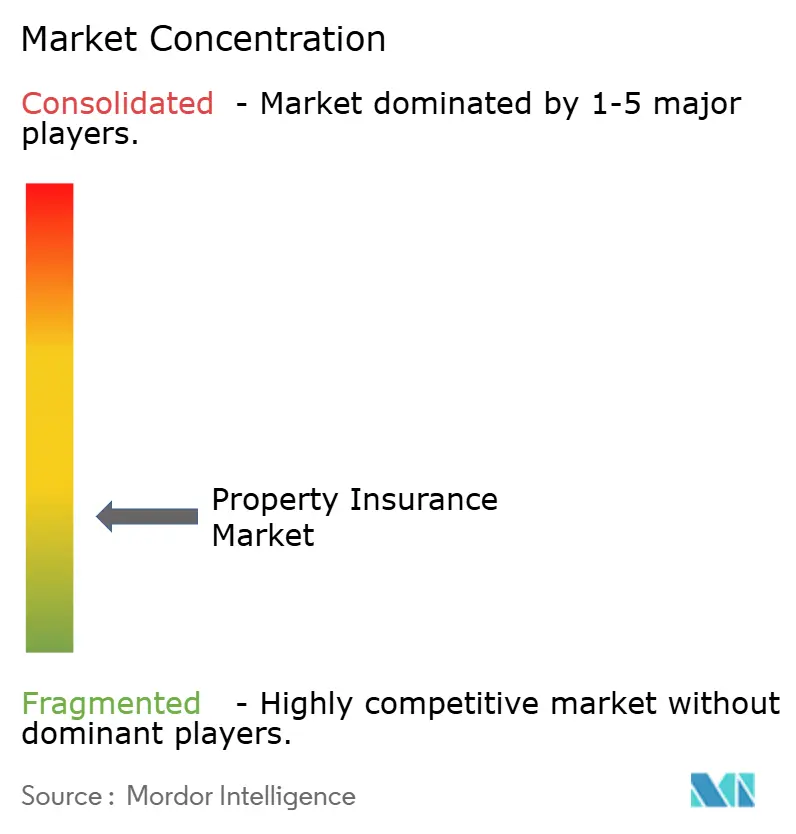
The property insurance market is fragmented. Chubb, American International Group, Zurich, Allianz, AXA, Tokio Marine, Berkshire Hathaway, and Liberty Mutual hold significant positions in their core geographies and product lines. Larger carriers compete through geographic reach, capacity, distribution, and underwriting capability. Smaller providers compete by serving high-risk or underserved niches that broad carriers may not prioritize. Reinsurance capital reached USD 663 billion in 2025, a 9% increase from the previous year, which increased competitive pressure in primary property lines. The property insurance market is therefore competitive, even as specialized expertise remains important for difficult risks.
Zurich agreed to acquire United Kingdom specialty insurer Beazley for GBP 8.1 billion (USD 10.8 billion) in March 2026. The transaction adds specialty capabilities in cyber, marine, aviation, and professional lines that support commercial property program structures. Allianz agreed in July 2026 to acquire HSBC Holdings’ Singapore insurance unit for SGD 2.7 billion (USD 2.1 billion), along with a 15-year bancassurance distribution agreement. Chubb completed acquisitions of Liberty Mutual property and casualty businesses in Thailand and Vietnam during 2025, adding fire, property, and industrial all-risk cover. These actions show how established carriers are pursuing specialty capability, regional scale, and distribution access. Technology remains a further point of competition as insurers use satellite images, permit data, and Internet of Things sensor feeds to assess individual locations.
Parametric property cover is expanding from large-account reinsurance into primary markets in Latin America and Southeast Asia. Mexico’s 2026 parametric catastrophe insurance arrangement was USD 575 million and was 2 times the prior year’s placement. Marsh launched the Stratus exchange in 2026 with up to USD 10 billion in single-risk data center capacity, following its June 2025 Nimbus construction facility with USD 2.7 billion in limits. Honeycomb, Kin, and Shepherd are using artificial intelligence underwriting to serve selected complex property risks. The National Association of Insurance Commissioners pilot is raising documentation requirements for algorithmic underwriting, which can favor better-resourced incumbents.
Property Insurance Industry Leaders
-
Berkshire Hathaway Inc.
-
Allianz SE
-
AXA SA
-
Chubb Limited
-
American International Group, Inc. (AIG)
- *Disclaimer: Major Players sorted in no particular order
Recent Industry Developments
- June 2026: Travelers announced TravelersLLM, a proprietary insurance-specific large language model trained on millions of company documents and deployed across underwriting analysis, model development, and knowledge retrieval. Testing showed TravelersLLM outperforming commercially available models on insurance-specific tasks at lower cost, signaling a shift toward proprietary artificial intelligence infrastructure among tier-1 carriers.
- June 2026: Convr partnered with Property Guardian to integrate property-level wildfire intelligence into Convr’s AI Underwriting Workbench, enabling underwriters to select, price, and monitor wildfire-exposed commercial property risks within a single workflow without reliance on generic regional risk scores.
- June 2026: Travelers Companies priced USD 750 million in Long Point Re IV Series 2026-1 catastrophe bond notes, its largest-ever cat bond issuance, covering multi-peril northeast United States property losses across a 4-year term. Travelers simultaneously restructured its reinsurance architecture, consolidating personal lines protection under an enterprise-wide catastrophe program.
- May 2026: Vertical Insure embedded builder’s risk insurance within Ressio’s AI-powered construction management software, enabling construction companies to acquire coverage within their project management workflow, eliminating the separate broker engagement that previously delayed project starts.
Global Property Insurance Market Report Scope
| Homeowners Insurance |
| Renters Insurance |
| Landlord Insurance |
| Commercial Property Insurance |
| Building / Structural Property Coverage |
| Contents / Business Personal Property Coverage |
| Business Interruption / Loss of Income Coverage |
| Residential Properties |
| Commercial Properties |
| Industrial / Manufacturing |
| Public and Institutional |
| Agricultural Buildings |
| Households (Owner-Occupiers and Tenants) |
| Private Residential Landlords |
| Small and Medium-Sized Enterprise (SME) Occupiers |
| Large Enterprise Occupiers |
| Professional Real-Estate Owners |
| Public Sector / SOE |
| Agents & Brokers |
| Direct / Insurer-Owned Channels |
| Bancassurance & Other Financial Institutions Channels |
| Embedded / Affinity |
| North America | United States |
| Canada | |
| Mexico | |
| South America | Brazil |
| Argentina | |
| Rest of South America | |
| Europe | United Kingdom |
| Germany | |
| France | |
| Italy | |
| Spain | |
| Rest of Europe | |
| Asia-Pacific | China |
| Japan | |
| India | |
| South Korea | |
| Australia | |
| Indonesia | |
| Thailand | |
| Malaysia | |
| Singapore | |
| Vietnam | |
| Rest of Asia-Pacific | |
| Middle East and Africa | Saudi Arabia |
| United Arab Emirates | |
| Turkey | |
| South Africa | |
| Egypt | |
| Rest of Middle East and Africa |
| By Insurance Product | Homeowners Insurance | |
| Renters Insurance | ||
| Landlord Insurance | ||
| Commercial Property Insurance | ||
| By Coverage Type | Building / Structural Property Coverage | |
| Contents / Business Personal Property Coverage | ||
| Business Interruption / Loss of Income Coverage | ||
| By Property Type | Residential Properties | |
| Commercial Properties | ||
| Industrial / Manufacturing | ||
| Public and Institutional | ||
| Agricultural Buildings | ||
| By Policyholder | Households (Owner-Occupiers and Tenants) | |
| Private Residential Landlords | ||
| Small and Medium-Sized Enterprise (SME) Occupiers | ||
| Large Enterprise Occupiers | ||
| Professional Real-Estate Owners | ||
| Public Sector / SOE | ||
| By Distribution Channel | Agents & Brokers | |
| Direct / Insurer-Owned Channels | ||
| Bancassurance & Other Financial Institutions Channels | ||
| Embedded / Affinity | ||
| By Geography | North America | United States |
| Canada | ||
| Mexico | ||
| South America | Brazil | |
| Argentina | ||
| Rest of South America | ||
| Europe | United Kingdom | |
| Germany | ||
| France | ||
| Italy | ||
| Spain | ||
| Rest of Europe | ||
| Asia-Pacific | China | |
| Japan | ||
| India | ||
| South Korea | ||
| Australia | ||
| Indonesia | ||
| Thailand | ||
| Malaysia | ||
| Singapore | ||
| Vietnam | ||
| Rest of Asia-Pacific | ||
| Middle East and Africa | Saudi Arabia | |
| United Arab Emirates | ||
| Turkey | ||
| South Africa | ||
| Egypt | ||
| Rest of Middle East and Africa | ||
Key Questions Answered in the Report
What is the projected size of the property insurance market by 2031?
The property insurance market is forecast to reach USD 946.3 billion by 2031, growing at a 4.8% CAGR from 2026.
Which insurance product is growing fastest through 2031?
Landlord insurance is the fastest-growing insurance product, with a forecast CAGR of 6.4% during 2026-2031.
Why is business interruption cover growing faster than other coverage types?
Business interruption cover is forecast to grow at a 6.1% CAGR as complex supply chains and high-value facilities increase the cost of operational downtime.
Which region has the strongest growth outlook?
Asia-Pacific is forecast to grow at a 6.5% CAGR through 2031, supported by India, China, and expanding commercial property activity across Southeast Asia.
How are insurers using artificial intelligence in property underwriting?
Insurers are using building sensor data, satellite imagery, permit records, and property-level hazard information to improve risk assessment and pricing.
What is the main challenge facing insurers in high-risk locations?
Rising loss costs, limited capacity, non-renewals, and affordability pressure make it harder to maintain broad private coverage in catastrophe-exposed locations.