
Presentation Attack Detection Market Size and Share
Market Overview
| Study Period | 2020 - 2031 |
|---|---|
| Market Size (2026) | USD 1.74 Billion |
| Market Size (2031) | USD 5.27 Billion |
| Growth Rate (2026 - 2031) | 24.81 % |
| Fastest Growing Market | Asia-Pacific |
| Largest Market | North America |
| Market Concentration | Medium |
Major Players *Disclaimer: Major Players sorted in no particular order Image © Mordor Intelligence. Reuse requires attribution under CC BY 4.0. | |
Presentation Attack Detection Market Analysis by Mordor Intelligence
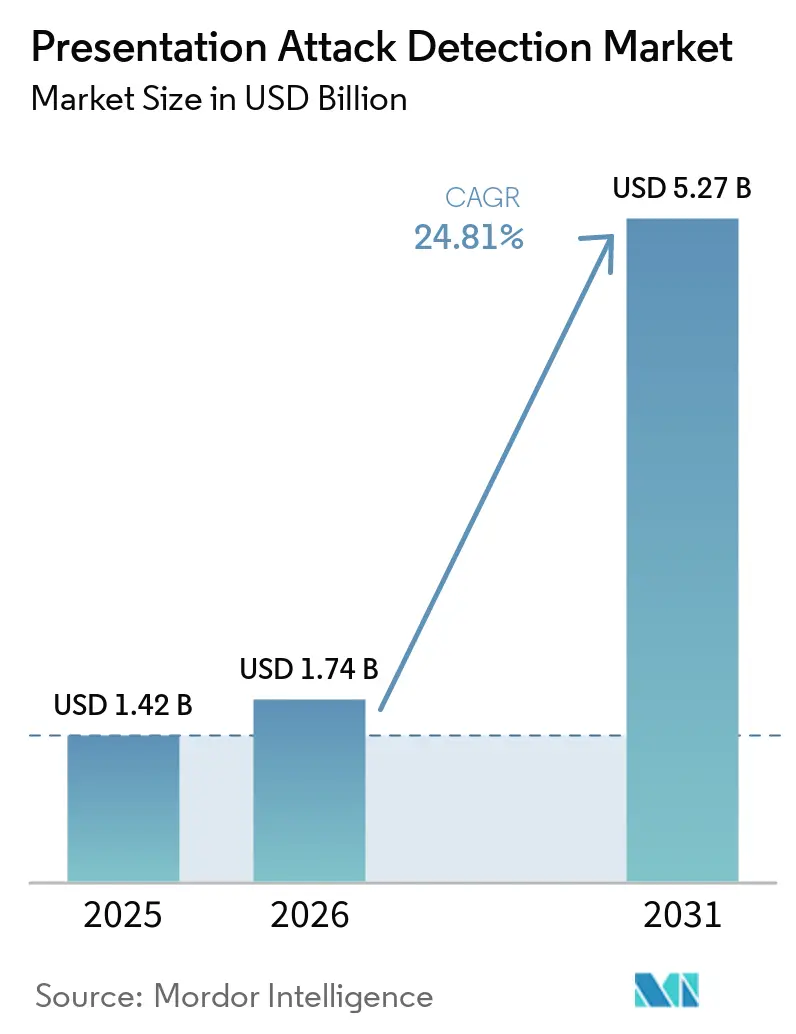
The presentation attack detection market size is projected to expand from USD 1.42 billion in 2025 and USD 1.74 billion in 2026 to USD 5.27 billion by 2031, registering a CAGR of 24.81% between 2026 to 2031. Remote identity verification has become a core requirement in financial services, healthcare, and government services, increasing demand for presentation attack detection across account opening, service access, benefit delivery, and customer authentication. Physical presentation attacks, digital injection attacks, and AI-generated deepfakes have widened the threat environment that identity systems must address at the camera, device, and software-channel levels. The presentation attack detection market benefits when digital identity wallets and remote onboarding rules create new requirements for proof of a live person, especially where a credential is issued or renewed without in-person contact. Vendors are competing through certification, detection performance, transparent testing, and the ability to update algorithms as attackers change their methods. Reusable APIs and pay-per-verification pricing are also bringing certified liveness controls within reach of smaller organizations that need to connect identity checks to existing applications without making a large upfront infrastructure investment.
Key Report Takeaways
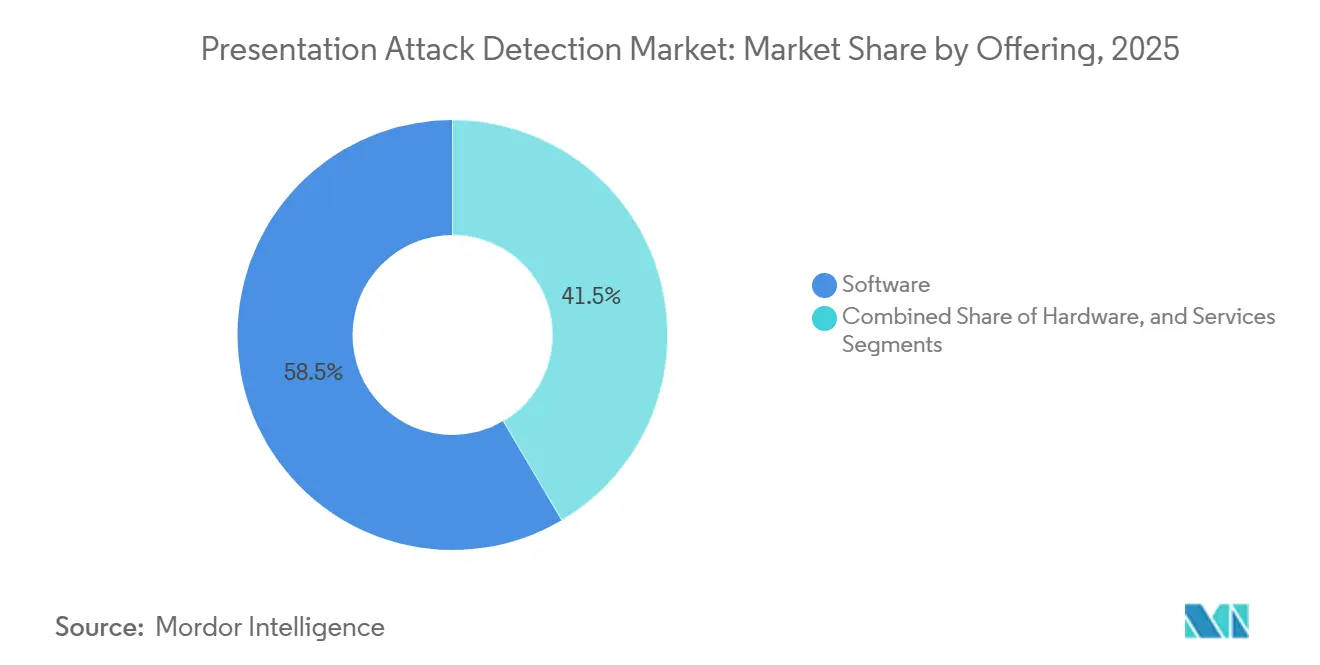
- By offering, software held 58.49% of the presentation attack detection market revenue in 2025, while services are projected to expand at a 27.18% CAGR through 2031.
- By protection layer, capture-point presentation attack detection accounted for 48.97% of revenue in 2025, while integrated PAD and injection-detection solutions are projected to grow at a 28.43% CAGR through 2031.
- By deployment, cloud held 61.74% of revenue in 2025, while hybrid deployment is projected to advance at a 25.87% CAGR through 2031.
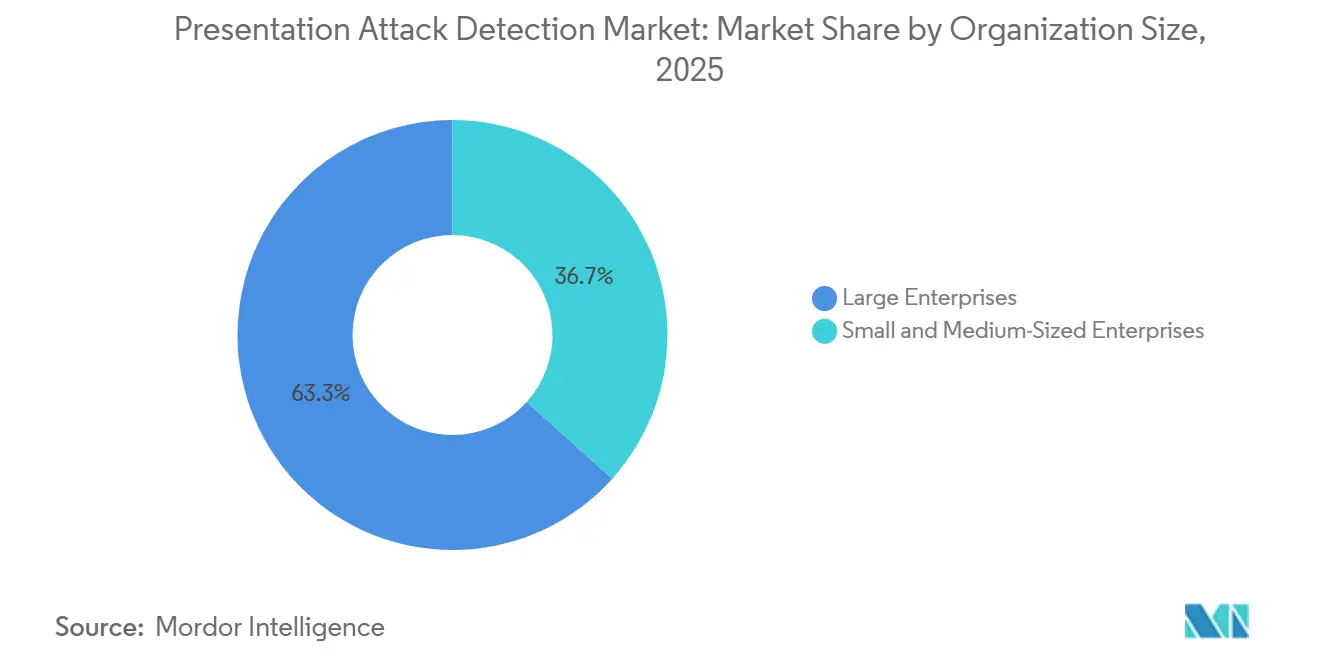
- By organization size, large enterprises held 63.34% of revenue in the presentation attack detection market in 2025, while small and medium-sized enterprises are projected to grow at a 28.12% CAGR through 2031.
- By end user, BFSI held 27.69% of revenue in 2025, while healthcare and life sciences are projected to expand at a 26.93% CAGR through 2031.
- By geography, North America held 38.53% of the presentation attack detection market share in 2025, while the Asia-Pacific is projected to expand at a 27.61% CAGR through 2031.
Note: Market size and forecast figures in this report are generated using Mordor Intelligence’s proprietary estimation framework, updated with the latest available data and insights as of January 2026.
Global Presentation Attack Detection Market Trends and Insights
Drivers Impact Analysis*
| DRIVER | (~) % IMPACT ON CAGR FORECAST | GEOGRAPHIC RELEVANCE | IMPACT TIMELINE |
|---|---|---|---|
| Expansion of Remote Identity Verification and Digital Onboarding | +5.5% | Global, particularly high in Asia-Pacific and Middle East and Africa | Short term (≤ 2 years) |
| Rising Biometric Fraud, Deepfake, and Replay Attack Incidence | +4.8% | Global, elevated in North American and European financial services | Short term (≤ 2 years) |
| Regulatory Adoption of Biometric Presentation Attack Detection Standards | +3.7% | Europe, North America, and Asia-Pacific core, with spillover to Middle East and Africa | Medium term (2-4 years) |
| Growth of Frictionless Authentication in Payments and Financial Services | +3.1% | Global, led by North America and Europe, with early gains in Singapore, India, and São Paulo | Medium term (2-4 years) |
| Camera and Sensor Improvements Enabling On-Device PAD | +2.4% | Asia-Pacific device manufacturing hub, with spillover to global OEM supply chains | Medium term (2-4 years) |
| Reusable PAD APIs for Digital Identity Platforms and Developer Ecosystems | +1.9% | Global, with early adoption in North American and European developer ecosystems | Long term (≥ 4 years) |
| Source: Mordor Intelligence | |||
Expansion of Remote Identity Verification and Digital Onboarding
Remote identity verification is moving from a differentiator for fintech providers to basic infrastructure across financial services, healthcare, and government services. This shift creates demand for the presentation attack detection market that does not depend only on changes in reported fraud events. NIST Special Publication 800-63-4 requires presentation-attack and injection-attack detection controls for federally compliant credential service providers in the United States. The requirement makes biometric liveness a procurement consideration for organizations pursuing Identity Assurance Level 2 or 3 services. The eIDAS 2.0 rollout has created a parallel requirement for member states to provide digital identity wallets that meet the High assurance level. These requirements extend liveness controls to wallet issuance programs that previously had no separate requirement for presentation attack detection.
Rising Biometric Fraud, Deepfake, and Replay Attack Incidence
The presentation attack detection market is responding to attacks that differ from the risks addressed by earlier biometric systems. Deepfake injection attacks route synthetic video into an authentication workflow instead of placing a false image or mask in front of a camera. The World Economic Forum documented a 783% increase in deepfake injection attacks in 2024 in its Cybercrime Atlas.[1]World Economic Forum, “Cybercrime Atlas,” World Economic Forum, weforum.org. The Federal Trade Commission reported USD 12.5 billion in total fraud losses during 2024, including USD 2.95 billion from imposter scams. This environment means that a face-matching result alone cannot establish that a video stream came from a genuine live sensor. Organizations are therefore using combinations of capture-point detection, injection detection, and device-integrity checks.
Regulatory Adoption of Biometric Presentation Attack Detection Standards
Standards bodies are moving from common definitions toward testing and certification requirements that influence procurement decisions. ISO/IEC 30107-3:2023 provides a framework for testing and reporting presentation attack detection performance.[2]Federal Trade Commission, “Consumer Sentinel Network Data Book 2024,” Federal Trade Commission, ftc.gov. The standard supports testing approaches used in NIST guidance, FIDO face verification programs, and European technical specifications. The presentation attack detection market is also being shaped by CEN/TS 18099:2024, which addresses injection attack detection as a separate threat area. These controls still have a necessary role in a layered design, since a system that only checks software-channel integrity would not identify a physical artifact shown to a genuine camera. China published GB/T 47519-2026 in April 2026 as a modified adoption of ISO/IEC 24741:2024, with implementation scheduled for November 2026. Separate testing pathways narrow the set of suppliers capable of demonstrating compliance with both presentation and injection risks.
Growth of Frictionless Authentication in Payments and Financial Services
Payment providers are increasing their use of passive liveness methods that do not require a customer to complete a visible challenge. Active challenges can add friction to onboarding and may be difficult for older people and people with disabilities. Passive methods allow teams to use an active check only when a transaction presents elevated risk. The Reserve Bank of India reported fraud losses of INR 21,367 crore, USD 2.56 billion, in the first half of fiscal year 2024-2025. These losses increase attention on identity controls in mobile banking and remote account opening. The presentation attack detection market also presents an emerging opportunity in continuous validation, as AI agents carry out actions for verified users.
Restraints Impact Analysis*
| RESTRAINT | (~) % IMPACT ON CAGR FORECAST | GEOGRAPHIC RELEVANCE | IMPACT TIMELINE |
|---|---|---|---|
| Privacy, Consent, and Biometric Data Governance Concerns | -3.2% | Europe, North America, and Australia | Short term (≤ 2 years) |
| False Rejection and Demographic Performance Risk | -2.6% | Global, elevated in India, Africa, and Southeast Asia | Medium term (2-4 years) |
| Adversarial Adaptation to Publicly Disclosed Detection Methods | -1.8% | Global, with highest risk in high-value financial and government deployments | Long term (≥ 4 years) |
| Fragmented Certification Interpretation Across Deployment Jurisdictions | -1.1% | Cross-border deployments across Europe, North America, and Asia-Pacific | Medium term (2-4 years) |
| Source: Mordor Intelligence | |||
Privacy, Consent, and Biometric Data Governance Concerns
Biometric templates cannot be replaced after compromise, unlike passwords. This makes data handling a central issue for buyers in the presentation attack detection market. The EU AI Act classifies certain biometric identification systems as high-risk and requires conformity assessments, database registration, and post-market monitoring. These obligations can lengthen buying cycles and increase compliance work for enterprises. Illinois BIPA and related laws in Texas and Washington have also increased exposure for organizations that process biometric data without explicit consent. Vendors with on-device, hybrid, or private-cloud products can address data residency needs while preserving the performance required for liveness detection.
False Rejection and Demographic Performance Risk
Liveness models trained on nonrepresentative datasets can reject legitimate users from some demographic groups at a higher rate. Older users, people with darker skin tones, and people with certain physical conditions can face a higher risk of rejection when testing is incomplete. ISO/IEC 19795-10 sets procedures for measuring demographic effects in biometric systems. NIST guidance also recognizes demographic testing as part of federal biometric system evaluation. A false rejection can lead to customer abandonment, delayed access to healthcare, or delayed benefit payments over time. Suppliers that publish demographic testing results alongside liveness certifications are better placed in regulated tenders.
*Our forecasts treat driver/restraint impacts as directional, not additive. The impact forecasts reflect baseline growth, mix effects, and variable interactions.
Segment Analysis
By Offering: Software Leads as Services Expand with Deployment Complexity
Software held 58.49% of the presentation attack detection market share in 2025. Software-based products can use cameras already installed in customer devices, branch networks, and enterprise environments, avoiding the procurement cycle for new sensors. They can receive model updates soon after providers identify a new attack instrument or a change in attacker behavior. This capability gives software suppliers a faster response cycle than products that depend on replacing dedicated hardware across many locations. Cloud delivery strengthens this approach because updated detection models can be distributed without changes to physical devices, local installations, or customer hardware inventories.
Services are projected to record a 27.18% CAGR from 2026 to 2031. Managed operations, integration support, red-team assessments, API orchestration, and ongoing configuration assistance are included in this category. Organizations often need help connecting liveness tools with identity proofing, fraud monitoring, account opening, and customer onboarding processes. They must also manage requirements associated with ISO/IEC 30107-3, CEN/TS 18099, NIST guidance, and FIDO certification. Demand for services reflects the continuing management requirements of multi-standard and multi-vendor deployments, rather than simply a lack of maturity in software products. Service providers must also help customers establish escalation procedures, testing plans, and ownership between fraud, identity, security, and customer operations teams, because live performance affects each of these functions.



By Protection Layer: Integrated Defense Gains Ground as Attack Surfaces Converge
Capture-point presentation attack detection held 48.97% of the presentation attack detection market in 2025. This layer addresses printed photographs, display replays, and 3D masks that an attacker presents to a physical camera during enrollment or authentication. Financial institutions, public agencies, and consumer identity providers have used these controls for many years in remote and in-person identity workflows. Its established deployment base supports its position as the largest protection layer because physical spoofing remains a relevant risk for camera-based verification. Digital injection and capture-channel protection addresses synthetic content sent through virtual cameras, USB cameras, function hooks, or other software routes. This method can bypass capture-point controls because the physical camera is never involved in creating the video stream. These controls still have a necessary role in a layered design, since a system that only checks software-channel integrity would not identify a physical artifact shown to a genuine camera.
Integrated PAD and injection-detection solutions are projected to grow at a 28.43% CAGR through 2031. These products combine camera-facing liveness checks with protection against manipulated video entering the authentication software channel. The design responds to the growing importance of deepfake injection attacks in the presentation attack detection market and the need to protect both attack surfaces. The World Economic Forum reported that deepfake injection attacks increased 783% in 2024. A single integrated supplier can reduce the operational burden of managing separate contracts, evaluations, certification paths, and incident-response procedures. Aware reported zero successful injection exploits across 600 attempts in its May 2026 BixeLab evaluation aligned with CEN/TS 18099:2024. The result also shows why buyers are asking for testing evidence that reflects virtual camera, rooted-device, and other injection conditions, rather than relying only on legacy physical-spoofing test results.
By Deployment: Cloud Dominates While Hybrid Addresses Data Sovereignty Pressures
Cloud deployment held 61.74% of the presentation attack detection market share in 2025. Cloud services allow providers to scale liveness verification across applications and customer locations without installing dedicated infrastructure at every customer site. They also make it easier to distribute continuous model updates as new presentation and injection methods emerge. Amazon Rekognition Face Liveness and Azure Face Liveness documentation describe cloud-delivered liveness capabilities for application teams building identity workflows.[3]Microsoft, “Face Liveness Detection Concept,” Microsoft Learn, learn.microsoft.com. These tools can reduce the time and specialist infrastructure needed for a mid-sized organization to deploy an identity check. On-premises processing remains important in defense, law enforcement, intelligence, and other settings with biometric data classifications, government security rules, or air-gapped operating requirements. These buyers can also place value on direct control of the capture device, the biometric processing environment, and audit records when the service is used in a sensitive operational setting.
Hybrid deployment is projected to grow at a 25.87% CAGR from 2026 to 2031. A hybrid configuration can conduct biometric inference locally or on-device while using cloud systems for workflow management, audit functions, and service orchestration. This separation helps organizations balance application scalability with data residency requirements and controlled processing of sensitive biometric templates. India’s Digital Personal Data Protection Act has added to the focus on secure handling of personal data. Cross-border healthcare onboarding and multinational financial services can benefit when local biometric processing is combined with centrally managed identity workflows. The presentation attack detection industry therefore has a role for cloud, on-premises, and hybrid models rather than a single deployment path. The appropriate model depends on the buyer’s operating environment, the sensitivity of biometric data, the need for frequent model updates, and the geographic locations in which the service will be used.
By Organization Size: Enterprise Spend Leads While SMEs Accelerate
Large enterprises held 63.34% of the presentation attack detection market in 2025. Large financial institutions, public agencies, and healthcare systems can support the integration, compliance, and operating work required for enterprise liveness programs. They frequently purchase these capabilities as a part of wider identity governance or fraud-control contracts rather than as isolated products. Internal identity assurance teams, security operations centers, and multi-jurisdiction compliance obligations also support larger budgets and more formal procurement processes. These buyers require documented controls, repeatable performance, audit evidence, and consistent user experiences across many customer and employee journeys. Their purchasing decisions often combine fraud prevention, customer experience, security operations, and regulatory requirements. This makes large organizations the current revenue base for specialist liveness suppliers. Their programs commonly cover enrollment, authentication, account recovery, transaction approval, and other identity decisions, which means suppliers must demonstrate reliable performance across a wider set of operating conditions than a single application pilot.
Small and medium-sized enterprises are projected to grow at a 28.12% CAGR through 2031. Reusable SDKs, APIs, and pay-per-verification pricing reduce the upfront cost of deploying certified liveness capabilities. These approaches allow smaller organizations to purchase a service level aligned with their transaction volume rather than maintain a dedicated biometric infrastructure. The presentation attack detection market can therefore reach firms that previously lacked the capital, engineering staff, or deployment scale for dedicated systems. ISO/IEC 30107-3 Level 2 testing has become an important expectation in financial services and government procurement.[4]Ministry of Electronics and Information Technology, “Digital Personal Data Protection Act 2023,” Government of India, meity.gov.in. Platform providers that embed certified controls into turnkey identity tools can extend access to regulatory-grade checks. The adoption path follows earlier identity technology cycles, where large organizations deployed systems first and smaller users followed as developer tools improved. This transition can increase adoption in online services where the organization needs an effective identity check but cannot maintain specialist biometric teams or invest in a large one-time deployment.
By End User: BFSI Anchors Revenue as Healthcare Scales Rapidly
BFSI accounted for 27.69% of the presentation attack detection market in 2025. KYC processes, anti-money-laundering requirements, account-opening controls, and identity assurance rules have made liveness verification a routine consideration for banks, insurers, and payment providers. The FIDO Face Verification Certification Program has also provided a common reference point for financial-sector identity products and supplier assessment. The Reserve Bank of India recorded INR 21,367 crore, USD 2.56 billion, in fraud losses in the first half of fiscal year 2024-2025. Government and public administration are also major buyers because remote access to benefits, national identity programs, border control, and welfare delivery require reliable proof of presence. The presentation attack detection market supports these use cases where a standard face match cannot independently confirm live capture. Financial institutions use this added assurance when opening accounts remotely, approving high-risk activity, recovering access, or validating a customer before a sensitive transaction is completed.
The healthcare and life sciences industry is projected to expand at a 26.93% CAGR from 2026 to 2031. Telehealth onboarding, remote patient access, electronic prescribing, insurance claims, and clinical service access create practical applications for liveness controls. Each workflow needs confidence that a verified person is present at the time of access, enrollment, prescription, or transaction. Retail and e-commerce are also adopting passive liveness for age checks, account recovery, and high-value payment authentication. IT and telecommunications demand is supported by biometric SIM registration requirements, including South Korea’s facial recognition requirement effective July 6, 2026. Defense and law enforcement have high-value requirements for multimodal liveness using face, fingerprint, iris, and voice modalities. These deployments require suppliers to consider different sensors, operating environments, user populations, and attack types, which makes integration and testing important parts of the deployment process.
Geography Analysis
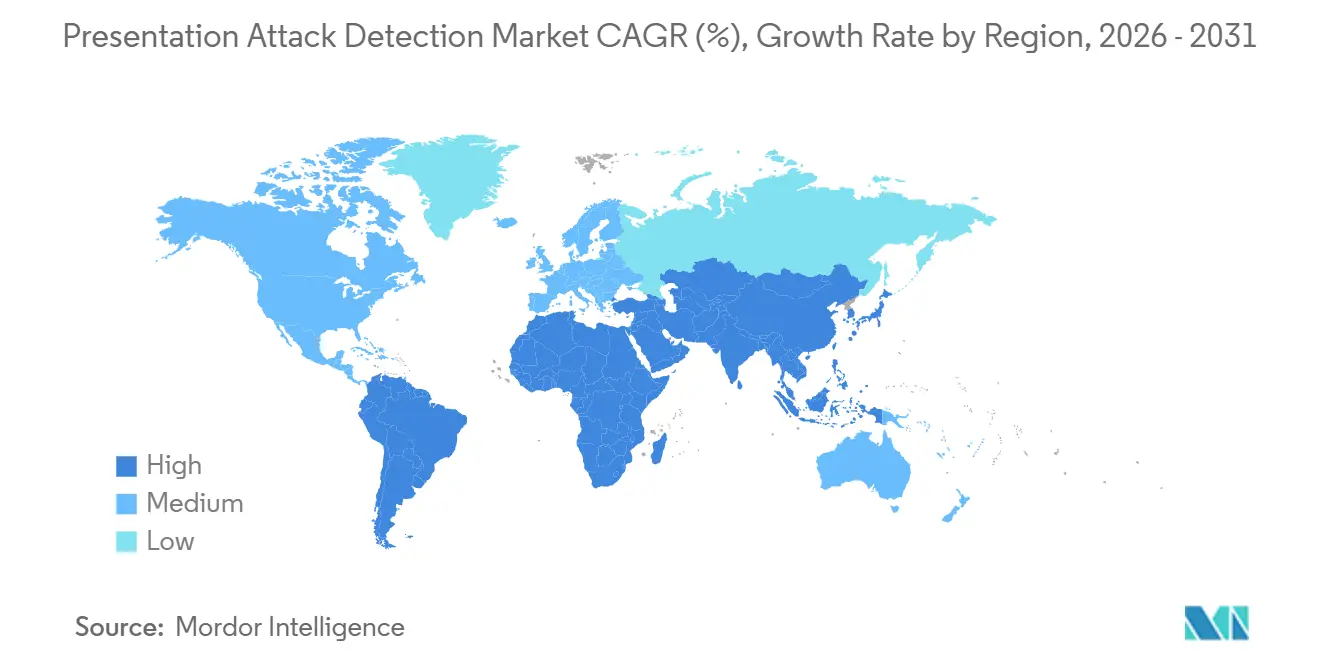
North America held 38.53% of global revenue in 2025. The region is supported by U.S. federal identity guidance and a large population of financial institutions operating at higher assurance levels. NIST Special Publication 800-63-4 requires presentation and injection attack controls for federally compliant credential services. The United States leads regional demand through financial compliance programs and identity assurance infrastructure. Canada adds procurement activity through its Digital Identity Program and provincial electronic identity work. State biometric privacy laws also shape product design because enterprise buyers need data minimization, encryption, and consent records.
Europe is being shaped by the EU AI Act and eIDAS 2.0 digital wallet requirements. The EU AI Act establishes obligations for high-risk biometric systems, including conformity assessment and post-market monitoring. eIDAS 2.0 requires member states to provide digital wallets at the High assurance level. The United Kingdom, Germany, and France remain the largest national markets in the region. France’s France 2030 program funded CLR Labs in January 2026 for work related to biometric and digital identity standardization. This investment supports the development of ISO/IEC 25456 for injection attack detection and can influence future supplier qualification.
Asia-Pacific is projected to grow at a 27.61% CAGR from 2026 to 2031. India’s Aadhaar system supports demand across banking, telecommunications, and public services because it operates at very large biometric identity scale. China published GB/T 47519-2026 in April 2026 and is aligning domestic biometric deployment with international standards.[5]Standardization Administration of China, “GB/T 47519-2026 Information Technology Biometrics Overview and Application,” Standardization Administration of China, gb-gbt.com. South Korea’s July 2026 SIM registration change added a telecommunications use case for liveness verification. Japan, Singapore, Indonesia, and Australia contribute through digital identity reform and financial-sector KYC modernization. South America offers demand led by Brazil’s financial technology sector, while Colombia and Argentina are expanding digital inclusion programs. The Middle East is led by the United Arab Emirates and Saudi Arabia through national digital identity programs, and Africa has early-stage demand tied to SIM registration and KYC policy discussions. Interpol reported AI involvement in 55% of reported African cybercrimes during 2025 and noted deepfake incidents rose sevenfold between Q2 and Q4 2024.

Competitive Landscape
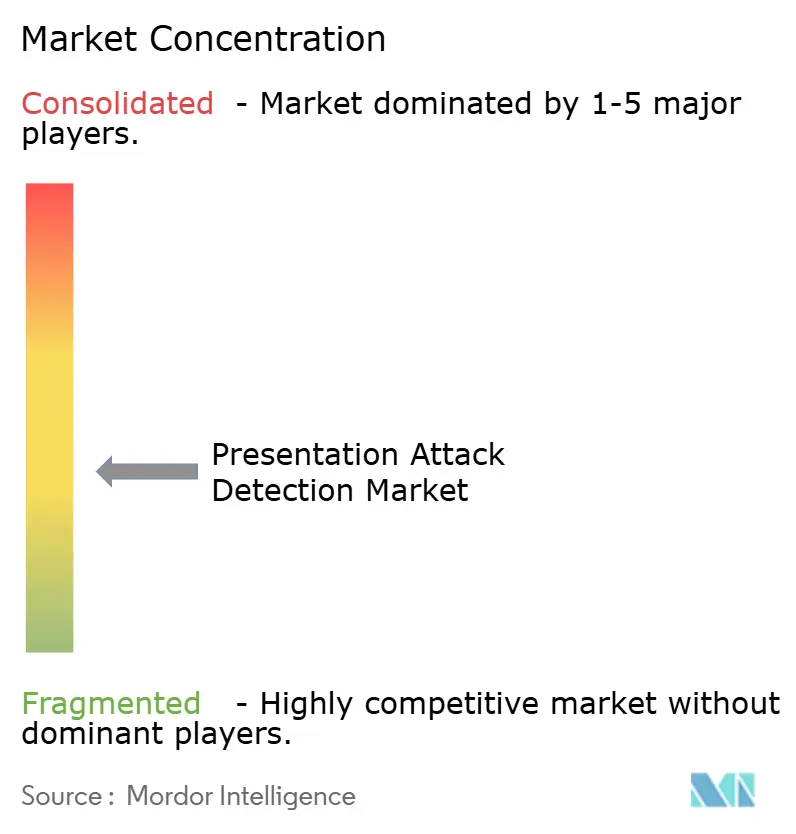
The presentation attack detection market has a moderately fragmented platform tier and includes a certified group of specialist biometric suppliers, as well as a more fragmented group of integrators, platforms, and regional providers. Specialist suppliers with ISO/IEC 30107-3 Level 2 or higher credentials are more likely to compete for financial services and government contracts. Injection attack detection validation is becoming another important qualification for those buyers. FIDO certification, U.S. Department of Homeland Security evaluations, and laboratory testing provide additional evidence used in procurement. These credentials create a higher entry threshold because suppliers need mature products, time, and funding to complete independent evaluations. The presentation attack detection market is, therefore, more concentrated in high-assurance contracts than in white-label and integration work.
iProov has used its Dynamic Liveness product and third-party evaluations to support compliance-oriented positioning. Its February 2026 announcement stated that it combined CEN/TS 18099 Level 2 High injection attack detection certification with FIDO Face Verification PAD certification. Jumio completed ISO/IEC 30107-3 Level 2 compliance certification for its in-house liveness technology in October 2025. FaceTec’s June 2026 patent decision reinforced the value of proprietary 3D liveness methods. Vendors are using certification, product testing, research activity, and protected technology to differentiate their offerings. These moves can improve buyer confidence when liveness performance is difficult to assess before deployment.
Opportunities remain in continuous verification and delegated authentication for AI agents, where established certification and deployment models are still limited. Multimodal liveness is another area of competition for buyers who need face, fingerprint, iris, and voice checks. These requirements are most relevant to defense, law enforcement, and healthcare settings that need assurance beyond a face-only workflow. Daon filed a five-patent architecture in August 2026 for quantum-ready digital identity, including measures against injection and replay. Continued alignment with ISO/IEC 30107-3 and the forthcoming ISO/IEC 25456 standard will remain relevant to regulated procurement. The presentation attack detection market remains open to new suppliers, but qualification demands limit access to the most regulated contracts.
Presentation Attack Detection Industry Leaders
Aware, Inc.
BioID GmbH
Daon, Inc.
Facephi Biometria, S.A.
FaceTec, Inc.
- *Disclaimer: Major Players sorted in no particular order

Recent Industry Developments
- March 2026: iProov reported surpassing 1 million daily identity verification transactions in 2025, and its Dynamic Liveness technology became the first solution to achieve Ingenium Level 4 evaluation under CEN/TS 18099 High for injection attack detection. The company also expanded its deployment footprint to include U.S. Customs and Border Protection's Enhanced Passenger Processing system at Aruba Airport and Orlando International Airport.
- November 2025: iProov became the first biometric vendor to satisfy NIST SP 800-63-4's dual requirements for presentation attack detection and injection attack detection, combining CEN/TS 18099 Level 2 High IAD certification from Ingenium Biometrics with FIDO Face Verification PAD certification. The dual-standard achievement established a compliance benchmark for federal digital identity program procurement.
- October 2025: Jumio achieved ISO/IEC 30107-3 Level 2 compliance certification for its in-house Jumio Liveness technology through iBeta, an NIST/NVLAP-accredited laboratory, validating resilience against printed photos, screen displays, and 3D masks. The in-house development represented a shift from its prior reliance on third-party liveness providers.
- June 2025: Jumio launched Jumio Liveness Premium, incorporating patented active illumination and AI-driven analysis for real-time protection against deepfakes and injection attacks. The product is backed by a portfolio exceeding 300 issued patents and patent applications spanning nearly 100 patent families.


Global Presentation Attack Detection Market Report Scope
The presentation attack detection market comprises hardware and software solutions designed to detect and prevent spoofing attempts against biometric sensors by analyzing whether the presented biometric trait originates from a live human or a fake artifact, such as a printed photograph, video replay, 3D mask, or synthetic replica. These systems employ techniques including liveness detection, texture analysis, depth sensing, micro-movement tracking, and challenge-response mechanisms across fingerprint, facial, iris, and voice biometric modalities to distinguish genuine users from presentation attacks, enabling organizations to secure identity verification processes in banking, border control, mobile devices, and access control applications while complying with ISO/IEC 30107 PAD standards and regulatory requirements for biometric authentication security.
The Presentation Attack Detection Market Report is Segmented by Offering (Software, Hardware, and Services), Protection Layer (Capture-Point Presentation Attack Detection, Digital Injection and Capture-Channel Protection, and Integrated PAD and Injection-Detection Solutions), Deployment (Cloud, On-Premises, and Hybrid), Organization Size (Large Enterprises, and Small and Medium-Sized Enterprises), End User (Banking, Financial Services, and Insurance (BFSI), Government and Public Administration, Healthcare and Life Sciences, Retail and E-Commerce, IT and Telecommunications, Transportation and Logistics, Media and Entertainment, Education and Research Institutions, Defense and Law Enforcement, and Other End Users), and Geography (North America, South America, Europe, Asia-Pacific, Middle East, and Africa). The Market Forecasts are Provided in Terms of Value (USD).
| Software |
| Hardware |
| Services |
| Capture-Point Presentation Attack Detection |
| Digital Injection and Capture-Channel Protection |
| Integrated PAD and Injection-Detection Solutions |
| Cloud |
| On-Premises |
| Hybrid |
| Large Enterprises |
| Small and Medium-Sized Enterprises |
| Banking, Financial Services, and Insurance (BFSI) |
| Government and Public Administration |
| Healthcare and Life Sciences |
| Retail and E-Commerce |
| IT and Telecommunications |
| Transportation and Logistics |
| Media and Entertainment |
| Other End Users |
| North America | United States |
| Canada | |
| Mexico | |
| South America | Brazil |
| Argentina | |
| Colombia | |
| Rest of South America | |
| Europe | United Kingdom |
| Germany | |
| France | |
| Italy | |
| Spain | |
| Russia | |
| Rest of Europe | |
| Asia-Pacific | China |
| India | |
| Japan | |
| South Korea | |
| Singapore | |
| Indonesia | |
| Australia | |
| Rest of Asia-Pacific | |
| Middle East | United Arab Emirates |
| Saudi Arabia | |
| Israel | |
| Turkey | |
| Rest of Middle East | |
| Africa | South Africa |
| Nigeria | |
| Egypt | |
| Rest of Africa |
| By Offering | Software | |
| Hardware | ||
| Services | ||
| By Protection Layer | Capture-Point Presentation Attack Detection | |
| Digital Injection and Capture-Channel Protection | ||
| Integrated PAD and Injection-Detection Solutions | ||
| By Deployment | Cloud | |
| On-Premises | ||
| Hybrid | ||
| By Organization Size | Large Enterprises | |
| Small and Medium-Sized Enterprises | ||
| By End User | Banking, Financial Services, and Insurance (BFSI) | |
| Government and Public Administration | ||
| Healthcare and Life Sciences | ||
| Retail and E-Commerce | ||
| IT and Telecommunications | ||
| Transportation and Logistics | ||
| Media and Entertainment | ||
| Other End Users | ||
| By Geography | North America | United States |
| Canada | ||
| Mexico | ||
| South America | Brazil | |
| Argentina | ||
| Colombia | ||
| Rest of South America | ||
| Europe | United Kingdom | |
| Germany | ||
| France | ||
| Italy | ||
| Spain | ||
| Russia | ||
| Rest of Europe | ||
| Asia-Pacific | China | |
| India | ||
| Japan | ||
| South Korea | ||
| Singapore | ||
| Indonesia | ||
| Australia | ||
| Rest of Asia-Pacific | ||
| Middle East | United Arab Emirates | |
| Saudi Arabia | ||
| Israel | ||
| Turkey | ||
| Rest of Middle East | ||
| Africa | South Africa | |
| Nigeria | ||
| Egypt | ||
| Rest of Africa | ||


Key Questions Answered in the Report
What is the presentation attack detection market size?
The presentation attack detection market size is projected to expand from USD 1.42 billion in 2025 and USD 1.74 billion in 2026 to USD 5.27 billion by 2031, registering a CAGR of 24.81% between 2026 to 2031.
What is driving demand for presentation attack detection?
Remote onboarding, digital identity wallet requirements, biometric fraud, and deepfake injection attacks are increasing the need for liveness controls. These factors affect financial services, healthcare, government programs, and other workflows that depend on remote proof of identity.
Which offering leads presentation attack detection adoption?
Software led with 58.49% of revenue in 2025 because it can work with existing cameras and receive remote model updates. This approach supports faster responses when providers identify new physical spoofing or software-injection techniques.
Which deployment model is growing fastest for liveness verification?
Hybrid deployment is projected to grow at a 25.87% CAGR through 2031, supported by data residency and scalability needs. It can keep biometric inference in a controlled environment while supporting cloud-based workflow and audit functions.
Which end-user sector is the largest buyer of liveness detection?
BFSI held 27.69% of revenue in 2025, supported by KYC, anti-money-laundering, and fraud prevention needs. Banks, insurers, and payment providers need added assurance during account opening, authentication, and higher-risk transactions.
Which region is expected to grow fastest through 2031?
Asia-Pacific is projected to expand at a 27.61% CAGR, supported by large digital identity systems and financial-sector KYC modernization. India, China, South Korea, Japan, Singapore, Indonesia, and Australia each contribute through different public and commercial identity programs.
Page last updated on:


 Your data is secure and never sold or shared.


