
Precision Cancer Imaging Market Size and Share
Market Overview
| Study Period | 2021 - 2032 |
|---|---|
| Market Size (2027) | USD 16.46 Billion |
| Market Size (2032) | USD 29.62 Billion |
| Growth Rate (2027 - 2032) | 12.47 % |
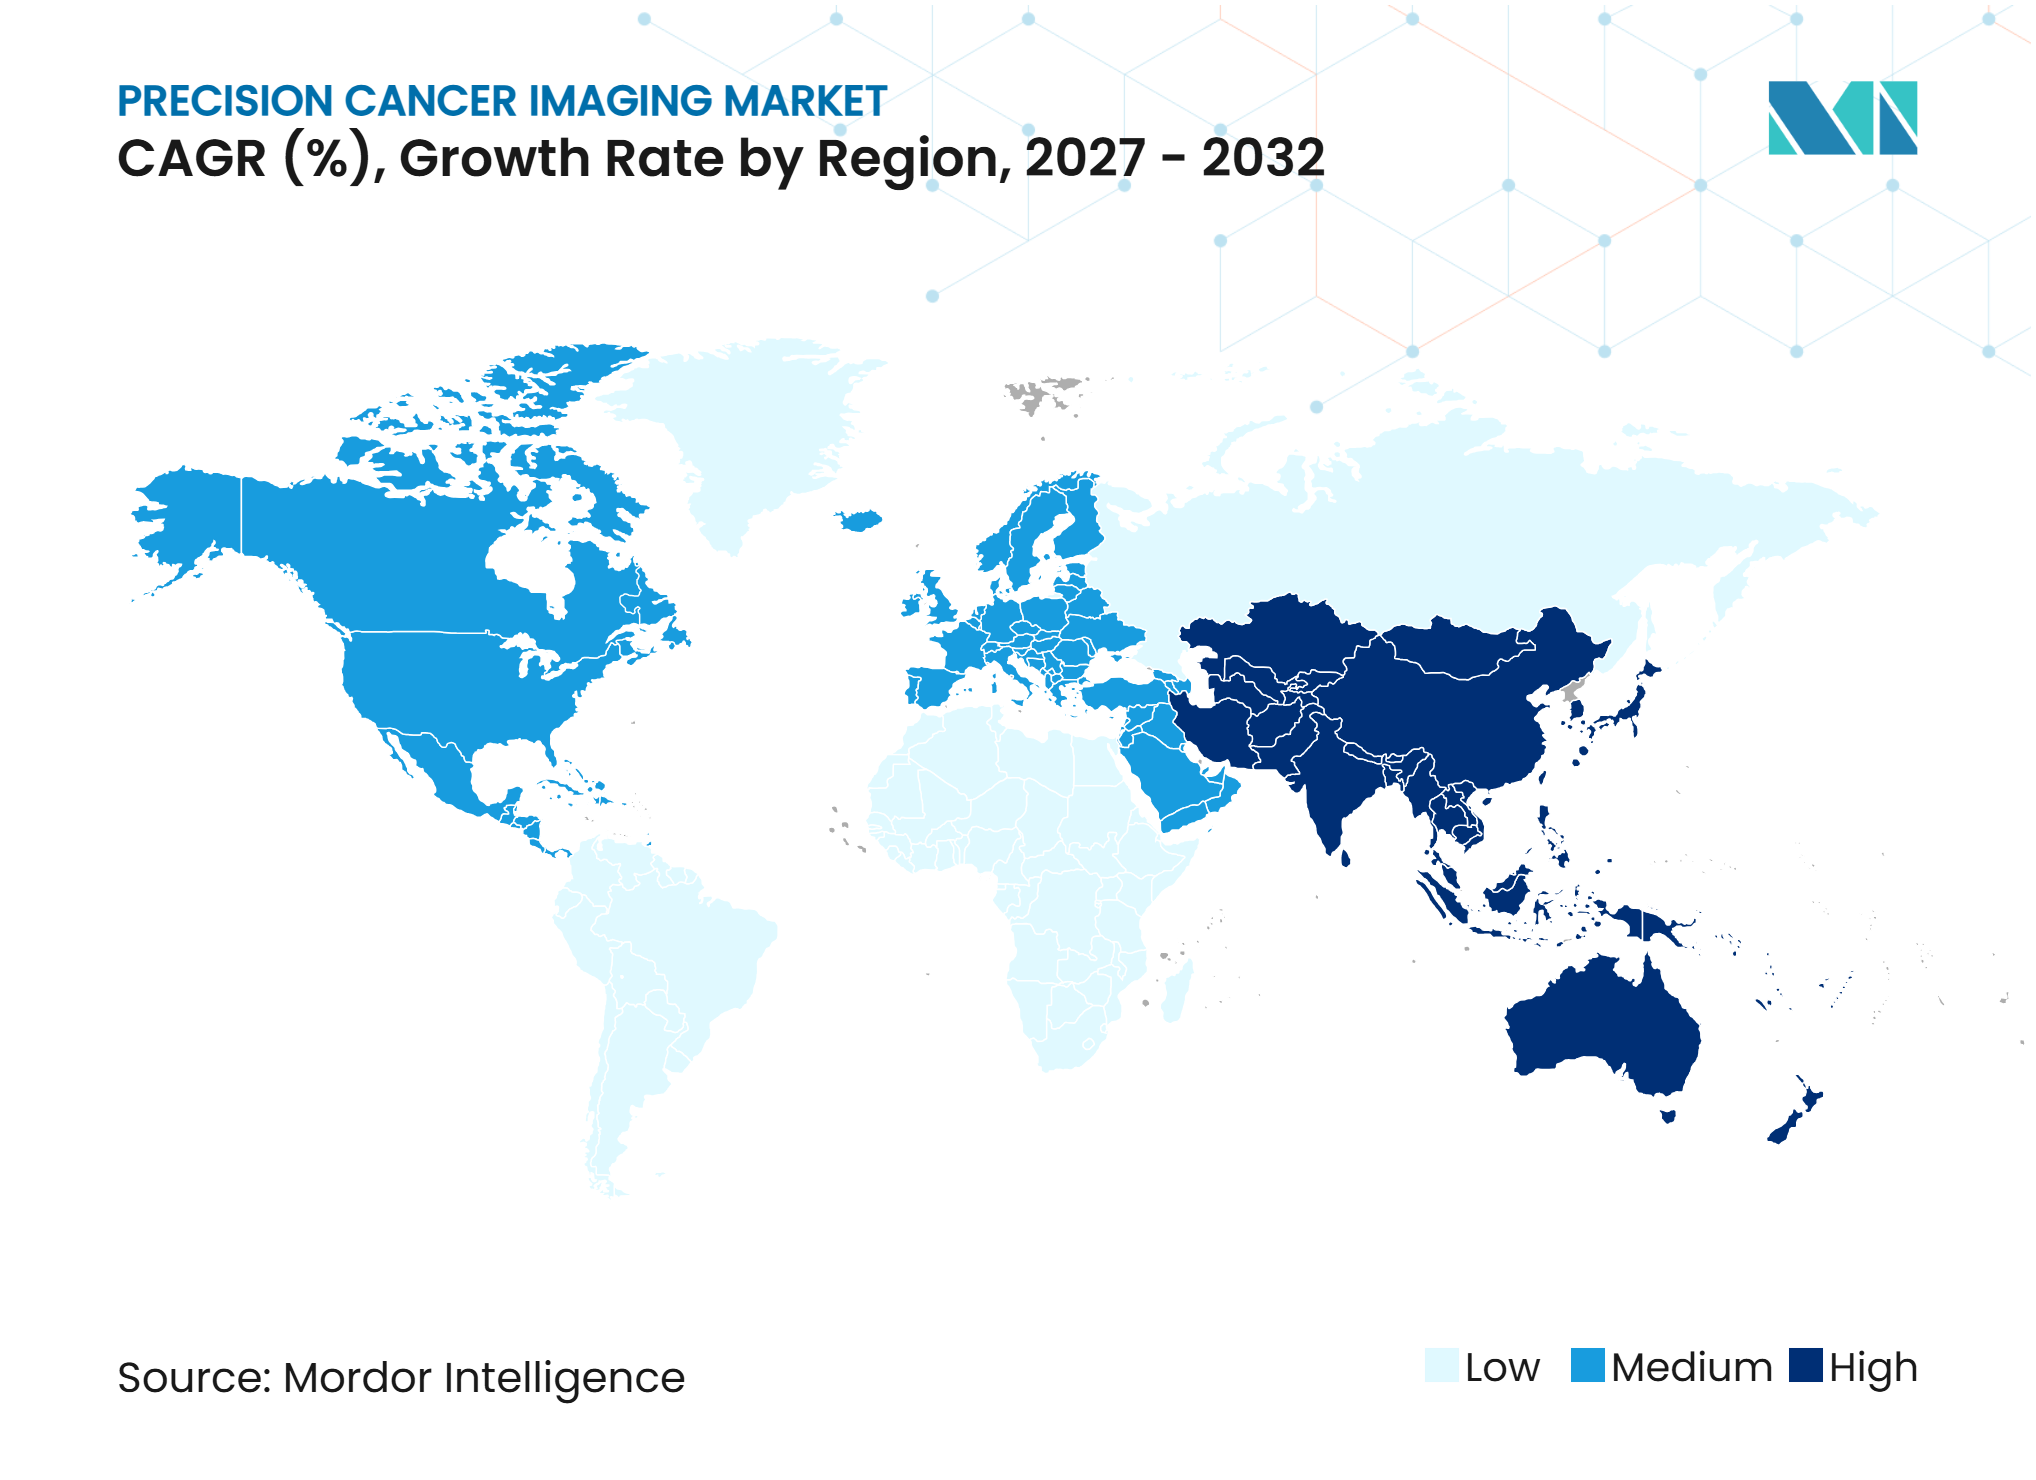
| Fastest Growing Market | Asia-Pacific |
| Largest Market | North America |
| Market Concentration | High |
Major Players *Disclaimer: Major Players sorted in no particular order Image © Mordor Intelligence. Reuse requires attribution under CC BY 4.0. | |
Precision Cancer Imaging Market Analysis by Mordor Intelligence
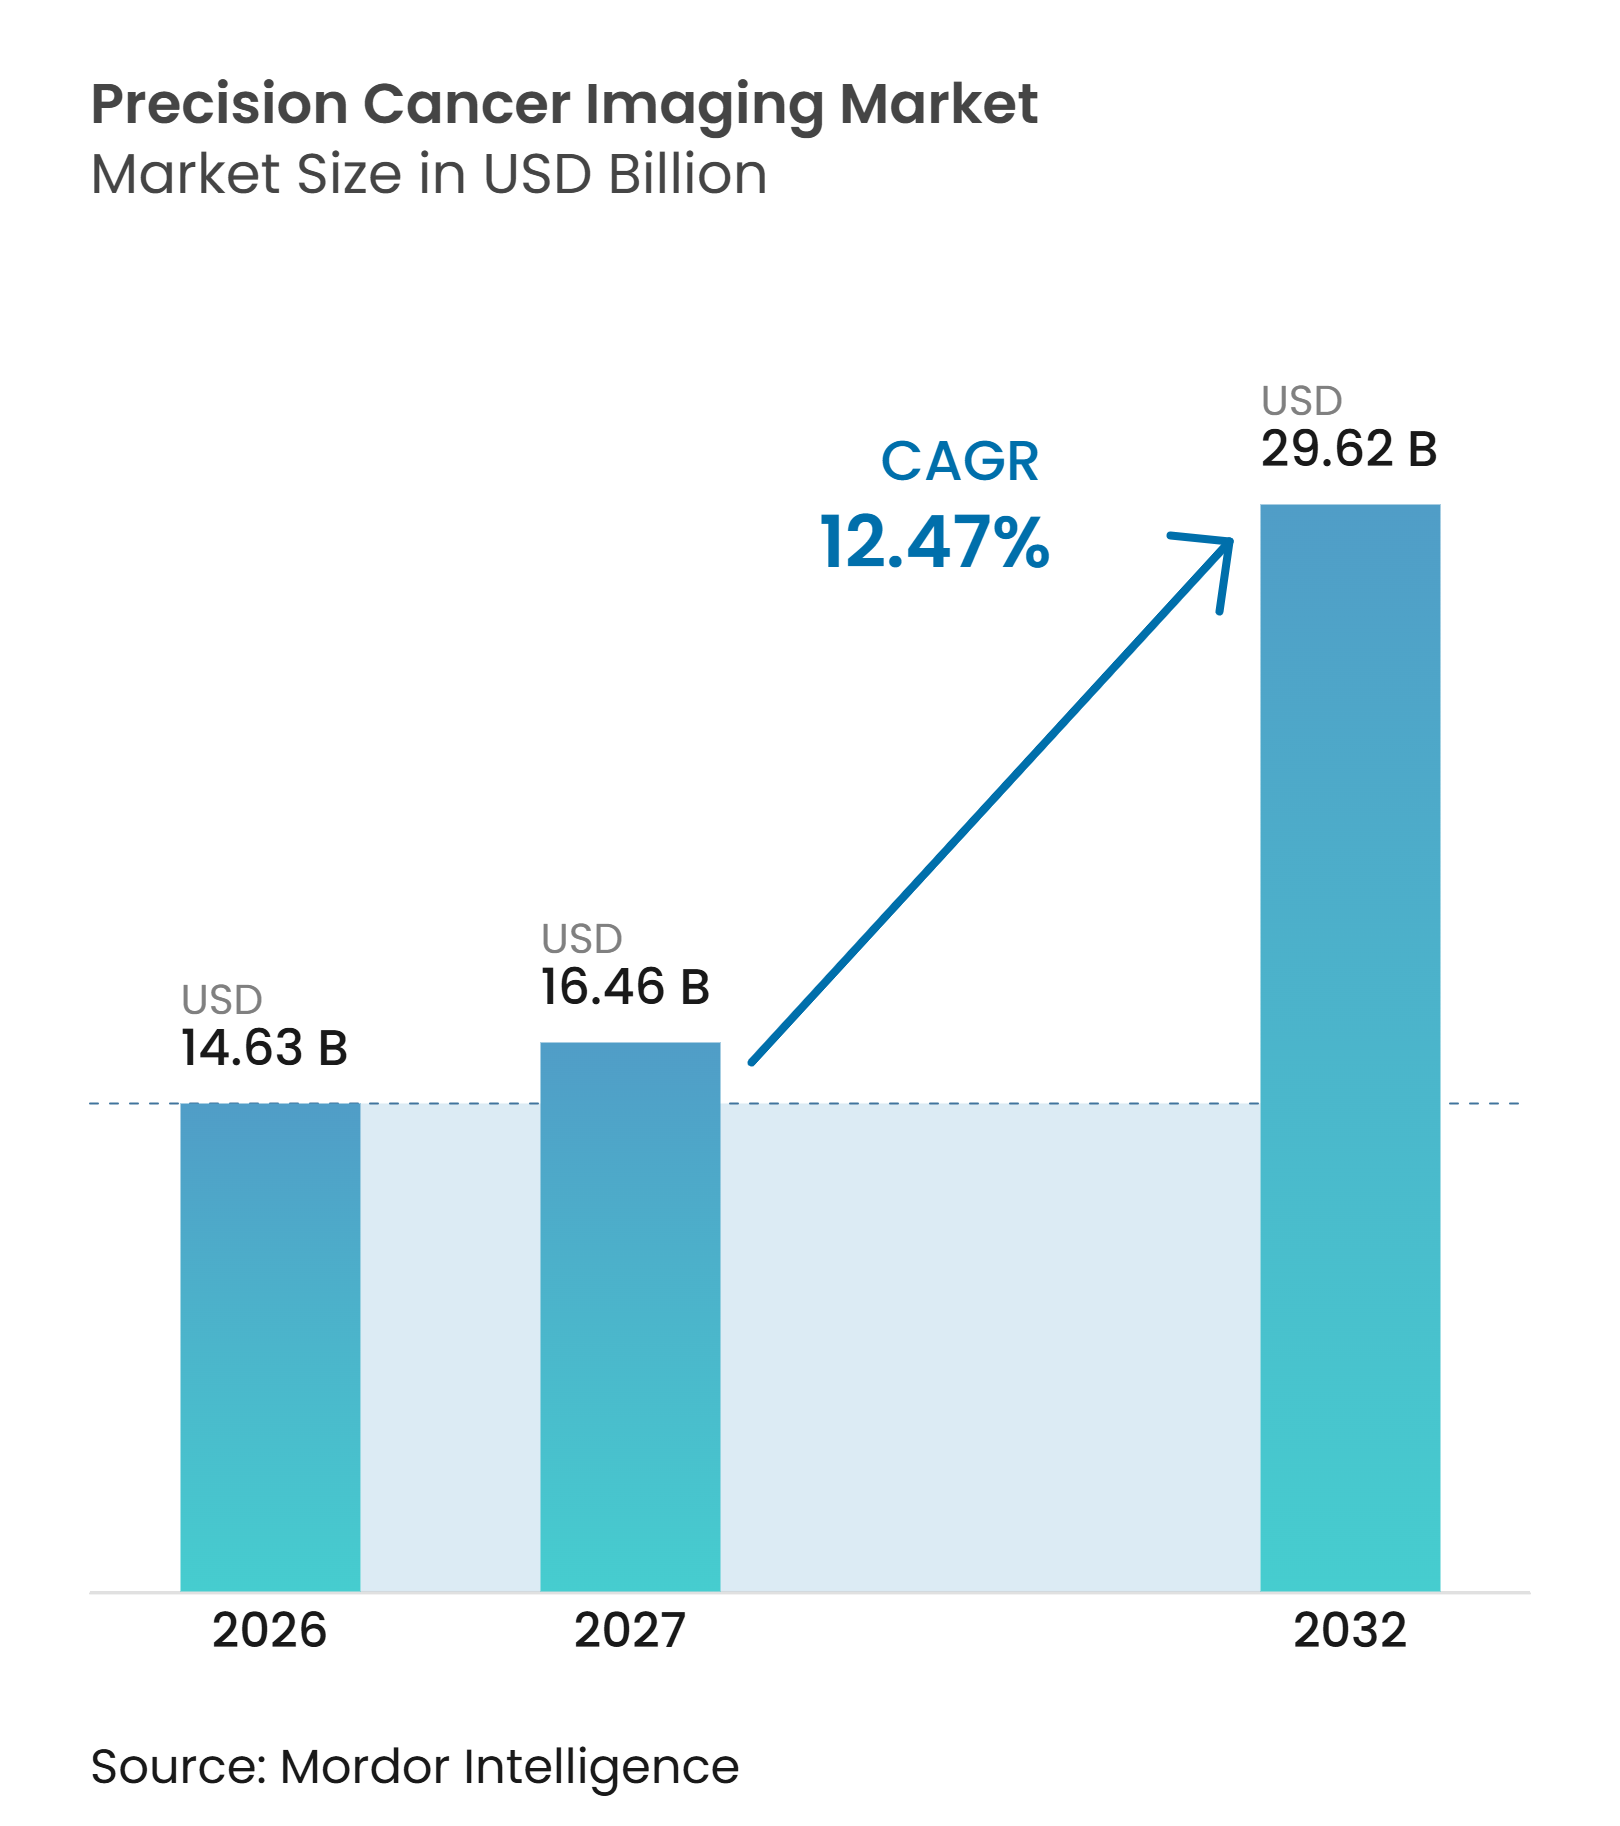
The precision cancer imaging market size is projected to expand from USD 14.63 billion in 2026 to USD 29.62 billion by 2032, registering a CAGR of 12.47% between 2027 and 2032. The precision cancer imaging market is being shaped by rising cancer incidence, wider use of biomarker-led diagnosis, and the growing role of artificial intelligence in imaging workflows. Cancer imaging is becoming part of treatment selection, response assessment, and follow-up rather than remaining a single diagnostic event. This change supports recurring scan demand, particularly where molecular imaging is required before and during radioligand therapy. Equipment suppliers are extending their offers into software, clinical services, and radiopharmaceutical infrastructure, while specialist software and tracer suppliers seek a place in the same oncology pathways. The precision cancer imaging market also faces limits from high equipment costs, shortages of qualified nuclear medicine staff, and uneven reimbursement for radiomics tools outside North America.
Key Report Takeaways
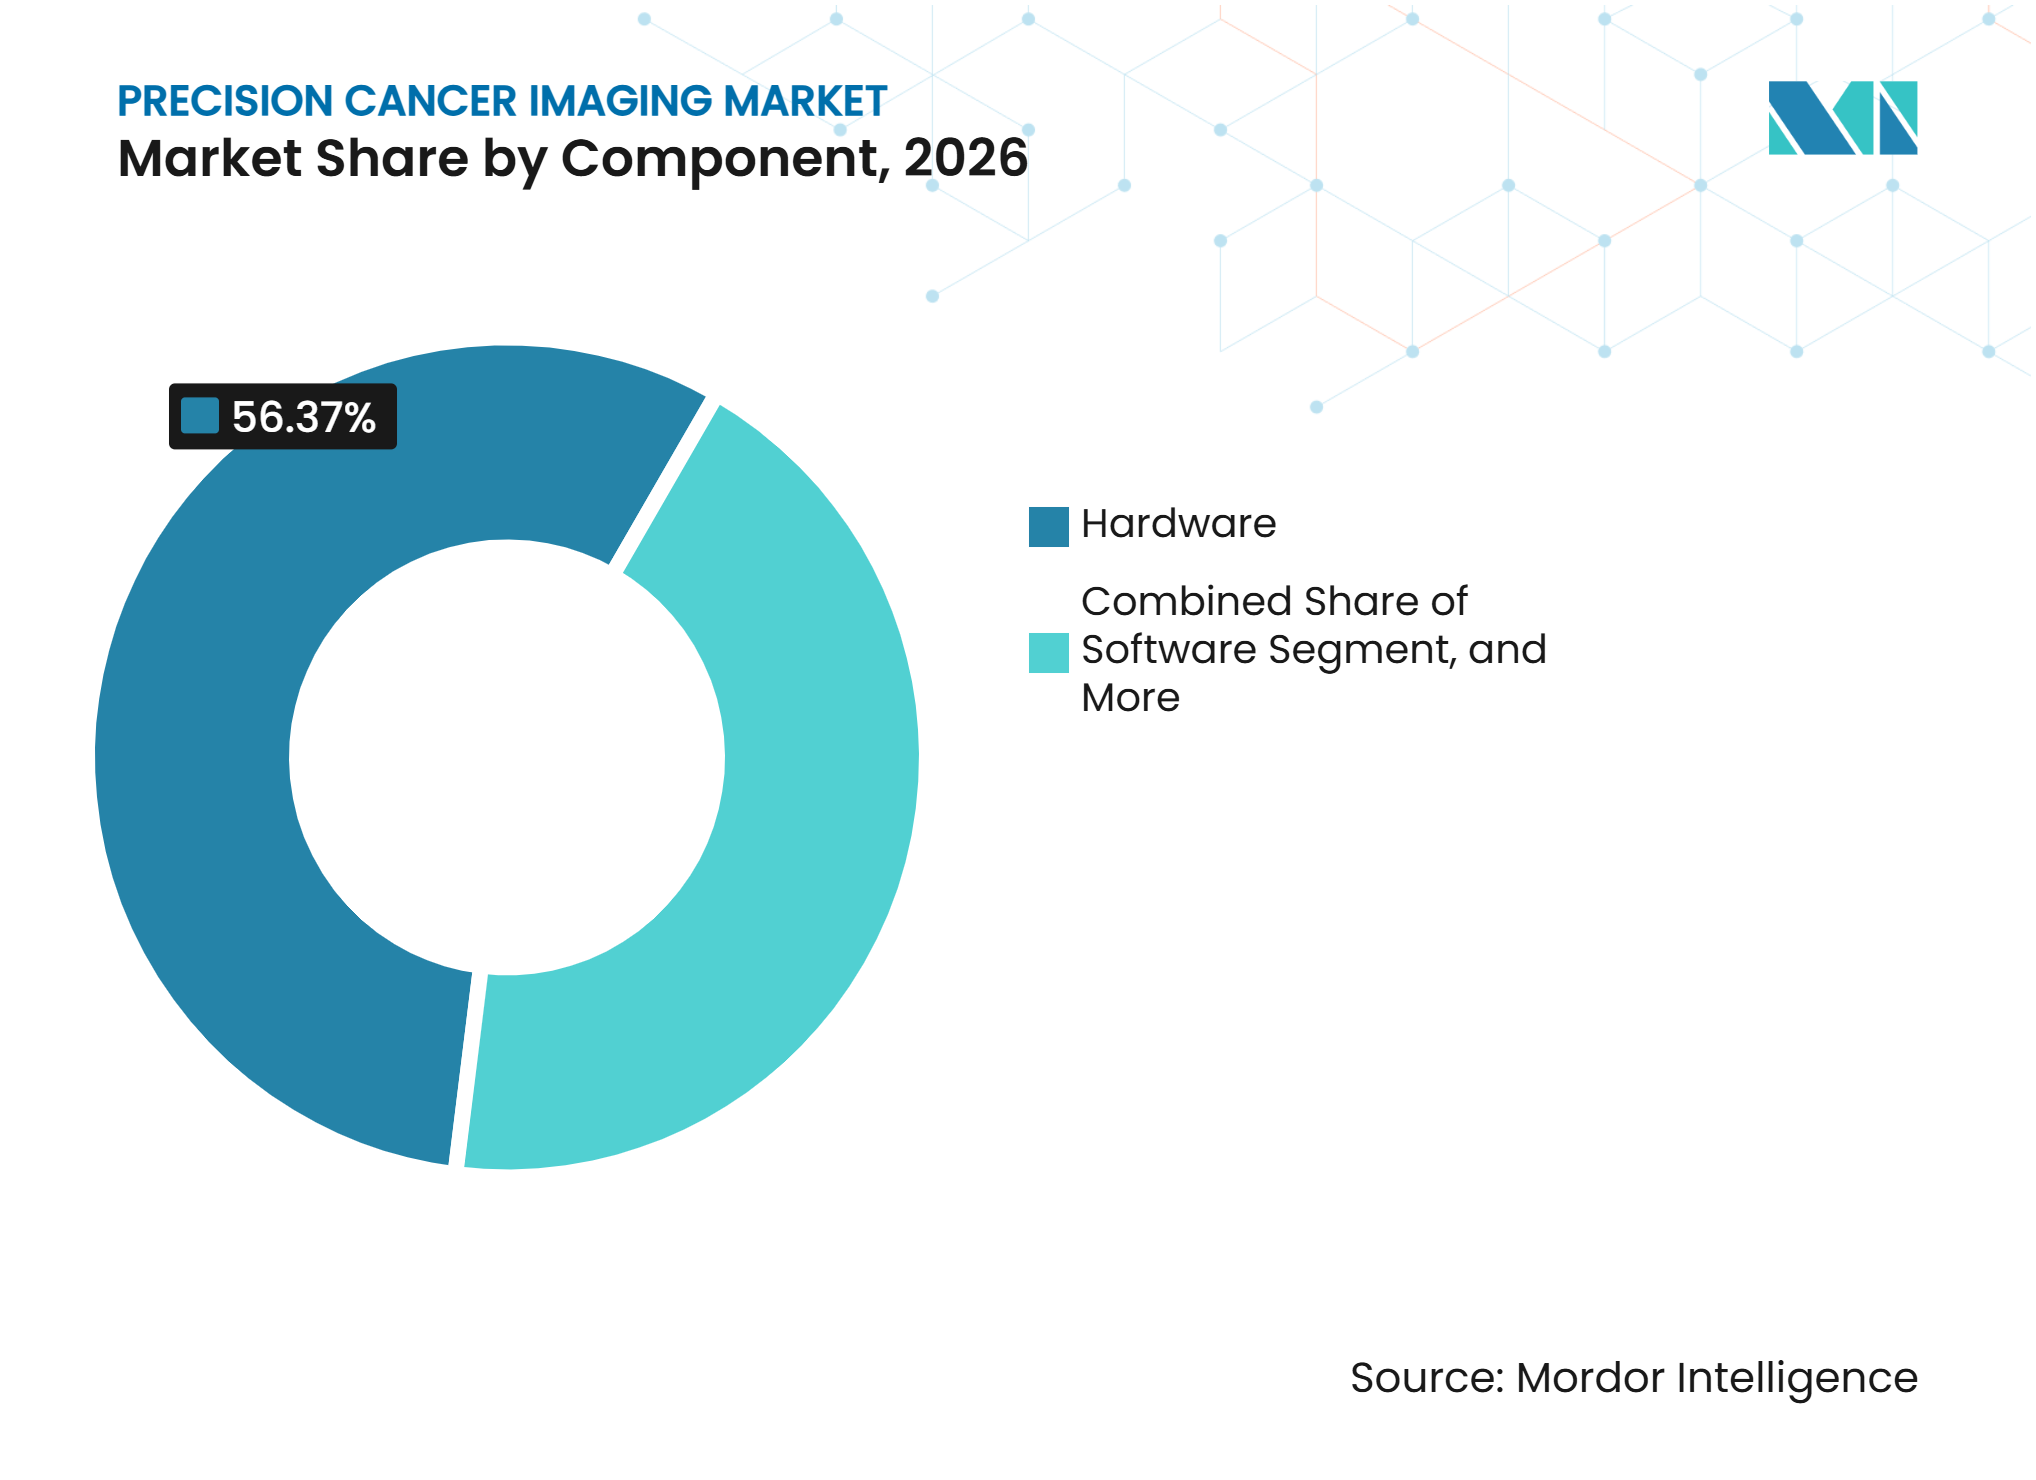
- By component, hardware held a 56.37% revenue share in 2026, while software is forecast to expand at a 12.81% CAGR through 2032 in the precision cancer imaging market.
- By imaging modality, Positron Emission Tomography (PET) held 33.47% revenue share in 2026, while MRI is forecast to expand at a 13.42% CAGR through 2032.
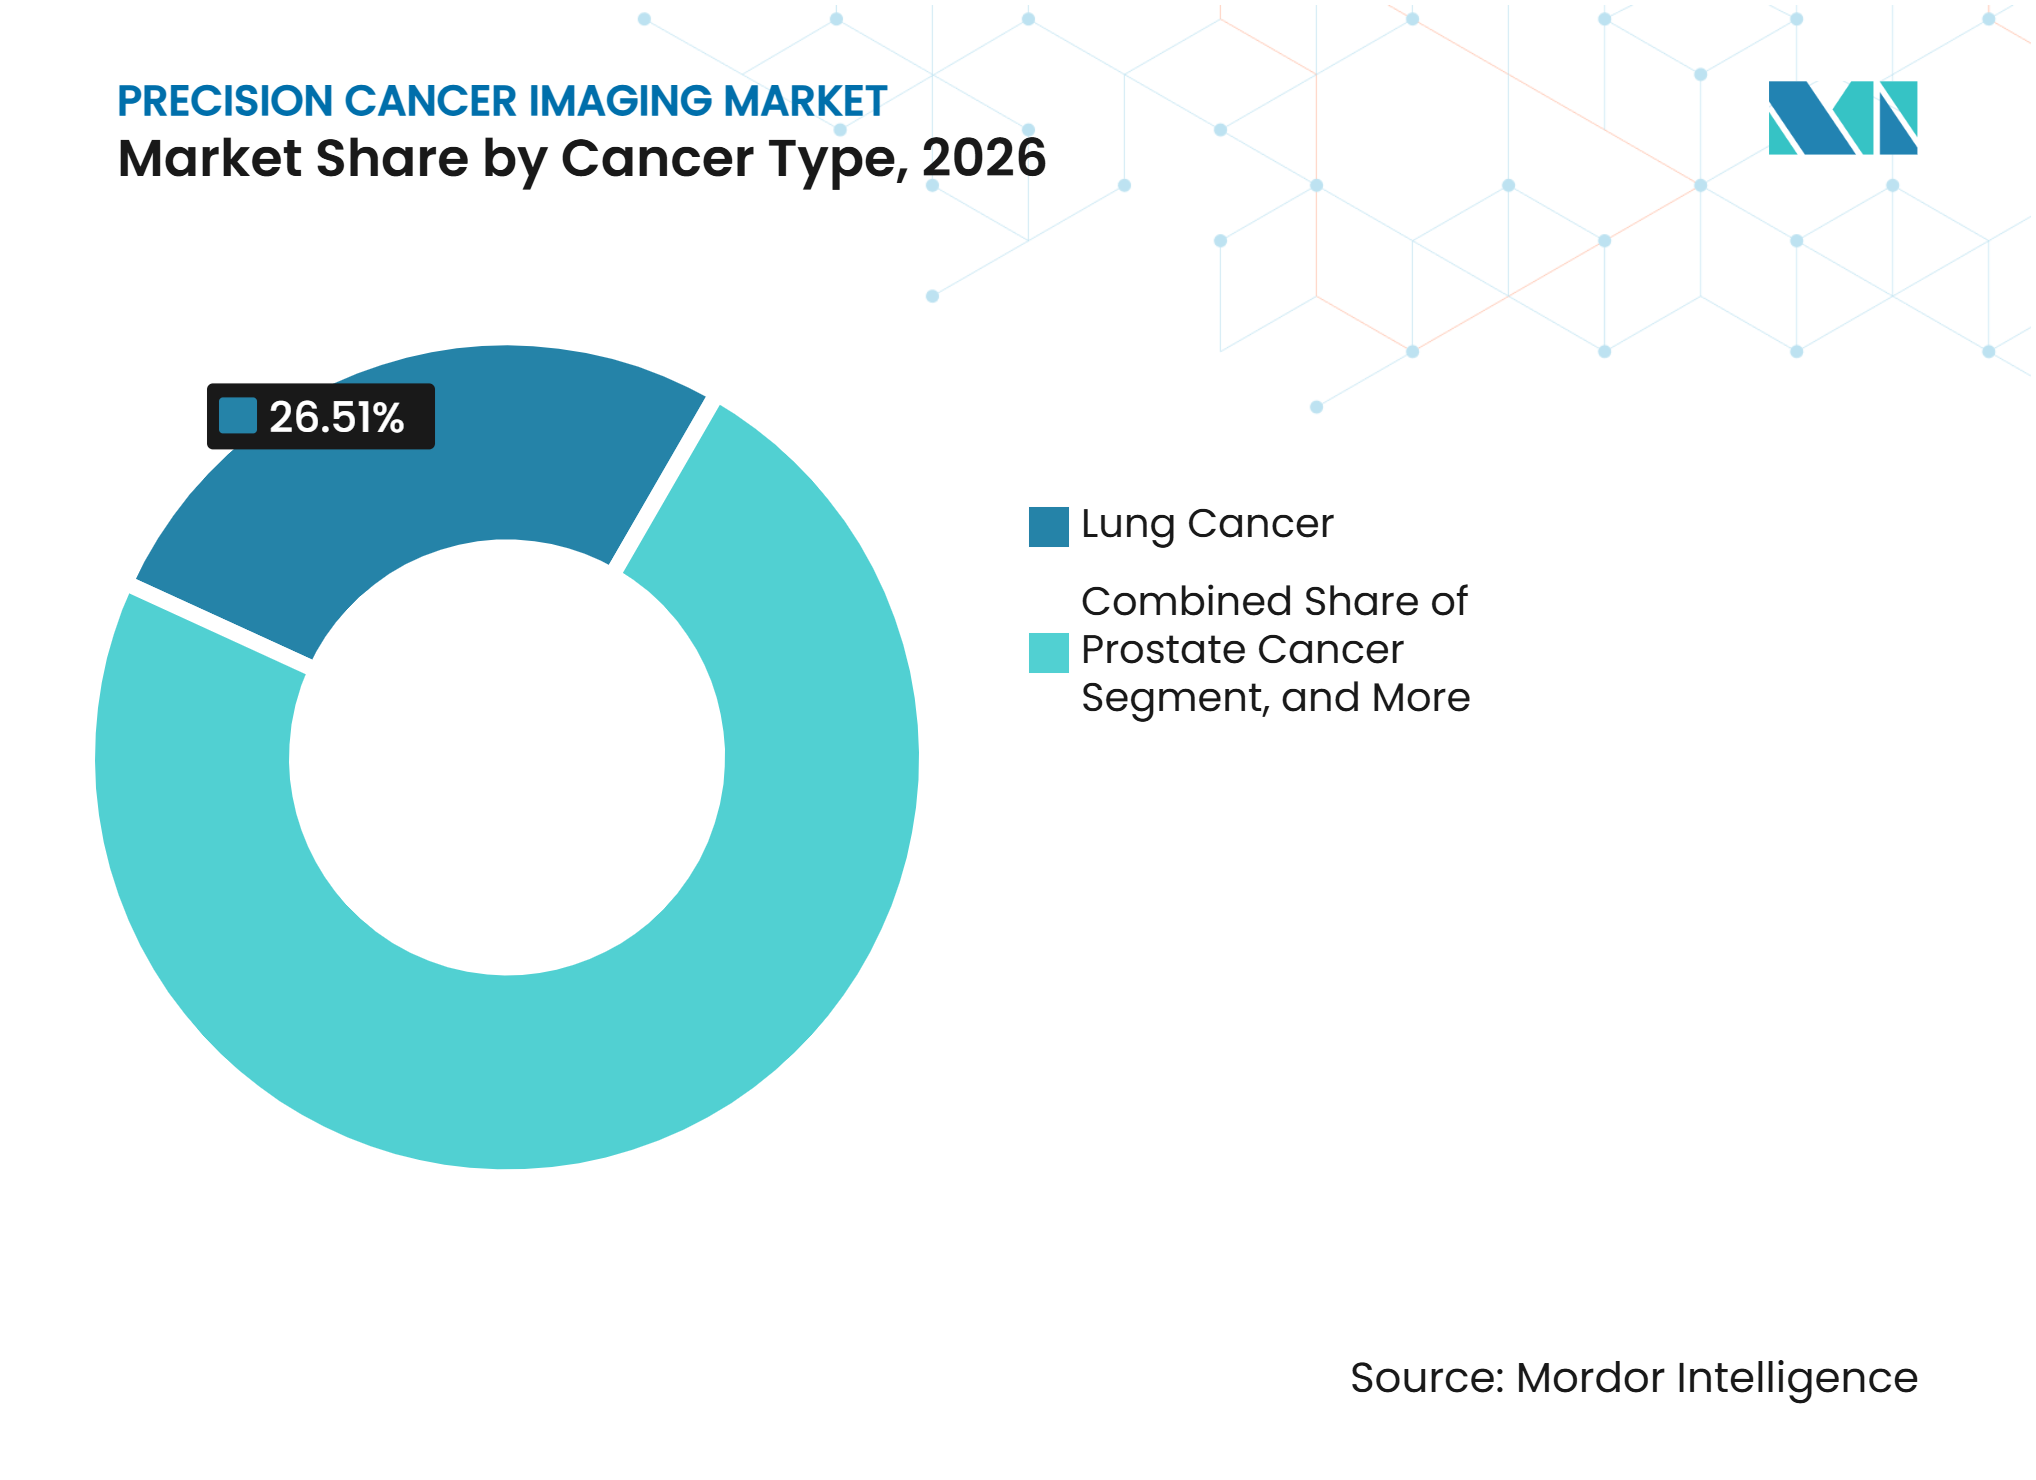
- By cancer type, lung cancer held 26.51% revenue share in 2026, while prostate cancer is forecast to expand at a 13.69% CAGR through 2032 in the precision cancer imaging market.
- By application, diagnosis and staging held 37.91% revenue share in 2026, while treatment monitoring and response assessment is forecast to expand at a 14.43% CAGR through 2032.
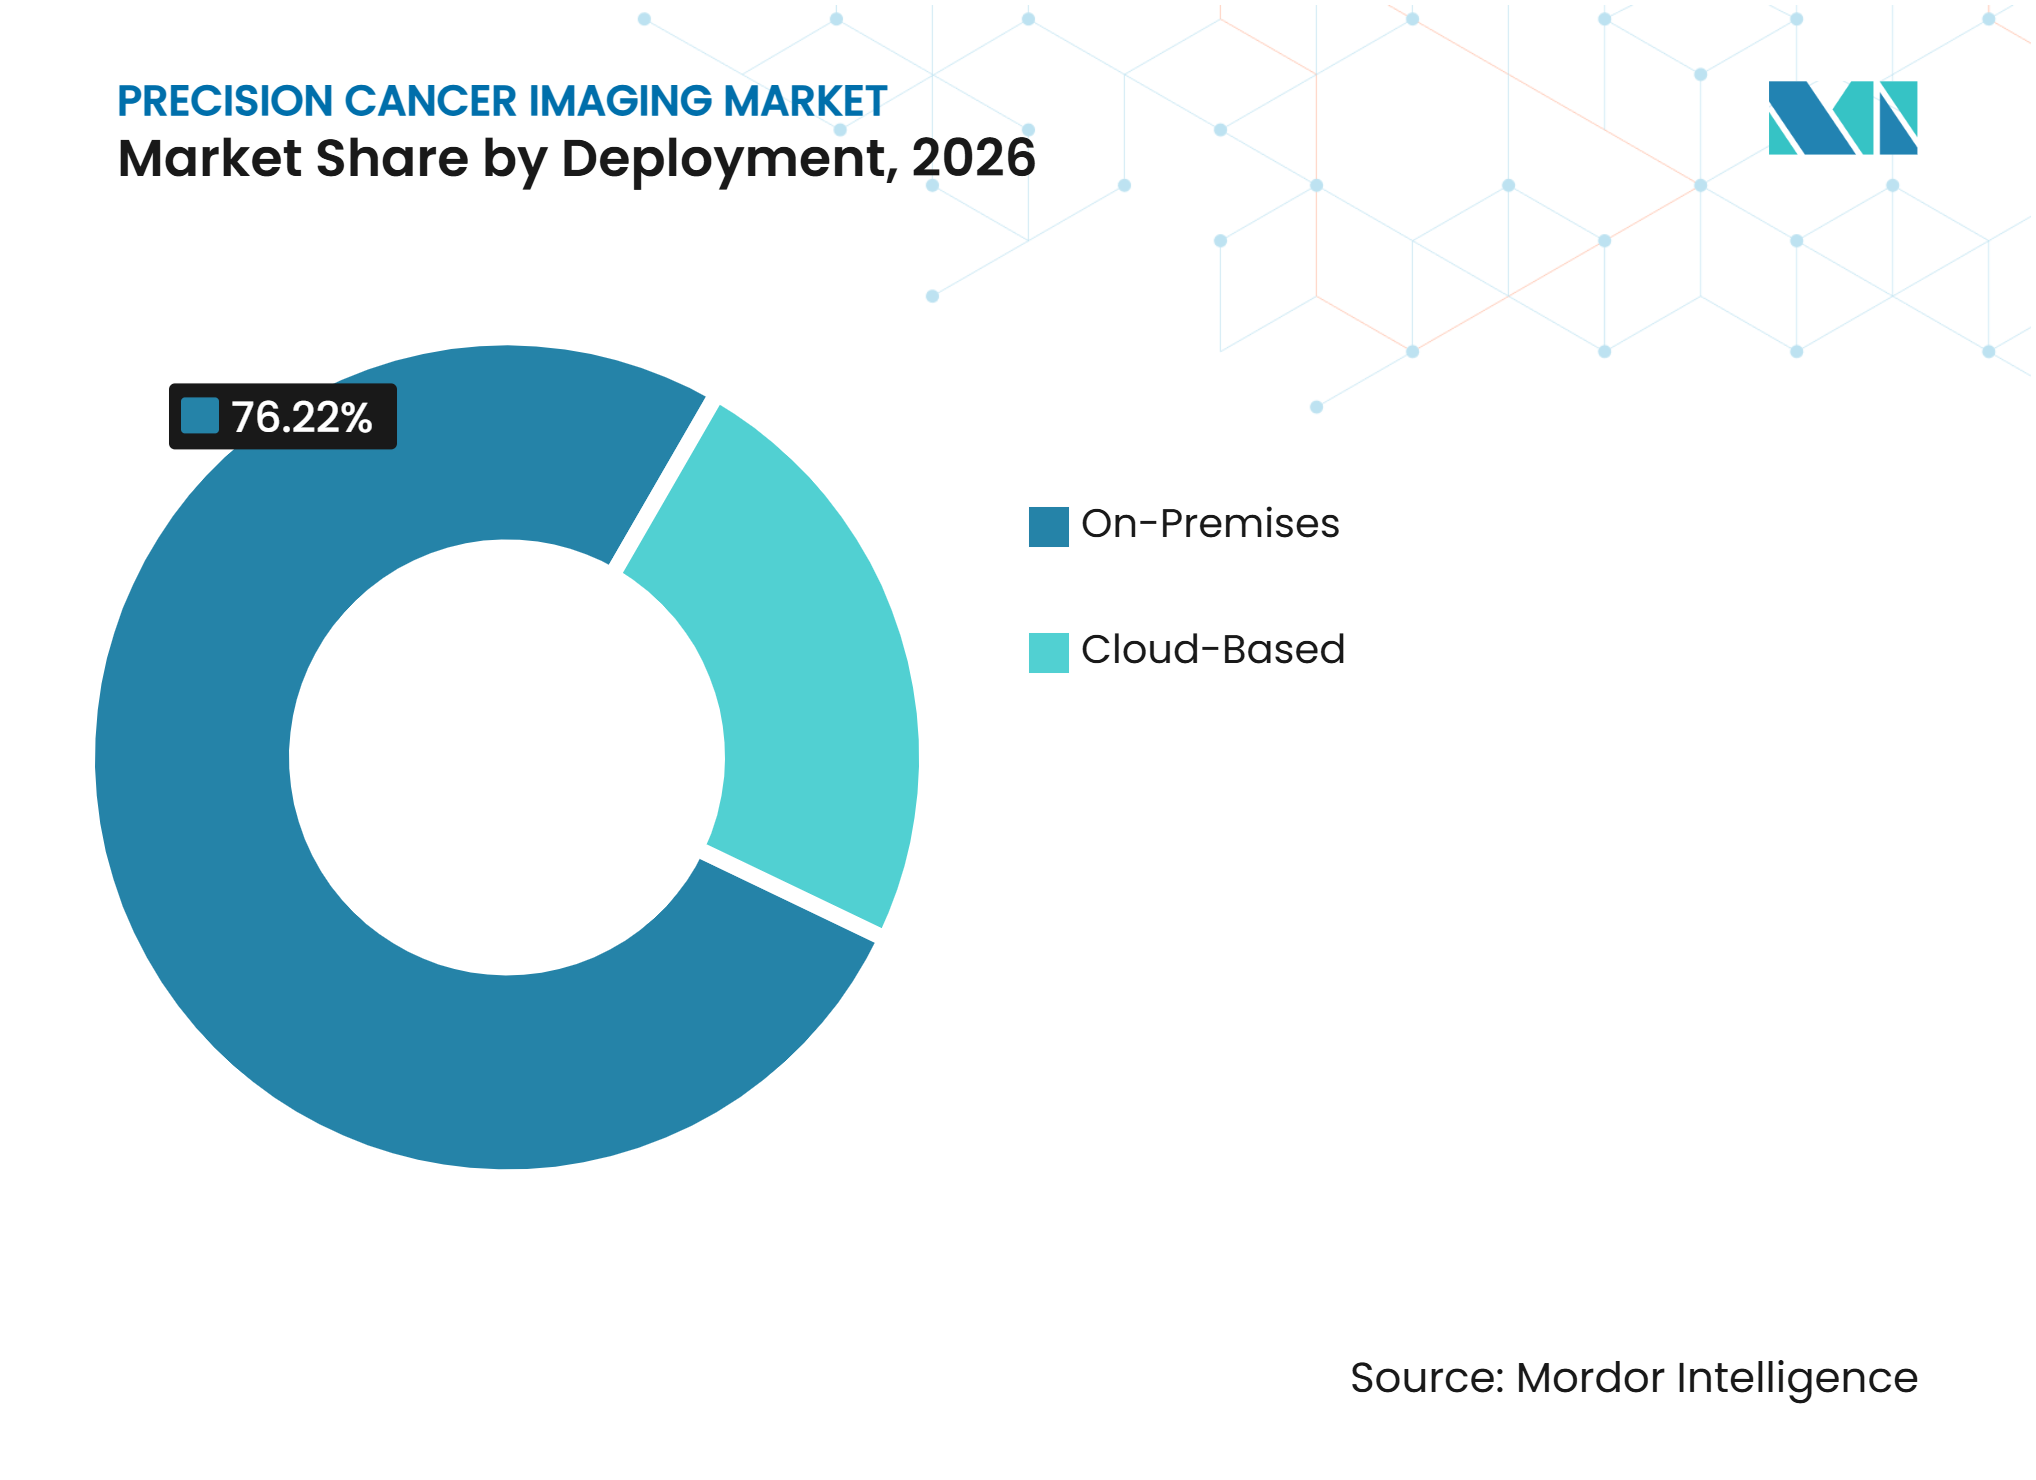
- By deployment, on-premises systems held 76.22% revenue share in 2026, while cloud-based deployment is forecast to expand at a 14.82% CAGR through 2032 in the precision cancer imaging market.
- By end user, hospitals and clinics held a 52.36% revenue share in 2026, while cancer care centers are forecast to expand at a 15.67% CAGR through 2032.
- By geography, North America held a 39.48% revenue share in 2026, while Asia-Pacific is forecast to expand at a 15.88% CAGR through 2032 in the precision cancer imaging market.
Note: Market numbers in this report are based on Mordor Intelligence's proprietary estimation framework, which combines nine months of actuals with Q4 projections for base year 2026.
Market Trends and Insights
Drivers Impact Analysis of Precision Cancer Imaging Market*
| Driver | (~) % Impact on CAGR Forecast | Geographic Relevance | Impact Timeline |
|---|---|---|---|
| Rising Global Cancer Incidence and Screening Demand | +2.5% | Global, strongest in North America and Europe | Short term (≤ 2 years) |
| Expansion of Precision Oncology and Personalized Treatment | +2.0% | North America and APAC core, spill-over to MEA | Medium term (2-4 years) |
| Adoption of Molecular Imaging and Targeted Radiopharmaceuticals | +1.8% | North America, Europe, and APAC core | Medium term (2-4 years) |
| Integration of Artificial Intelligence and Quantitative Image Analytics | +1.5% | Global, with early gains in North America and Western Europe | Short term (≤ 2 years) |
| Localized Radiopharmaceutical Production Improves Tracer Availability | +0.8% | North America, Europe, APAC core | Long term (≥ 4 years) |
| Multimodal Imaging Becomes a Treatment-Planning Data Layer | +0.6% | North America, Europe, with early adoption in Japan and South Korea | Long term (≥ 4 years) |
| Source: Mordor Intelligence | |||
Rising Global Cancer Incidence and Screening Demand
Cancer screening programs are expanding while diagnostic capacity remains uneven across countries. The World Health Assembly recognized medical imaging as essential to diagnosis in May 2025 and called on member states to strengthen imaging capacity and address access gaps. This policy direction supports the precision cancer imaging market because earlier detection creates demand for diagnostic workups, staging, and follow-up imaging. Capacity constraints are likely to favor mobile systems, portable CT, low-field MRI, and cloud-connected workflows in places where fixed installations remain difficult to fund. National health agencies in Southeast and South Asia are gradually widening the setting in which imaging equipment can be procured. Suppliers therefore need different commercial models for mature premium sites and for smaller city hospitals that are newly able to adopt advanced imaging.
Expansion of Precision Oncology and Personalized Treatment
Precision oncology requires imaging at several points in a patient’s care pathway, including staging, treatment selection, response assessment, and surveillance. A 2025 review found that AI-assisted imaging reduced reading time by 21% to 53% and improved lesion characterization by 9% to 20% compared with unassisted interpretation. These gains can make repeated imaging workflows more manageable for radiology teams with limited staff. The precision cancer imaging market benefits when imaging becomes a recurring requirement rather than a one-time diagnostic procedure. In prostate cancer, PSMA-PET can support selection, restaging, and post-treatment evaluation across the patient pathway. Work by the Cardiovascular and Interventional Radiological Society of Europe on imaging biomarkers may also support the use of validated imaging endpoints in clinical studies.
Adoption of Molecular Imaging and Targeted Radiopharmaceuticals
Targeted radiopharmaceuticals are linking PET imaging more closely to treatment decisions. The United States Food and Drug Administration approved Gozellix in March 2025, a gallium-68 gozetotide PSMA-PET imaging agent with a shelf life of up to 6 hours.[1] The longer shelf life can extend access to PET camera sites that could not be served reliably by earlier supply models. A 2025 scientific review described the expanding clinical role of approved PSMA-PET agents in prostate cancer imaging. The precision cancer imaging market gains when tracer availability, scanner capacity, and therapeutic use are planned together. GE HealthCare’s Care Alliance with the University of Rochester Medical Center includes cyclotron installation for in-house production of short-lived radioisotopes, showing how local production can reduce supply risk for PET programs.
Integration of Artificial Intelligence and Quantitative Image Analytics
AI is being used both to sort routine imaging studies and to assist radiologists during interpretation. A 2025 study found that AI used as a prescreener reduced lung CT recall rates by 13.5% and reduced mean interpretation time to 143 seconds. The same study found that an assistant model increased recall rates when its suggestions influenced readers, which highlights the need for careful workflow design. AI platforms that reduce routine workload may have a clearer clinical role than products that only add another recommendation layer. The FDA cleared InferRead Lung CT.AI in April 2025 for automated detection of pulmonary nodules as small as 4 mm in asymptomatic populations.[2] The Philips-coordinated PreciseOnco program also combines AI-driven spectral CT, robotic guidance, and real-time imaging feedback in cancer treatment studies.
Restraints Impact Analysis of Precision Cancer Imaging Market*
| Restraint | (~) % Impact on CAGR Forecast | Geographic Relevance | Impact Timeline |
|---|---|---|---|
| High Capital and Lifecycle Cost of Advanced Imaging Systems | -1.8% | Global, most acute in APAC emerging markets and MEA | Short term (≤ 2 years) |
| Shortage of Specialized Imaging and Nuclear Medicine Professionals | -1.4% | Global, most severe in South Asia, Southeast Asia, and MEA | Medium term (2-4 years) |
| Reimbursement and Radiation-Exposure Constraints | -1.0% | North America and Europe, with compliance influence from FDA and EMA | Medium term (2-4 years) |
| Interoperability and Clinical-Validation Friction for Radiomics | -0.7% | Global, most visible in fragmented hospital IT markets | Long term (≥ 4 years) |
| Source: Mordor Intelligence | |||
High Capital and Lifecycle Cost of Advanced Imaging Systems
PET/CT, total-body PET, and high-field MRI installations require substantial equipment, facility, and service investment. Large health systems are responding through multi-year agreements that combine equipment, maintenance, software, and training. GE HealthCare signed a 14-year Care Alliance with UC San Diego Health in October 2025 covering several imaging and nuclear medicine modalities. These agreements can reduce immediate purchasing barriers for integrated health systems. They can also narrow procurement options when hardware, AI software, and service are included under a single supplier relationship. The precision cancer imaging market may therefore see imaging capacity concentrated in larger cancer centers and academic systems that can support high-throughput use.
Shortage of Specialized Imaging and Nuclear Medicine Professionals
The supply of trained radiologists, radiographers, medical physicists, and nuclear medicine specialists limits the pace of service expansion. A 2025 assessment of MRI capacity in Southeast Asia identified insufficient resources, long waiting times, and shortages of trained staff as key barriers. AI can help manage routine reads, but it does not replace specialist oversight for tracer administration, dosimetry, and interpretation in theranostic pathways. This leaves the fastest-growing precision applications dependent on a narrow pool of trained professionals. The World Health Assembly’s 2025 action on imaging capacity offers a policy response, but training pipelines take years to produce qualified staff. European nuclear medicine facilities must also meet applicable radiation safety and credentialing requirements under the EU Basic Safety Standards Directive.
*Our forecasts treat driver/restraint impacts as directional, not additive. The impact forecasts reflect baseline growth, mix effects, and variable interactions.
Precision Cancer Imaging Market Segment Analysis
By Component:
Hardware Infrastructure Anchors, Software AcceleratesHardware held 56.37% of the precision cancer imaging market share in 2026, reflecting the large installed base of PET, CT, MRI, and ultrasound systems. Every clinical imaging workflow still depends on physical scanner infrastructure, even where AI is used for interpretation or care coordination. This gives hardware suppliers recurring revenue opportunities from maintenance, upgrades, replacement cycles, and service contracts. Hospitals also need dependable uptime and trained personnel to use these systems safely. Multi-year enterprise arrangements are becoming a practical way to cover equipment, support, and staff training together. GE HealthCare’s 2025 agreement with UC San Diego Health covered X-ray, CT, PET/CT, PET/MR, SPECT/CT, MRI, and nuclear medicine services. Such arrangements support established equipment suppliers, but they can make access more difficult for independent software providers.
Software is forecast to record a 12.81% CAGR through 2032 within the precision cancer imaging market. Growth is supported by AI tools that assist image review and enterprise platforms that connect images, reports, and clinical decisions. The FDA clearance of InferRead Lung CT.AI shows that specific software functions with defined performance claims can move through established regulatory routes. Software can be purchased with a new scanner or deployed across a mixed fleet of equipment. That flexibility broadens its use in hospital networks seeking common analytics and workflow tools. Its value still depends on validation, interoperability, and clinician acceptance. The precision cancer imaging market is therefore likely to retain hardware as its base while software becomes more closely embedded in care delivery.



By Imaging Modality:
PET Dominates, MRI Gains Clinical MandatePET held 33.47% of the precision cancer imaging market share in 2026. Its leading position reflects the use of molecular imaging in prostate cancer staging, biochemical recurrence detection, and theranostic selection. PSMA-PET agents are increasingly tied to radioligand therapy decisions, which can create repeat imaging needs during a patient’s care. Gozellix received FDA approval in March 2025 as a PSMA-PET agent with an extended 6-hour shelf life. This formulation can support delivery to more PET sites. PET also has a central role where imaging is used to determine whether a patient is suitable for targeted treatment. The modality’s role is consequently moving beyond a staging support function.
MRI is forecast to expand at a 13.42% CAGR through 2032, the fastest rate among the listed modalities. It benefits from wider use in dense-breast imaging and from prostate imaging before biopsy. A 2025 review reported evidence that AI-supported imaging can reduce reading time while improving lesion characterization. MRI offers detailed soft-tissue visualization without ionizing radiation, which supports its use in repeat assessment pathways. CT continues to serve high-volume staging, lung screening, and treatment planning needs. Ultrasound and contrast-enhanced ultrasound remain accessible options in breast and liver cancer evaluation. Together, these modalities show how the precision cancer imaging market can meet different clinical and cost needs.
By Cancer Type:
Lung Leads, Prostate Reshapes the Imaging PathwayLung cancer held 26.51% of the precision cancer imaging market revenue share in 2026. CT screening and PET/CT staging support its large imaging volume across diagnosis and treatment planning. Low-dose CT remains a key tool for screening eligible adults, while PET helps evaluate the extent of disease and treatment response. AI is also being developed to support lung CT workflow management. InferRead Lung CT.AI received FDA clearance for automated pulmonary nodule detection in April 2025. Breast and colorectal cancer also create substantial imaging needs through mammography, MRI, CT, and PET pathways. The broader cancer mix keeps demand distributed across several imaging technologies.
Prostate cancer is forecast to expand at a 13.69% CAGR through 2032, the fastest rate among cancer types. Its growth is linked to the pairing of PSMA-PET imaging with radioligand therapy. FDA approval of Pluvicto for earlier use before chemotherapy in March 2025 expanded the clinical setting in which PSMA-positive metastatic castration-resistant prostate cancer can be treated.[3] FDA approval of the Illuccix label expansion in June 2025 supported use of the imaging agent for patient selection in the pre-taxane setting. These changes make imaging part of therapeutic decision-making. The imaging pathway may include selection, interim evaluation, and end-of-treatment assessment. This makes prostate cancer an important test case for care models where diagnostic imaging and therapy are commercially connected.

By Application:
Staging Commands Share, Monitoring Leads GrowthDiagnosis and staging accounted for 37.91% of the precision cancer imaging market in 2026. Biomarker-guided staging helps clinicians determine treatment approaches across solid tumors. The quality of this assessment can influence the next clinical decision, including surgery, radiation, systemic therapy, or further molecular imaging. A 2025 review described improved lesion characterization with AI-assisted imaging in relevant clinical studies. Screening and early detection are also growing as lung and breast programs widen access in major markets. Treatment planning uses imaging data for radiotherapy, dosimetry, and procedure guidance. These uses make accurate image acquisition and reporting central to oncology operations.
Treatment monitoring and response assessment is forecast to grow at a 14.43% CAGR through 2032. Theranostic protocols can require scans during treatment and at completion, raising the number of imaging interactions per patient. Immunotherapy also creates situations where imaging helps distinguish true progression from treatment-related changes. Quantitative PET and MRI-based radiomics are being explored for these difficult response assessments. The application depends on clinical validation because a mistaken conclusion can lead to an unnecessary change in care. Repeat imaging creates opportunities for providers to maintain consistent protocols over time. It also raises the importance of specialist interpretation and data continuity across the precision cancer imaging market.
By Deployment:
On-Premises Dominates, Cloud-Native Models Drive GrowthOn-premises systems held 76.22% of the precision cancer imaging market revenue share in 2026. Large hospitals often keep imaging data and core systems within their own environments to maintain direct operational control. This approach can help organizations manage sensitive oncology archives and customize local AI workflows. It can also support fast response requirements in procedural or high-throughput settings. Compliance factors include HIPAA requirements in the United States and the General Data Protection Regulation in the European Union. These rules influence how patient images are stored, accessed, and transferred. On-premises deployment will therefore remain relevant where clinical risk, privacy, and workflow speed are central concerns.
Cloud-based deployment is forecast to expand at a 14.82% CAGR through 2032. Multi-site networks can use cloud services to centralize governance, standardize software versions, and add capacity without purchasing local server infrastructure. Sectra signed a 7-year contract with a U.S. cancer center in April 2025 for its Sectra One Cloud enterprise imaging platform.[4] The contract covered several diagnostic disciplines under a managed service arrangement. This model changes spending from an upfront capital purchase toward a continuing service agreement. Cloud deployment can also help teleradiology and distributed cancer networks share standardized tools. Data protection, governance, and third-party processing controls remain important conditions for adoption.
By End User:
Hospitals Anchor Volume, Cancer Care Centers Lead GrowthHospitals and clinics held 52.36% of the precision cancer imaging market revenue share in 2026. They remain the principal settings for diagnosis, treatment, inpatient monitoring, and complex imaging procedures. Their scale can support expensive PET/CT, MRI, and nuclear medicine equipment. Academic medical centers also combine clinical care with research, which supports early use of advanced protocols and imaging analytics. The University of Rochester Medical Center agreement with GE HealthCare includes cyclotron infrastructure to support short-lived isotope production. Diagnostic imaging centers add capacity by offering outpatient PET and MRI services. The provider landscape consequently includes both large hospital networks and specialized outpatient sites.
Cancer care centers are forecast to expand at a 15.67% CAGR through 2032. These facilities are designed to bring imaging, treatment planning, and therapy delivery into one oncology pathway. Willis Knighton Health completed a nuclear oncology expansion in March 2025, adding a GE HealthCare StarGuide SPECT/CT system and a second PET/CT scanner. The expansion shows how dedicated cancer providers are building theranostic capability into their service mix. Integrated centers may be able to coordinate scan scheduling, therapy selection, and response review more closely than referral-based models. Their growth also increases demand for specialist staff, radiopharmaceutical supply, and interoperable clinical systems. This creates a clear opportunity for suppliers that can support the entire oncology imaging workflow.
Geography Analysis
North America: Reimbursement Reform Amplifies Installed-Base Advantage
North America held 39.48% of the precision cancer imaging market revenue share in 2026. The region has a dense base of academic cancer centers, community hospitals, and freestanding imaging facilities. It also has a strong foundation for PET, CT, MRI, and nuclear medicine services. Regulatory and payment decisions influence which imaging agents and technologies reach patients. FDA approvals in 2025 for Gozellix and the earlier use of Pluvicto supported the use of PSMA-directed imaging and therapy in prostate cancer pathways. Telix also reported FDA approval of an Illuccix label expansion for pre-taxane patient selection in June 2025. Long-term equipment alliances are reinforcing the role of large health systems in advanced imaging adoption. GE HealthCare’s 14-year UC San Diego Health agreement is one example of this model. The region’s structural advantage comes from its installed base, specialist workforce, and ability to translate regulatory approvals into clinical use.
Asia-Pacific: Infrastructure Deficit Becomes the Market Opportunity
Asia-Pacific is forecast to expand at a 15.88% CAGR through 2032. Cancer burden, hospital modernization, and the need for more imaging access are supporting growth across the region. The available MRI capacity remains limited in many Southeast Asian health systems. A 2025 assessment identified shortages of MRI equipment and trained professionals, along with long waiting times, as major barriers to access. This capacity gap supports demand for practical equipment choices and for tools that improve workflow efficiency. The World Health Assembly’s 2025 resolution on medical imaging offers policy support for national capacity-building efforts. Japan and South Korea are earlier adopters of advanced imaging and AI-enabled workflows, while other parts of the region require broader infrastructure development. Suppliers that can pair equipment with local support, training, and scalable service models are better positioned to address this varied demand.
Global Demand Patterns Beyond Core Regions
Europe has established nuclear medicine services and remains important for molecular imaging, theranostics, and quantitative imaging work. European facilities operate within radiation safety and clinical quality frameworks that influence facility design, staff qualifications, and tracer use. The EU Basic Safety Standards Directive is a relevant compliance factor for nuclear medicine services. The United Kingdom and Italy are advancing lung cancer CT screening approaches, while AI assessment tools are being considered as a way to manage reading workloads. The EU AI Act also affects medical AI tools classified as high-risk systems, encouraging suppliers to build stronger documentation, monitoring, and explainability practices. In the Middle East and Africa, imaging adoption is at an earlier stage outside larger health systems, while access is constrained by financing and workforce limits. South American use is concentrated in major urban cancer centers, with nuclear medicine capability influencing where advanced PET services can operate. Across these mixed regions, the International Atomic Energy Agency’s radiation protection frameworks shape planning for new nuclear medicine facilities. These requirements make service capability, training, and regulatory readiness as important as equipment delivery for the precision cancer imaging market.
Competitive Landscape
Market Concentration
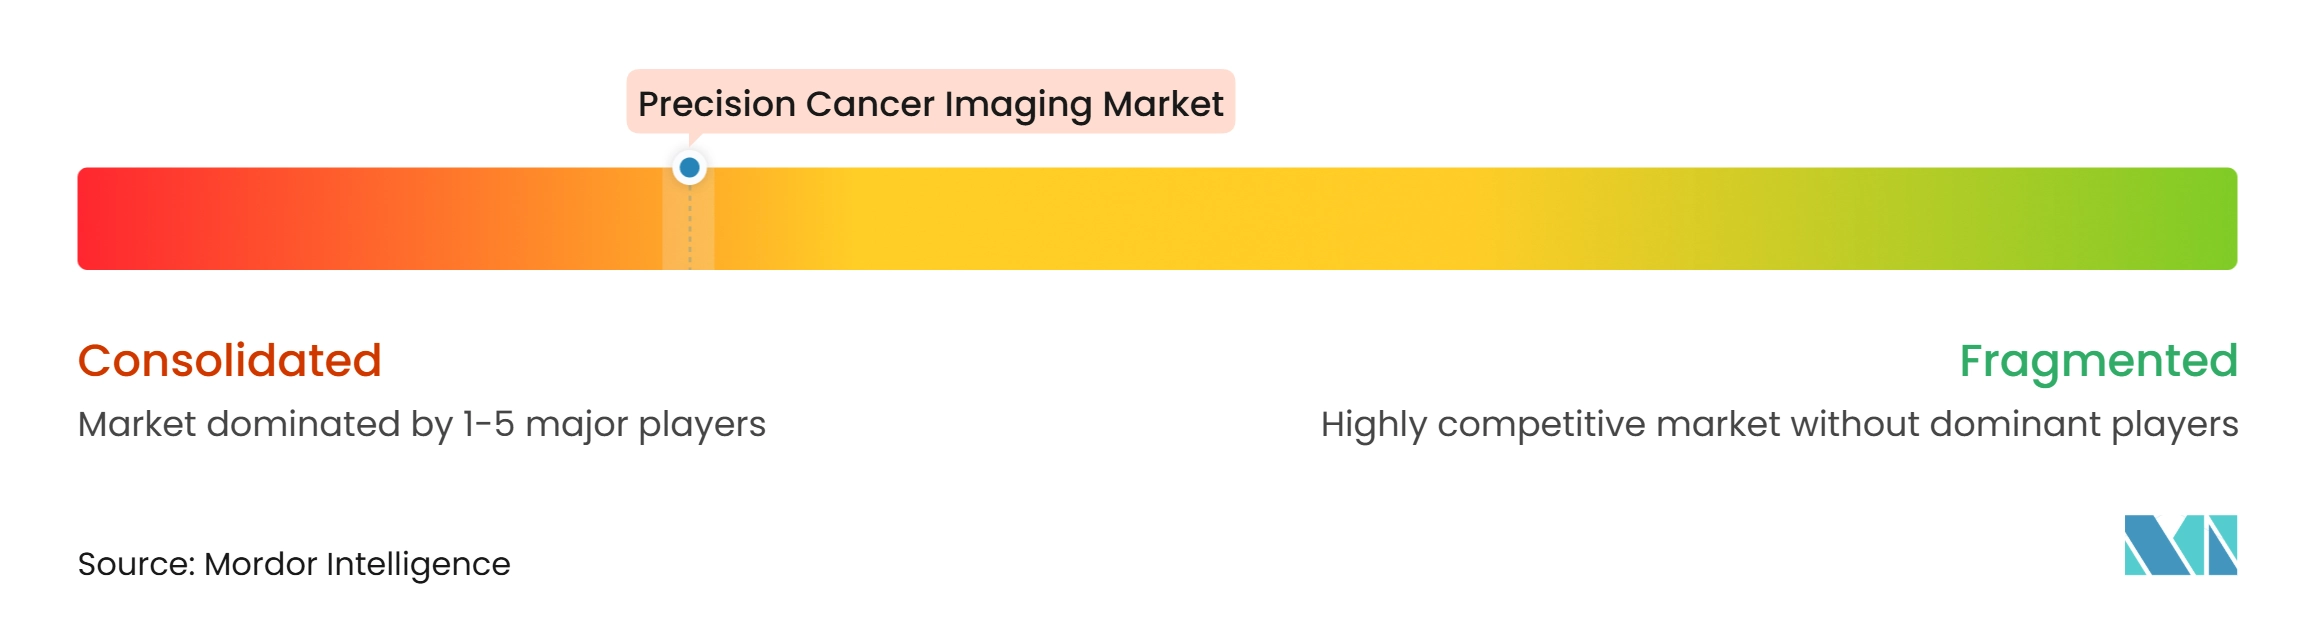
The precision cancer imaging market is moderately consolidated in hardware and clinical platforms. GE HealthCare, Siemens Healthineers, and Koninklijke Philips NV have broad scanner portfolios and are extending into software, managed services, and theranostic infrastructure. Their long-term agreements can combine equipment, clinical training, maintenance, and AI tools under a common relationship. GE HealthCare’s 14-year Care Alliance with UC San Diego Health covered a wide range of imaging and nuclear medicine systems. The company’s 7-year University of Rochester Medical Center agreement includes cyclotron installation to support local isotope production. These agreements make it harder for suppliers with narrow product offerings to enter locked-in accounts. They also show why clinical service capability is becoming part of competition.
Radiopharmaceutical companies have a different strategic position because their agents are required for many molecular imaging procedures. Lantheus Holdings, Telix Pharmaceuticals, Curium Pharma, and Eckert & Ziegler operate upstream of the scan itself and can influence access to tracer supply. Telix received FDA approval for Gozellix in March 2025, and the product’s 6-hour shelf life can broaden the distribution radius to PET sites. ITM Radiopharma received FDA Fast Track designation for ITM-94 in November 2025 as a diagnostic agent for clear cell renal cell carcinoma. These developments extend theranostic imaging beyond prostate cancer. Vertically coordinated offers can have an advantage because providers need a dependable combination of tracer supply, equipment, specialist workflows, and clinical support.
Pure-play AI companies such as Aidoc Medical, Lunit, Qure.ai, and Median Technologies aim to supply analytics across mixed equipment fleets. Their case depends on independent performance evidence and the ability to fit existing workflows. Clinical evidence also shows that the way an AI tool is deployed can affect results, so providers are likely to scrutinize validation and user controls. The EU AI Act is shaping investment in product documentation, post-market monitoring, and explainability for high-risk medical AI. Siemens Healthineers is working with Massachusetts General Hospital on a Therapy Command Center that uses long field-of-view PET/CT for theranostic research. Philips is coordinating the PreciseOnco program, which brings AI-driven spectral CT, robotic guidance, and real-time imaging feedback into clinical studies. The white space remains in under-equipped facilities, where domestic equipment suppliers and cloud-based AI providers may offer usage-based options. A market concentration score cannot be assigned from the supplied material because it does not provide the combined market share of leading companies.
Precision Cancer Imaging Industry Leaders
-
Bayer AG
-
FUJIFILM Holdings Corporation
-
GE HealthCare
-
Hologic Inc.
-
Koninklijke Philips NV
- *Disclaimer: Major Players sorted in no particular order
Precision Cancer Imaging Market Companies Covered in this Report
- Aidoc Medical Ltd
- Bayer
- Bracco
- Brain Lab
- Canon
- Curium Pharma
- Eckert & Ziegler SE
- FUJIFILM
- GE Healthcare
- Hologic
- Koninklijke Philips
- Lantheus
- Lunit
- Median Technologies
- Mirada Medical Limited
- Novartis
- Paige AI Inc.
- PathAI Inc.
- Quibim S.L.
- Qure.ai Technologies Private Limited
- Shimadzu
- Siemens Healthineers
- Telix Pharmaceuticals Limited
- Tempus AI Inc.
- United Imaging Healthcare
Recent Industry Developments in Precision Cancer Imaging Market
- October 2026: GE HealthCare announced 5 new global collaborations to advance next-generation theranostics imaging, including a 3-continent, 5-institution clinical evaluation program for its StarGuide GX digital 4D SPECT/CT system, expanding the clinical evidence base for theranostic workflows.
- February 2026: The Philips-coordinated PreciseOnco consortium was awarded EUR 14.9 million in funding from the EU’s Innovative Health Initiative, with a total program budget of EUR 23.9 million, for a 5-year precision cancer treatment initiative combining spectral CT, robotic guidance, and AI across 5 clinical studies at leading European cancer centers.
- November 2025: ITM Radiopharma received FDA Fast Track designation for ITM-94, a gallium-68 PET imaging agent, as a diagnostic for clear cell renal cell carcinoma. It is a first-in-class PET agent targeting carbonic anhydrase IX and expands theranostic PET imaging beyond prostate cancer.
Global Precision Cancer Imaging Market Report Scope
Segmentation Overview
| Hardware |
| Software |
| Services |
| Magnetic Resonance Imaging (MRI) |
| Computed Tomography (CT) |
| Positron Emission Tomography (PET) |
| Ultrasound and Contrast-Enhanced Ultrasound |
| Others |
| Breast Cancer |
| Lung Cancer |
| Prostate Cancer |
| Colorectal Cancer |
| Others |
| Screening and Early Detection |
| Diagnosis and Staging |
| Treatment Planning |
| Treatment Monitoring and Response Assessment |
| Others |
| On-Premises |
| Cloud-Based |
| Hospitals and Clinics |
| Cancer Care Centers |
| Diagnostic Imaging Centers |
| Others |
| North America | United States |
| Canada | |
| Mexico | |
| Europe | Germany |
| United Kingdom | |
| France | |
| Italy | |
| Spain | |
| Rest of Europe | |
| Asia-Pacific | China |
| India | |
| Japan | |
| Australia | |
| South Korea | |
| Rest of Asia-Pacific | |
| Middle East and Africa | GCC |
| South Africa | |
| Rest of Middle East and Africa | |
| South America | Brazil |
| Argentina | |
| Rest of South America |
| By Component | Hardware | |
| Software | ||
| Services | ||
| By Imaging Modality | Magnetic Resonance Imaging (MRI) | |
| Computed Tomography (CT) | ||
| Positron Emission Tomography (PET) | ||
| Ultrasound and Contrast-Enhanced Ultrasound | ||
| Others | ||
| By Cancer Type | Breast Cancer | |
| Lung Cancer | ||
| Prostate Cancer | ||
| Colorectal Cancer | ||
| Others | ||
| By Application | Screening and Early Detection | |
| Diagnosis and Staging | ||
| Treatment Planning | ||
| Treatment Monitoring and Response Assessment | ||
| Others | ||
| By Deployment | On-Premises | |
| Cloud-Based | ||
| By End User | Hospitals and Clinics | |
| Cancer Care Centers | ||
| Diagnostic Imaging Centers | ||
| Others | ||
| By Geography | North America | United States |
| Canada | ||
| Mexico | ||
| Europe | Germany | |
| United Kingdom | ||
| France | ||
| Italy | ||
| Spain | ||
| Rest of Europe | ||
| Asia-Pacific | China | |
| India | ||
| Japan | ||
| Australia | ||
| South Korea | ||
| Rest of Asia-Pacific | ||
| Middle East and Africa | GCC | |
| South Africa | ||
| Rest of Middle East and Africa | ||
| South America | Brazil | |
| Argentina | ||
| Rest of South America | ||
Key Questions Answered in the Report
What is the projected value of precision cancer imaging by 2032?
The precision cancer imaging market is forecast to reach USD 29.62 billion by 2032, growing from USD 14.63 billion in 2026 at a 12.47% CAGR.
Which imaging modality has the largest role in precision oncology?
Positron Emission Tomography (PET) led with 33.47% revenue share in 2026, supported by its use in molecular imaging and theranostic selection.
Why is prostate cancer important for precision imaging demand?
Prostate cancer is forecast to grow at a 13.69% CAGR through 2032 because PSMA-PET is increasingly connected to radioligand therapy decisions.
What is driving cloud adoption for oncology imaging?
Cloud deployment is forecast to grow at a 14.82% CAGR because multi-site networks need centralized governance and scalable imaging services.
Which healthcare setting is growing fastest for oncology imaging?
Cancer care centers are forecast to grow at a 15.67% CAGR through 2032 as they integrate imaging, therapy planning, and treatment delivery.
What limits wider adoption of advanced cancer imaging?
High equipment costs, shortages of nuclear medicine professionals, uneven reimbursement, and radiomics validation needs remain key constraints.