
Pre-Primary Education Market Size and Share
Market Overview
| Study Period | 2022 - 2032 |
|---|---|
| Market Size (2027) | USD 1.85 Trillion |
| Market Size (2032) | USD 2.18 Trillion |
| Growth Rate (2027 - 2032) | 3.31 % |
| Fastest Growing Market | Asia-Pacific |
| Largest Market | Asia-Pacific |
| Market Concentration | Medium |
Major Players *Disclaimer: Major Players sorted in no particular order Image © Mordor Intelligence. Reuse requires attribution under CC BY 4.0. | |
Pre-Primary Education Market Analysis by Mordor Intelligence
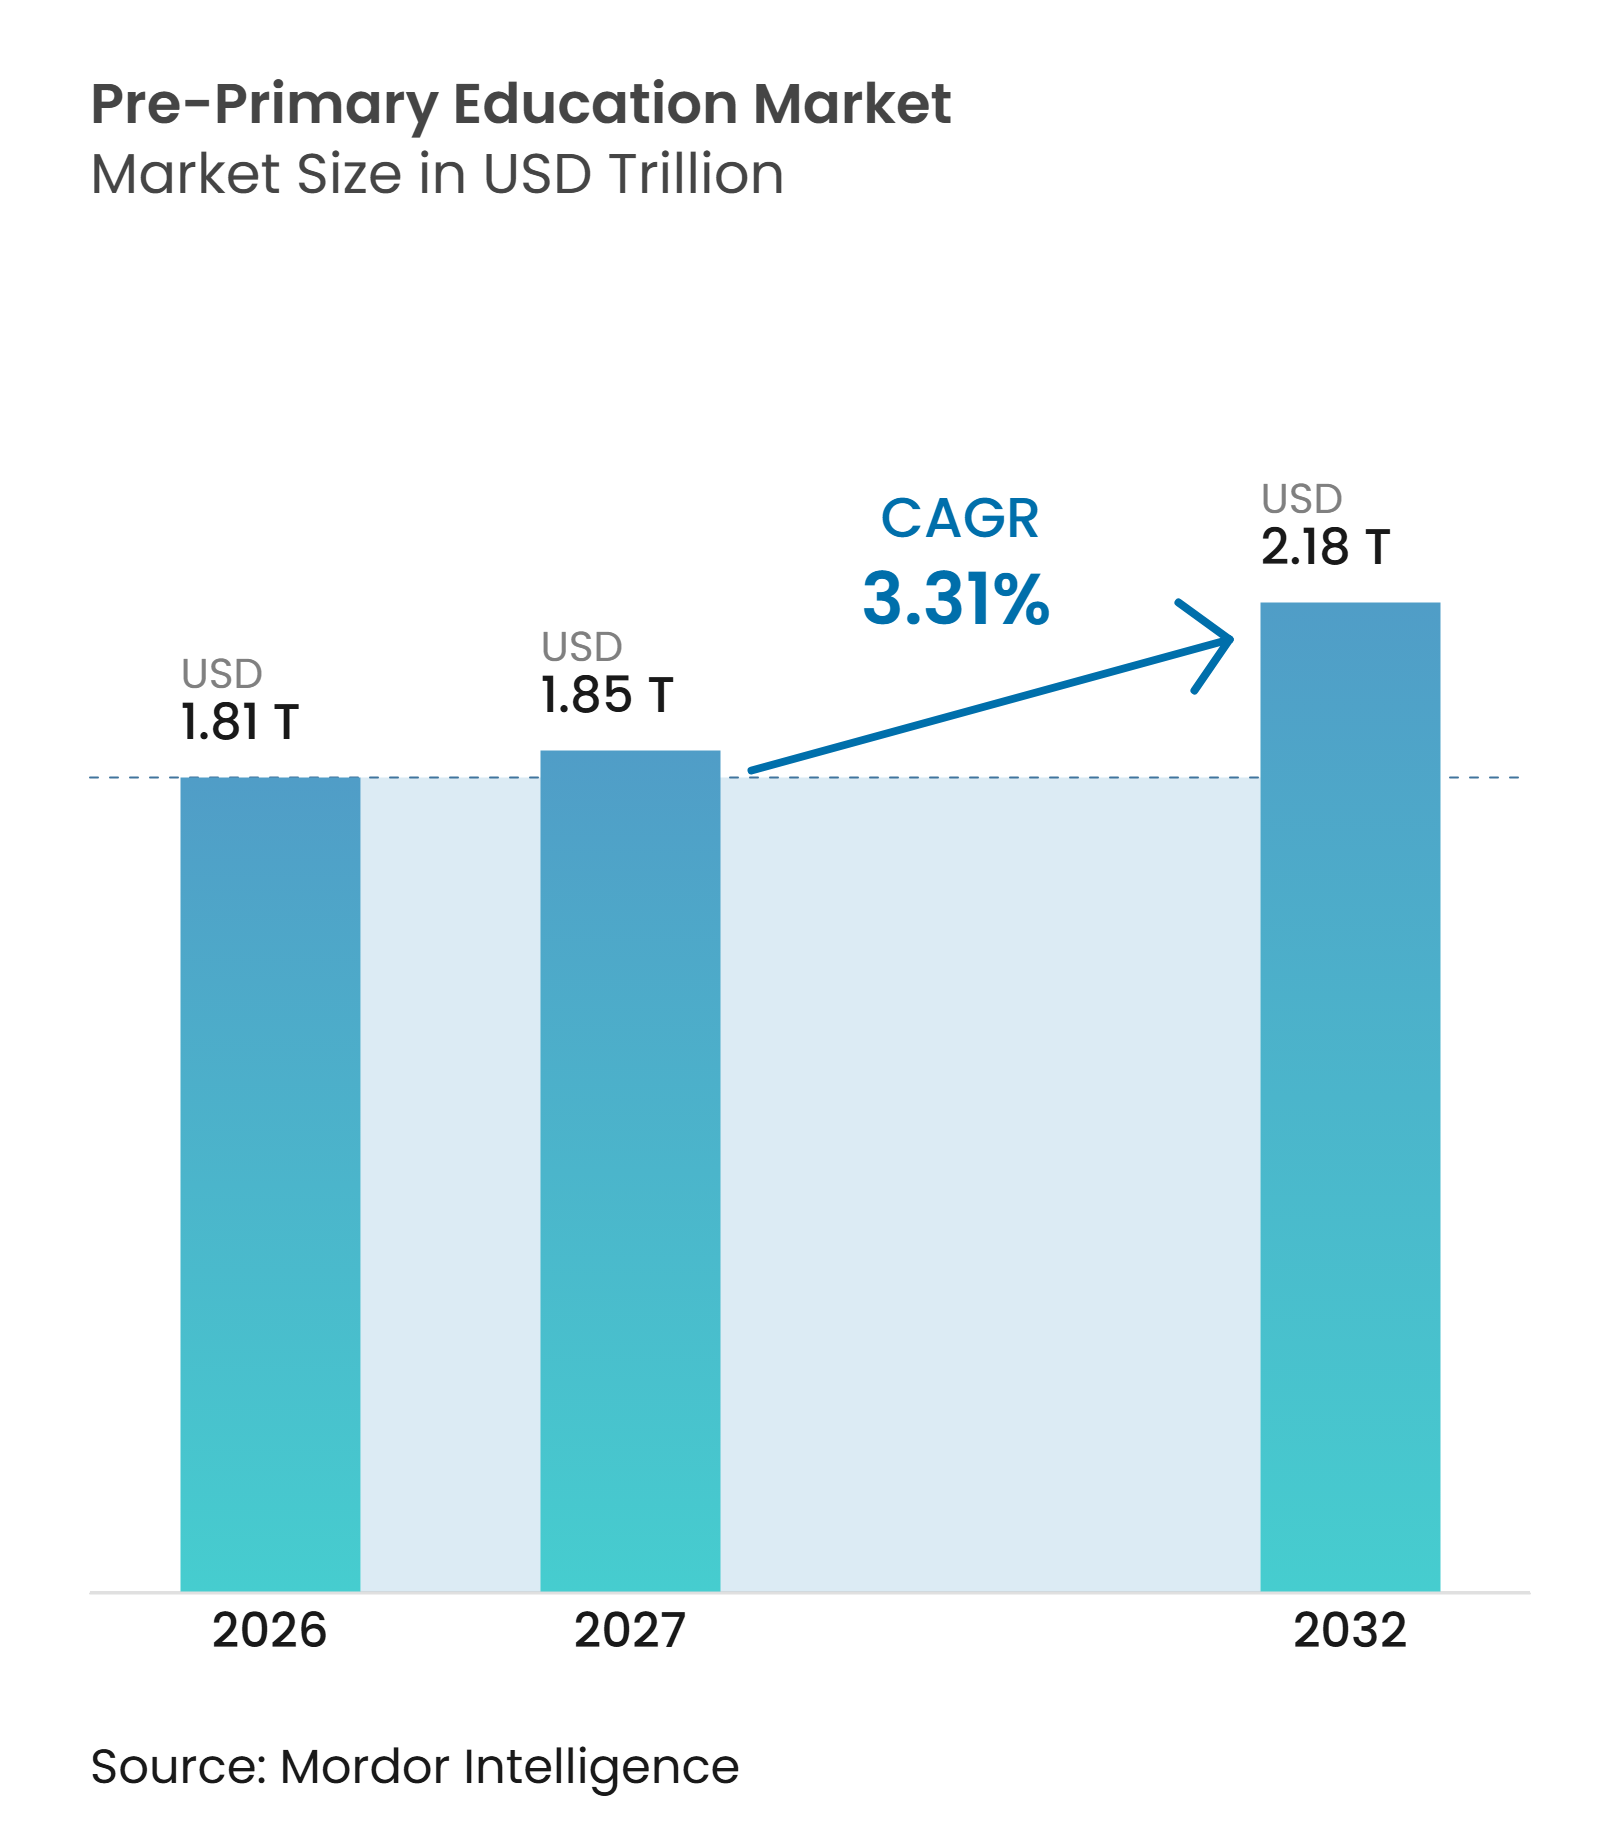
The pre-primary education market size was valued at USD 1.81 trillion in 2026 and is estimated to grow from USD 1.85 trillion in 2027 to reach USD 2.18 trillion by 2032, at a CAGR of 3.31% during the forecast period 2027-2032. Public funding is increasingly tied to quality, teacher development, assessment, and digital delivery instead of enrollment alone. OECD members raised pre-primary funding by 23% between 2015 and 2022 while enrollment was broadly stable, and average public expenditure reached USD 11,483 per child[1]. This shift supports recurring demand for curriculum, training, and assessment services across the pre-primary education market. Policy-led procurement may favor providers that can meet public standards and operate across large school systems. Teacher shortages, constrained public budgets, and uneven connectivity continue to limit how quickly institutions can expand capacity.
Key Report Takeaways
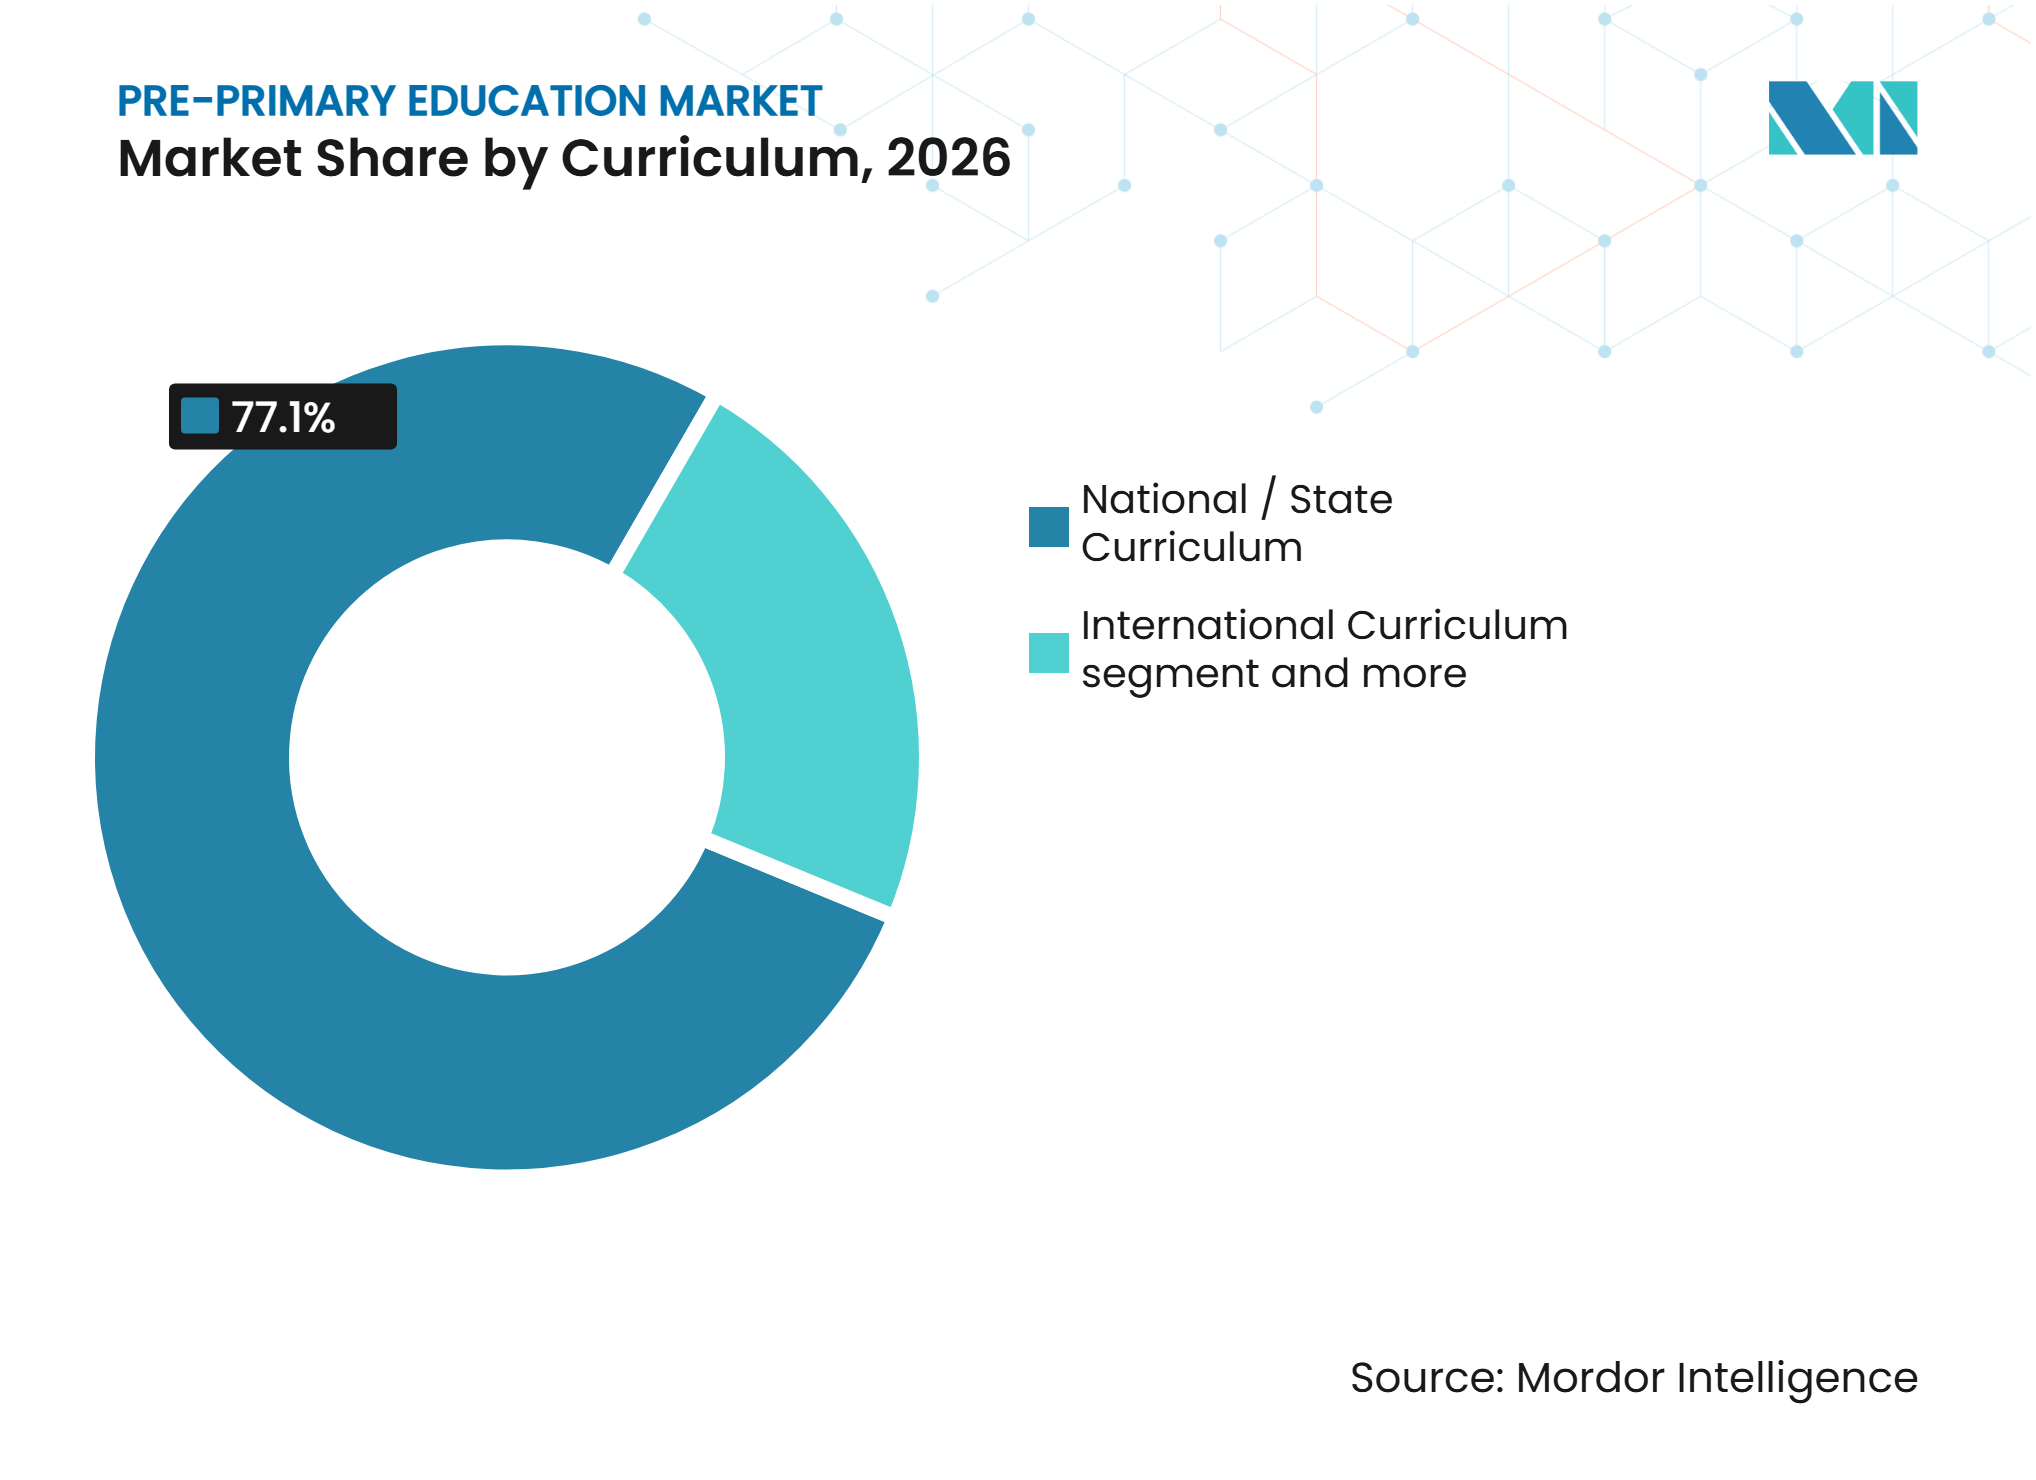
- By curriculum, national and state curricula held 77.1% of the pre-primary education market share in 2026, while international curricula are forecast to grow at a 5.8% CAGR through 2032.
- By school type, government and publicly funded schools held 80.5% of the pre-primary education market share in 2026, while private and independent schools are forecast to grow at a 4.4% CAGR through 2032.
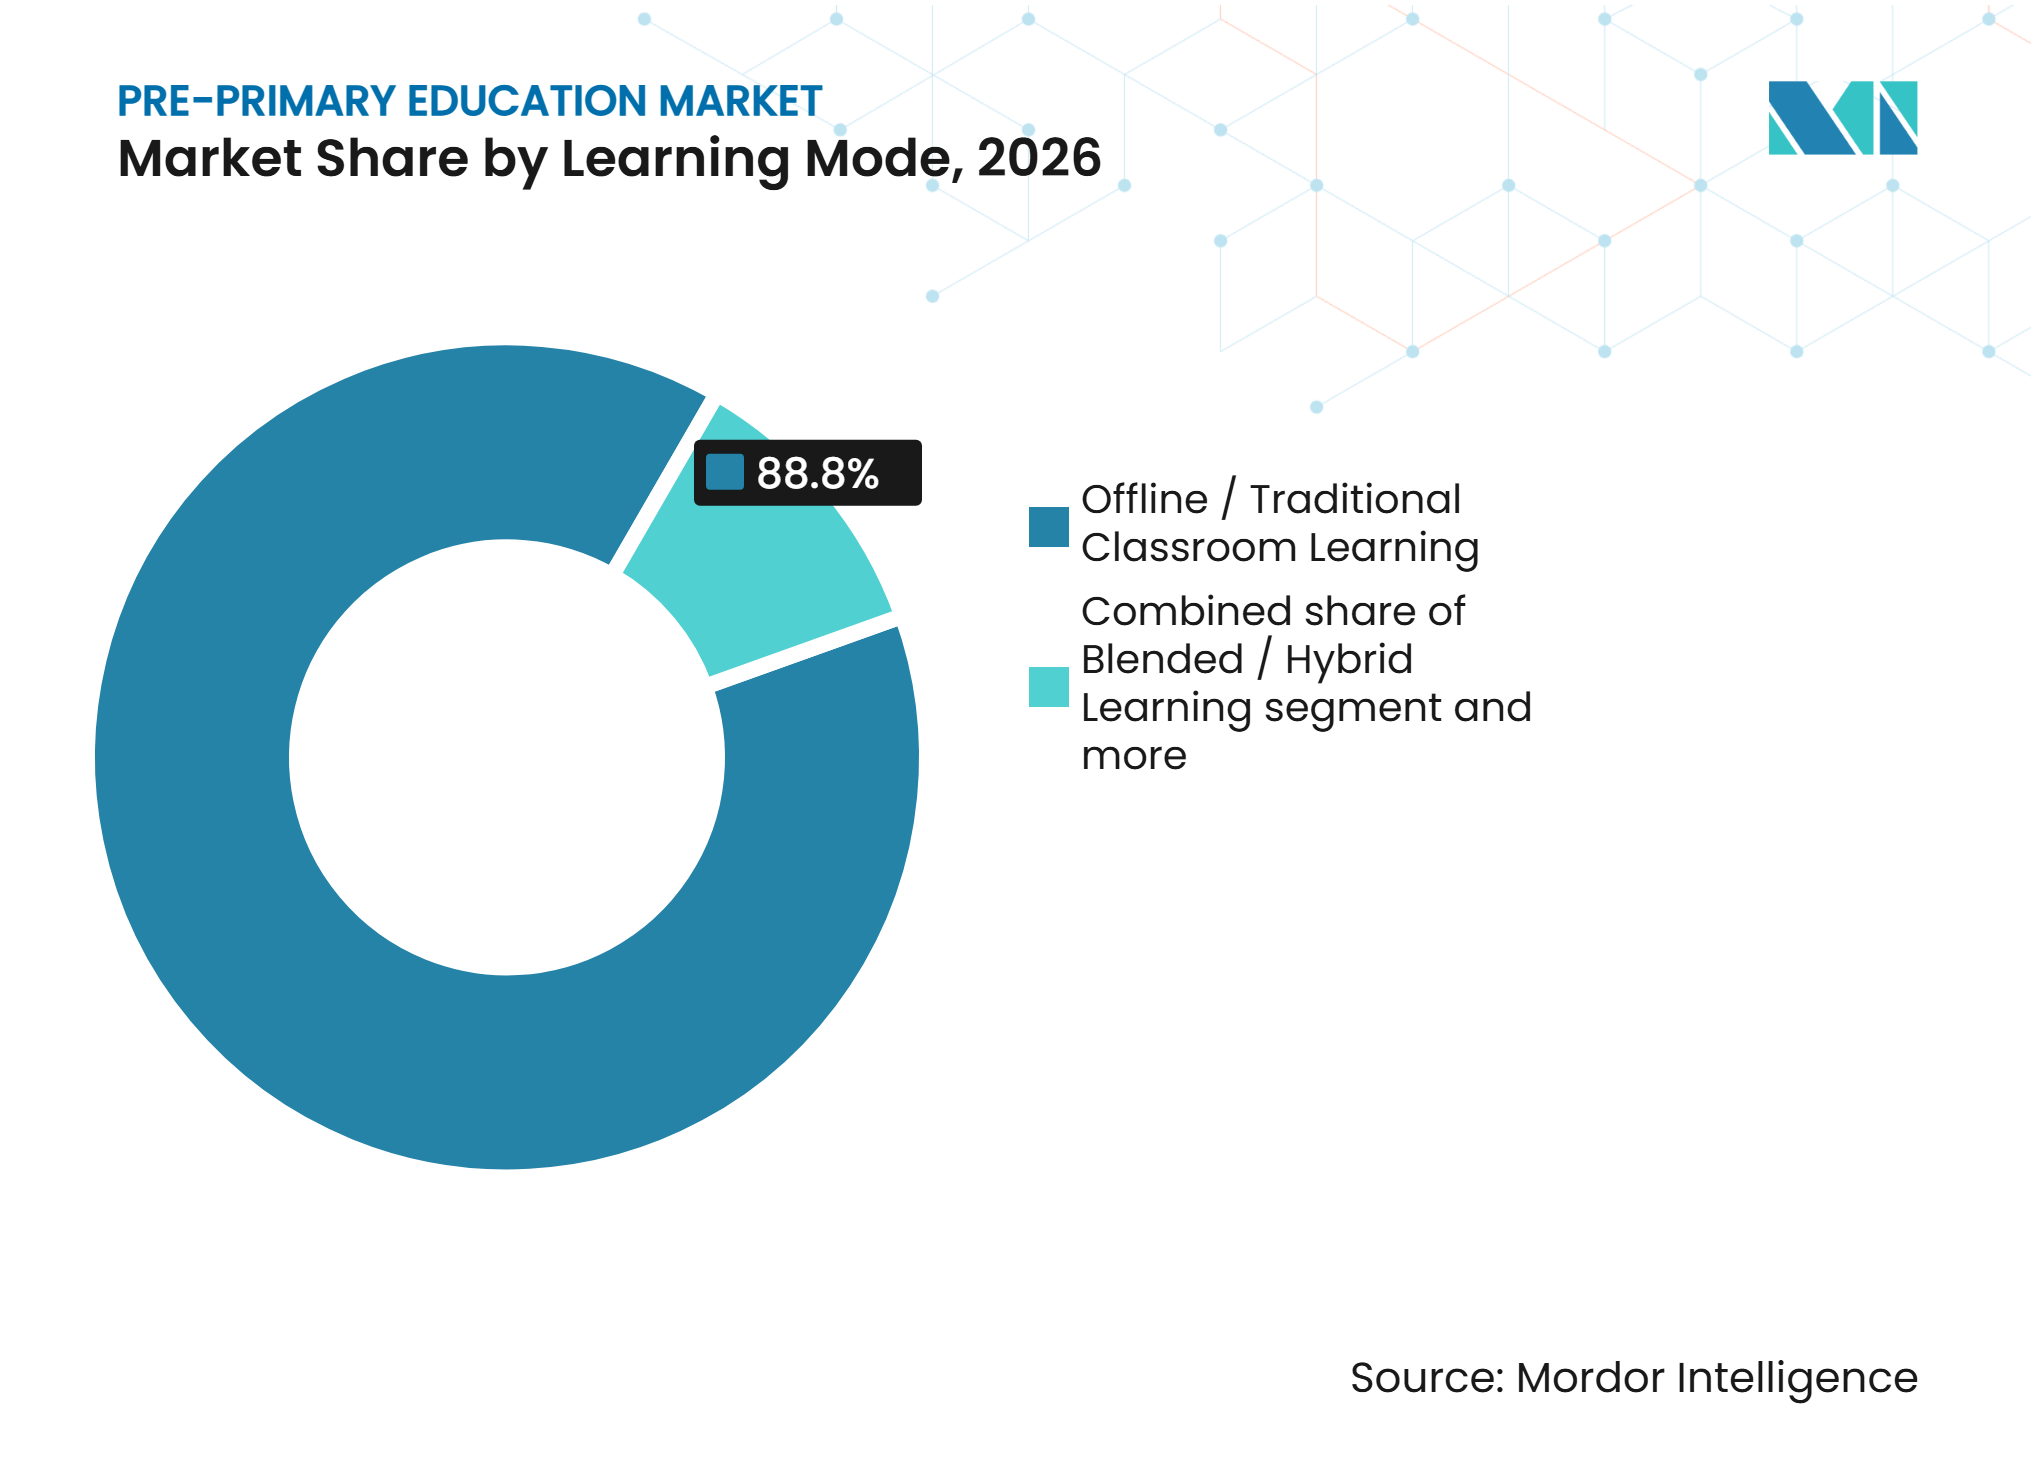
- By learning mode, offline and traditional classroom instruction held 88.8% of the pre-primary education market share in 2026, while online and virtual learning is forecast to grow at a 10.0% CAGR through 2032.
- By geography, Asia-Pacific held 40.2% of the pre-primary education market share in 2026 and is forecast to grow at a 5.4% CAGR through 2032.
Note: Market numbers in this report are based on Mordor Intelligence's proprietary estimation framework, which combines nine months of actuals with Q4 projections for base year 2026.
Market Trends and Insights
Drivers Impact Analysis of Pre-Primary Education Market*
| Driver | (~) % Impact on CAGR Forecast | Geographic Relevance | Impact Timeline |
|---|---|---|---|
| Government Funding and Universal Access Mandates | +0.9% | Global, most pronounced in MENA, Sub-Saharan Africa, and South Asia | Long term (≥ 4 years) |
| Rising Enrollment in Structured Primary Schooling | +0.7% | Asia-Pacific core, India, China, and Southeast Asia, with spillover to Sub-Saharan Africa | Medium term (2-4 years) |
| Expansion of Low-Cost Private School Networks | +0.5% | South Asia, Sub-Saharan Africa, and Latin America | Medium term (2-4 years) |
| Digital Classroom Adoption in Foundational Learning | +0.6% | Global, with early gains in Singapore, South Korea, UAE, and North America | Short term (≤ 2 years) |
| Micro-credentialing and Teacher Upskilling Demand | +0.3% | OECD countries, with early gains in Australia, Canada, and North America | Medium term (2-4 years) |
| Child Safety, Attendance, and Learning Outcome Analytics | +0.2% | North America, Europe, and Gulf Cooperation Council | Short term (≤ 2 years) |
| Source: Mordor Intelligence | |||
Government Funding and Universal Access Mandates
National compulsory-education reforms are a central demand driver because they formalize attendance and shift costs from households to public systems. Across 12 OECD members that lowered the compulsory starting age, enrollment was already 80% to 90% before reform in most cases. Morocco’s universal-access commitment raised enrollment for 4–5-year-olds from 45% in 2018 to 80% in 2024[2]. Rural enrollment rose from 33% to 91%, while public preschool units increased from 6,185 to 23,182. China’s phased free preschool policy was expected to benefit 12 million pupils in the autumn 2025 semester and reduce household spending by CNY 20 billion (USD 2.8 billion). Larger government purchasing programs may create stable demand, although they also raise compliance requirements for smaller providers.
Rising Enrollment in Structured Primary Schooling
Pre-primary participation rises where primary-school attendance and school-readiness expectations are expanding. Ethiopia’s pre-primary enrollment grew 79.3% over 10 years to 4.48 million in 2024, while Vietnam reached 4.13 million after 14.3% growth. Côte d’Ivoire increased the number of pre-primary schools from 2,502 in 2017 to 4,727 in 2025. Enrollment reached 302,232, although the gross enrollment rate remained at 12.29%, indicating a large supply gap. SDG 4.2 requires countries to work toward at least 1 year of quality pre-primary education for all children by 2030. This policy direction keeps institutional expansion relevant in lower-enrollment markets across Sub-Saharan Africa and South Asia.
Expansion of Low-Cost Private School Networks
Low-cost private operators address capacity gaps that public systems cannot immediately absorb. The supplied research states that 54% of enrolled children in South Asia attend private schools, including 70% of low-income urban Indian families that choose affordable private schools. Kashf School Sarmaya supports schools with 60–80 students and monthly fees below PKR 3,000 (USD 11), through finance and training. These schools can use credit to improve facilities, build teacher capability, and move toward activity-based teaching. PHINMA operates 13 schools in the Philippines and Indonesia, serving 163,000 low-income learners. The pre-primary education market benefits when such networks adopt common content, training, and administrative systems across secondary cities and underserved locations.
Digital Classroom Adoption in Foundational Learning
Digital tools are moving beyond pilots when they support structured teaching rather than replace it. Singapore preschool operators reported a 50% increase in preschooler AI-tool use over 2.5 years, and one AI mathematics platform recorded 75% growth in online sign-ups during 2025. The Kenya trial found that smartphone-based personalized learning aligned with the national curriculum improved combined literacy and numeracy outcomes by 0.534 standard deviations. RAND found that only 1 in 3 United States pre-kindergarten teachers received professional learning on how to evaluate EdTech product quality[3]. This gap makes training and outcome measurement important parts of institutional contracts. The pre-primary education market is likely to reward providers that can support both classroom practice and evidence-based product selection.
Restraints Impact Analysis of Pre-Primary Education Market*
| Restraint | (~) % Impact on CAGR Forecast | Geographic Relevance | Impact Timeline |
|---|---|---|---|
| Budget Pressure on Public School Systems | -0.5% | OECD-wide, most acute in the United Kingdom, Hungary, and Turkey | Medium term (2-4 years) |
| Teacher Shortages and Attrition in Early Grades | -0.5% | North America, Western Europe, and Australia | Long term (≥ 4 years) |
| Uneven Device and Connectivity Access in Rural Districts | -0.3% | Sub-Saharan Africa, South Asia, and rural Latin America | Long term (≥ 4 years) |
| Fragmented Procurement and Compliance Burden | -0.2% | Global, amplified in markets with decentralized school governance | Short term (≤ 2 years) |
| Source: Mordor Intelligence | |||
Budget Pressure on Public School Systems
Public budgets can delay school investment even when demand for early learning services is rising. OECD countries spent an average of 0.59% of GDP on early childhood and pre-primary education in 2022, compared with 1.4% on primary education. The OECD reported that the United Kingdom, Hungary, and Sweden experienced real declines in per-child government spending between 2015 and 2022. Its January 2025 analysis also stated that strong budget pressures limit many countries’ capacity to expand or strengthen public early childhood education and care. Publicly funded schools account for 80.5% of the pre-primary education market share in 2026, so longer procurement cycles may directly constrain suppliers. Providers need to show clear learning or operational value within tight school budgets.
Teacher Shortages and Attrition in Early Grades
Early childhood educator shortages prevent institutions from expanding even when facilities and parental demand are available. In Virginia, one in three lead teachers and 38% of assistant teachers in publicly funded pre-primary programs left their roles between fall 2023 and fall 2024. A survey by the Center for American Progress found that nearly half of early educators reported worsening burnout and more than one in four considered leaving within the year. Australia’s workforce study identifies a gap of 21,000 qualified early childhood professionals[4]. Workforce gaps limit enrollment capacity, service quality, and the growth potential of school networks.
*Our forecasts treat driver/restraint impacts as directional, not additive. The impact forecasts reflect baseline growth, mix effects, and variable interactions.
Student & Learner Behavior Analysis
Formal early learning is gaining ground, although household affordability still affects access. India’s enrollment among 3–5-year-olds in pre-primary institutions increased from 68.1% in 2018 to 77.4% in 2024. Kenya had 2.91 million pre-primary pupils in 2024, compared with 2.88 million in 2023, and 47,760 pre-primary schools were operating. A controlled trial across 291 Kenyan government pre-primary schools found that digitally personalized learning combined with structured pedagogy improved numeracy and literacy by 0.534 standard deviations over 13 months. The result supports blended models when digital content is aligned with classroom instruction. Urban middle-income families in South and Southeast Asia are also supporting blended models that retain in-person socialization and offer curriculum personalization.
Education Performance Intelligence
Enrollment growth is outpacing the supply of qualified teachers in many pre-primary systems. Early Head Start programs in the United States reported nearly 9 teacher vacancies per program during the 2023–24 school year, and more than half faced difficulty recruiting qualified teachers. England’s workforce strategy also identifies limited career progression and retention challenges in settings serving disadvantaged communities. Digital use remains uneven, with 30% of United States pre-kindergarten teachers reporting work-related generative AI use during 2024–25. Fewer than half of surveyed teachers had used educational programs on digital platforms, while communication tools were more common. The pre-primary education market has room for platforms that reduce administrative burdens while supporting instruction and teacher development.
Pre-Primary Education Market Segment Analysis
By Curriculum:
National Frameworks Anchor Spending, International Models Lead GrowthNational and state curricula accounted for 77.1% of the pre-primary education market size in 2026. Government and publicly funded schools, which largely use national frameworks, represented 80.5% of the institutional base. National curriculum providers benefit from public procurement relationships, multi-year adoption cycles, and common standards. McGraw Hill launched Emerge!, a K–5 English Language Arts program based on the Science of Literacy, in August 2025. The program includes personalized digital learning for educators and learners.
International curricula are forecast to grow at a 5.8% CAGR through 2032. ISC Research recorded 14,833 K–12 international schools in 2025, and Asia contained 58% of the global total. Growth is occurring in Japan, Malaysia, and South Korea alongside expatriate communities and demand from higher-income local families. Dubai recorded 29,634 children across 312 private early childhood centers in 2024–25, with enrollment rising 8%. The Early Years Foundation Stage was the most common of 17 curricula in these centers. Montessori, International Baccalaureate Primary Years, and Waldorf approaches remain premium, specialized options where authorization and training support differentiation.



By School Type:
Public Institutions Dominate, Private Growth OutpacesGovernment and publicly funded schools held 80.5% of the pre-primary education market share in 2026. Universal-access mandates and the scale of national education systems in China, India, and Brazil support this leading position. China reported 40.93 million children in pre-primary education in 2023. Its phased free preschool policy reduced household spending and expanded public support for 12 million pupils in the autumn 2025 semester. Public buyers typically require evidence of outcomes, established delivery capability, and adherence to national standards. This favors suppliers that can support large implementation programs.
Private and independent schools are forecast to grow at a 4.4% CAGR through 2032. Premium operators such as Nord Anglia and Cognita are expanding through management agreements and partnerships in Gulf markets. Cognita entered Saudi Arabia, Oman, and Qatar in December 2025 through partnerships with 5 schools. The expansion brought Cognita’s Middle East network to 14 schools and introduced its management model to 3 new Gulf markets. Affordable private operators are using franchise structures to reach families outside major cities. The school type mix supports different demand profiles, from large public procurement to specialized private curricula and family-facing services.
By Learning Mode:
Offline Remains Structural Baseline, Online Accelerates from Low BaseOffline and traditional classroom learning held 88.8% of the pre-primary education market share in 2026. In-person learning remains central for children aged 3–6 because interaction, supervision, and licensing requirements are difficult to replicate fully online. Online and virtual learning is forecast to grow at a 10.0% CAGR through 2032 from a lower base. A study of 2,148 early childhood education teachers in Spain found that expectations about the future availability and use of digital resources were the strongest predictor of adoption. The study found that these expectations mattered more than technical knowledge.
Blended learning offers a middle course between classroom delivery and online personalization. It retains physical interaction while giving teachers access to recorded materials, assessment tools, and differentiated activities. The Kenyan trial shows that digital tools can improve learning outcomes when integrated into structured classroom practice. Pearson issued updated iPrimary Early Years materials and professional development modules, including AI integration training, during 2025–2026. These modules address classroom management and teacher capability alongside digital content. Learning-mode competition will therefore depend on implementation support rather than technology access alone.

Geography Analysis
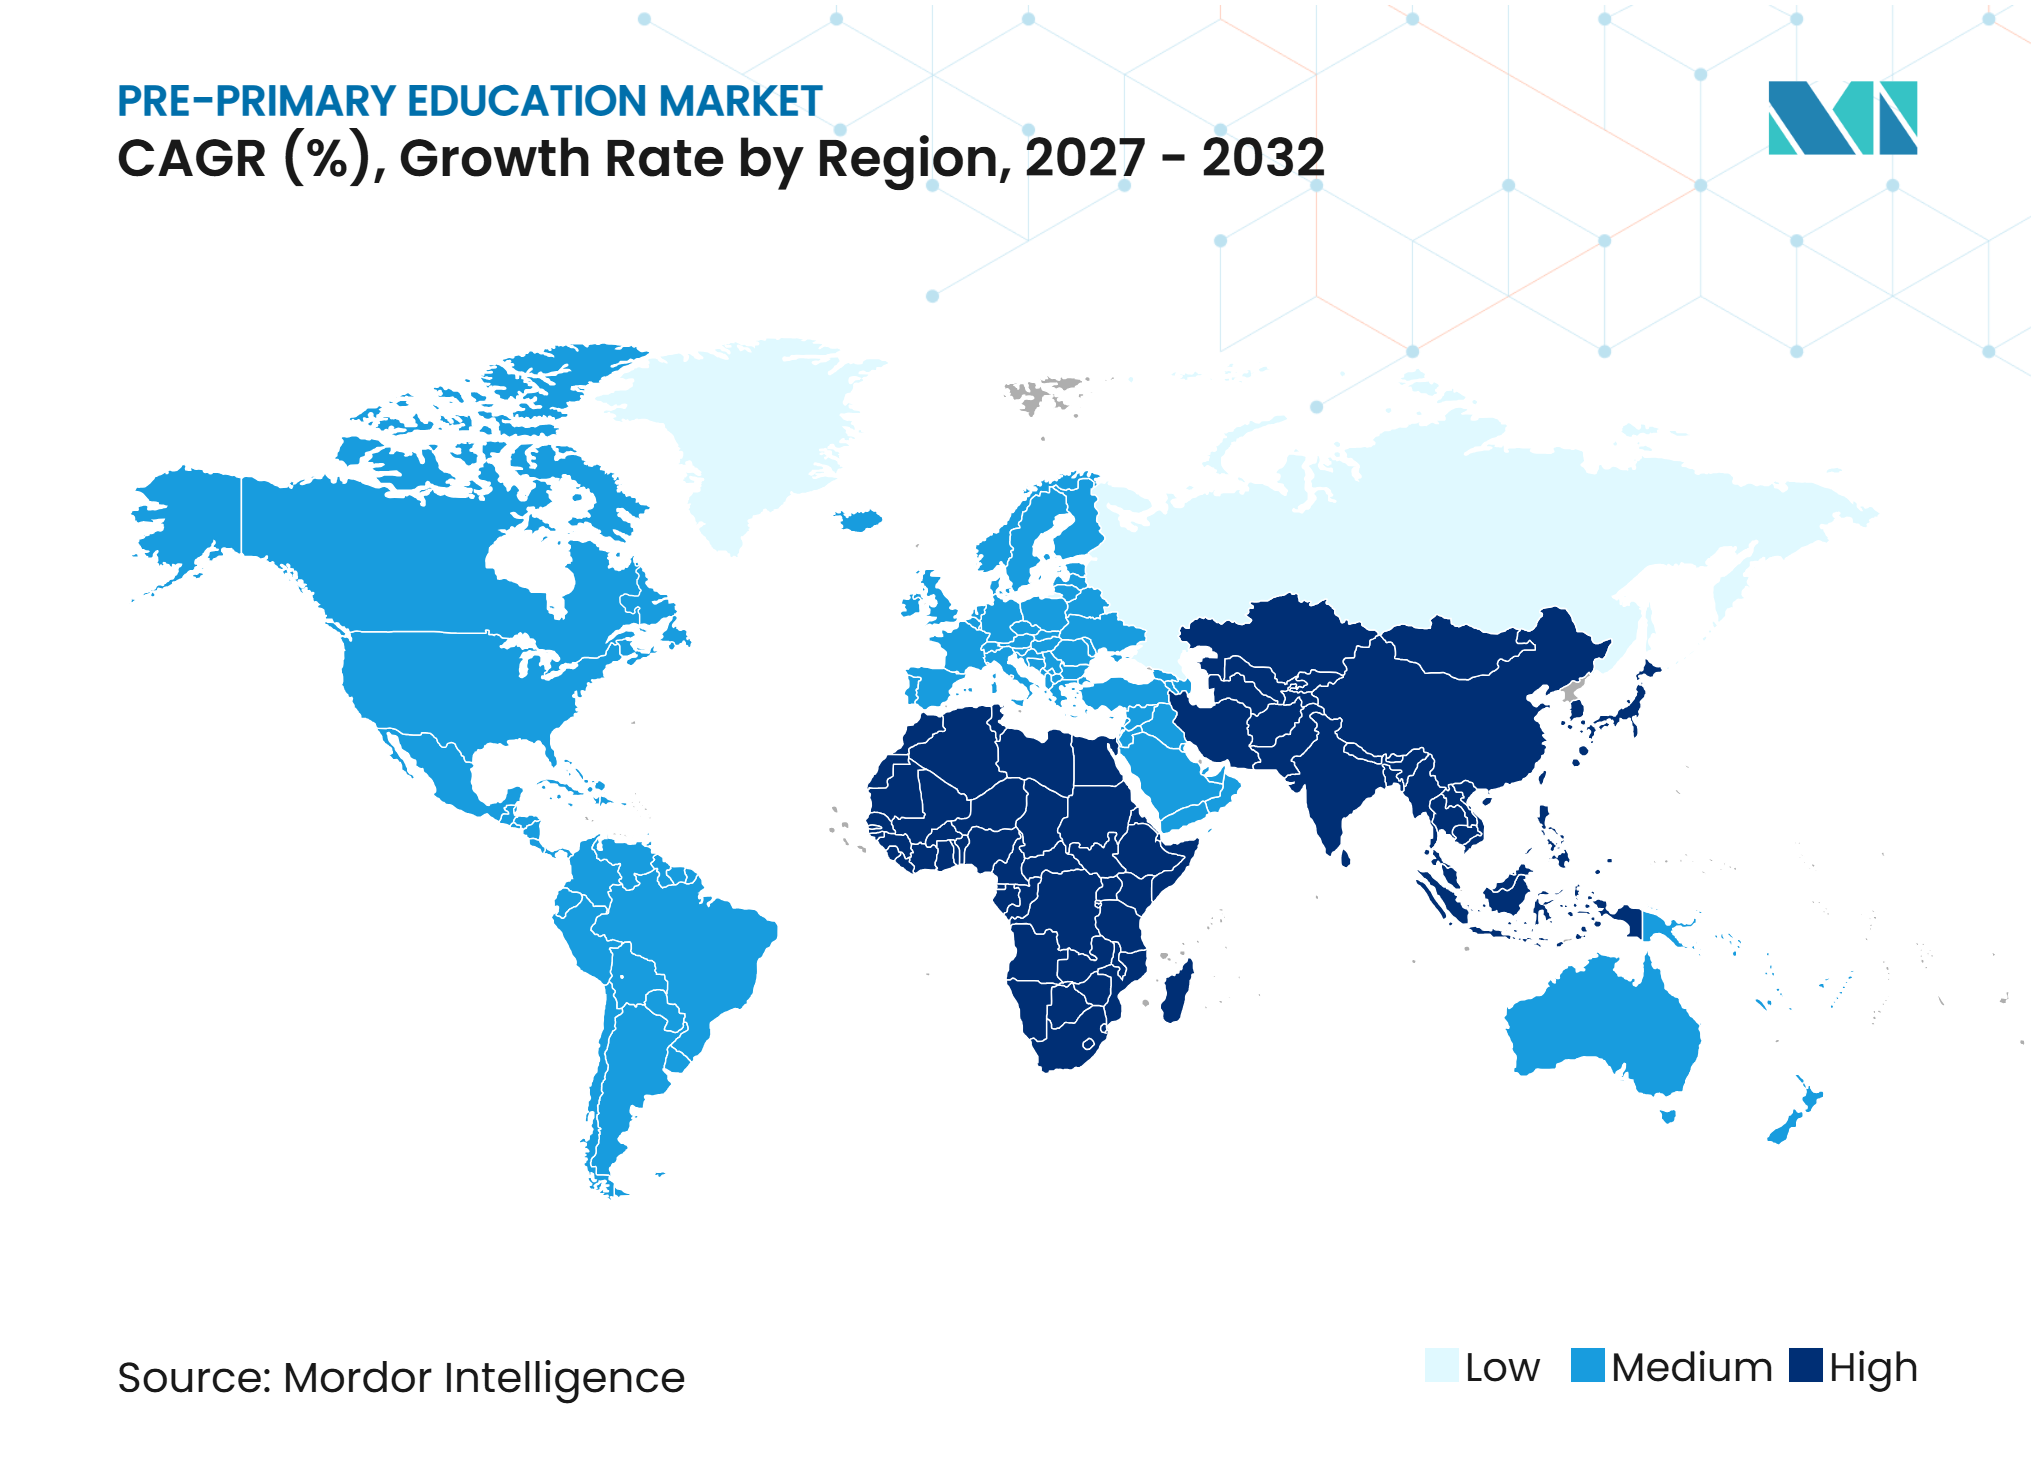
Asia-Pacific held 40.2% of the pre-primary education market share in 2026 and is forecast to grow at a 5.4% CAGR through 2032. China’s official statistics recorded 40.93 million children in pre-primary education in 2023. China’s phased free preschool policy targets 12 million pupils in the autumn 2025 semester. India’s pre-primary enrollment among 3–5-year-olds reached 77.4% in 2024, supporting continued formalization of early learning. Singapore illustrates more advanced digital adoption, although its guidance on children’s screen use shows that technology integration is being managed through policy.
Africa has an 8.4% five-year growth outlook, supported by population growth, enrollment programs, and public investment. Morocco’s enrollment rate for children aged 4–5 increased from 50.2% in 2015 to 70.4% in 2025. Rural public preschool units rose from 6,185 in 2018–19 to 23,182 in 2024–25. Côte d’Ivoire reached 4,727 pre-primary schools in 2025, but its gross enrollment rate was only 12.29%. Enko Education's USD 24 million financing round is an example of private capital entering the region’s middle-income international education segment.
North America has a 5.2% five-year growth outlook that is supported by digital adoption, supplemental learning, and attendance recovery. Canada’s workforce pressure limits the expansion of licensed provision, even where fee-reduction programs support family demand. Europe has a 4.6% outlook, with stable or falling headcount enrollment offset by rising per-child spending in several mature systems. Germany was an exception, with enrollment rising 17.5% over 10 years to 2.61 million in 2024. South America has a 6.8% outlook, supported by Brazil’s 6.7% enrollment rise to 5.30 million in 2024 and the expansion of affordable private-school models.
Competitive Landscape
Market Concentration
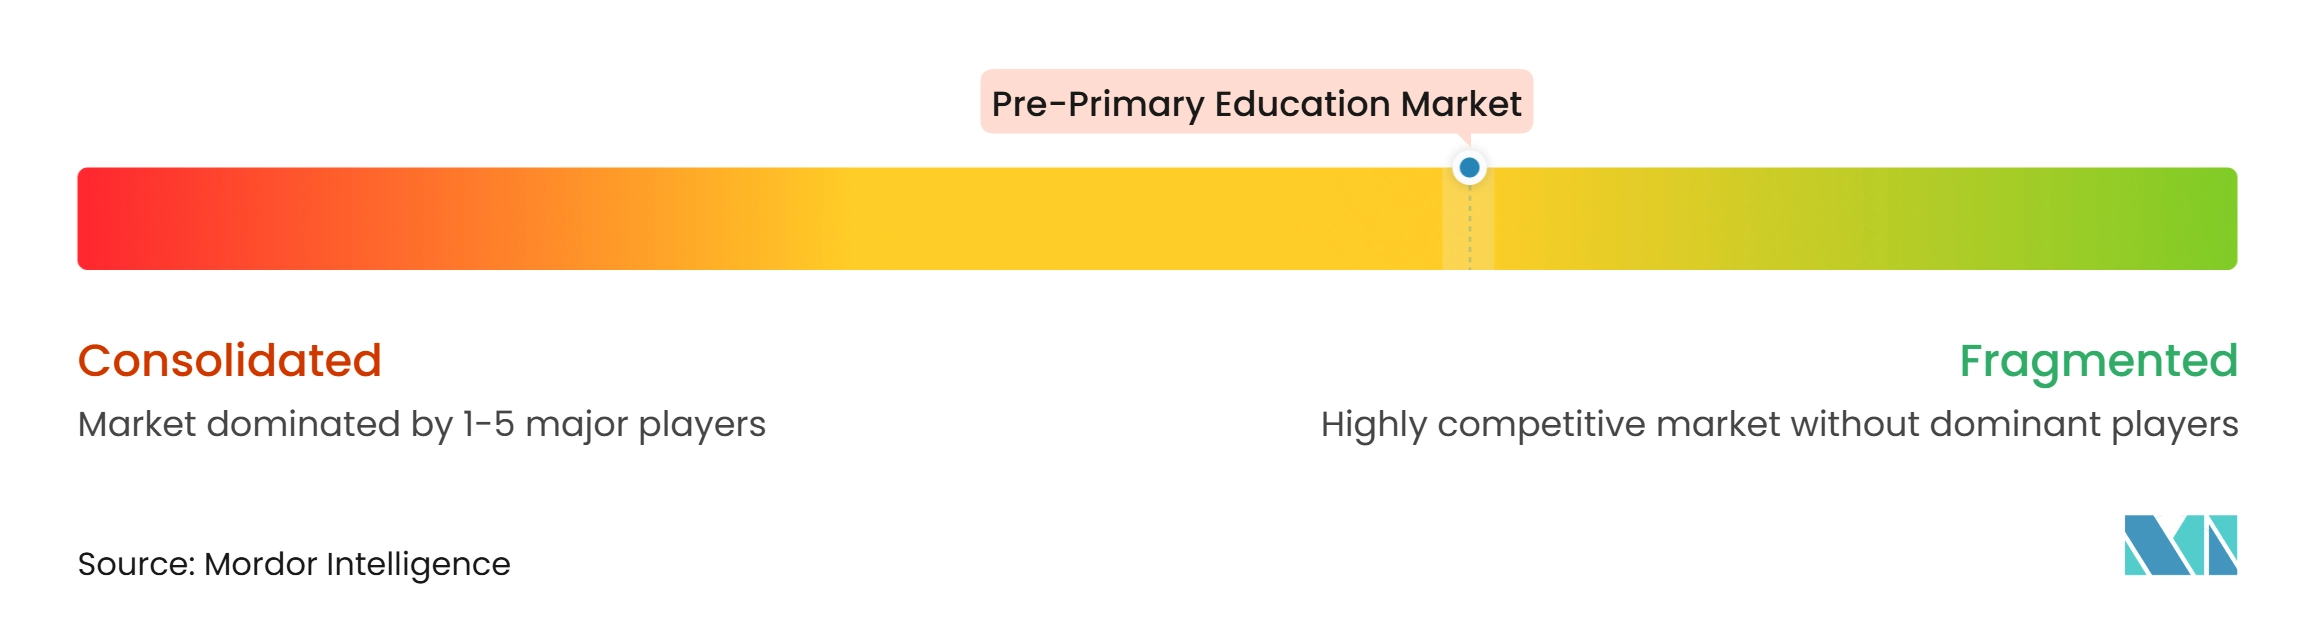
The pre-primary education market is fragmented, and the top 5 players collectively hold less than 40% combined share. Curriculum publishers including Pearson, McGraw Hill, Scholastic, and HMH compete through content, assessment, and institutional relationships. Alphabet, Microsoft, and Apple operate in the hardware and platform layer, while Nord Anglia, GEMS, and Cognita operate school networks. Age of Learning, ClassDojo, and Discovery Education compete for supplemental learning and family engagement. No provider has meaningful scale across curriculum, platforms, school operations, and supplemental learning at the same time. This separation encourages partnerships where buyers need integrated content, data, and instructional workflows.
Low-cost private operators and AI-focused platforms are seeking growth in different parts of the value chain. PHINMA, Enko Education, and Innova Schools illustrate the role of standardized networks in emerging markets. The Kenya study supports offline-capable digital learning where connectivity is limited and teacher-led pedagogy is maintained. Child-data requirements such as COPPA and GDPR can raise entry barriers for smaller platforms that lack established compliance processes. Established providers can use privacy controls, content alignment, and teacher support to strengthen their position with schools and families.
Pre-Primary Education Industry Leaders
-
Pearson plc
-
McGraw Hill LLC
-
Scholastic Corporation
-
Houghton Mifflin Harcourt
-
Microsoft Corporation
- *Disclaimer: Major Players sorted in no particular order
Pre-Primary Education Market Companies Covered in this Report
- Pearson plc
- Cengage Group
- McGraw Hill LLC
- Scholastic Corporation
- Houghton Mifflin Harcourt
- Amplify Education, Inc.
- Alphabet Inc.
- Microsoft Corporation
- Apple Inc.
- Instructure Holdings, Inc.
- PowerSchool
- D2L Corporation
- Discovery Education
- Age of Learning, Inc.
- ClassDojo, Inc.
- Stride, Inc.
- Khan Academy
- Nord Anglia Education
- GEMS Education
- Cognita Schools
Recent Industry Developments in Pre-Primary Education Market
- September 2026: Scholastic Corporation signed a definitive agreement to acquire Cottage Door Press, a leading independent early childhood publisher, for USD 71 million. Cottage Door generated USD 45 million in net revenue in the 12 months ended May 2026, and the acquisition is expected to be EBITDA-accretive in its second year. The deal expands Scholastic’s early childhood publishing portfolio and signals a recommitment to pre-K content after a period of portfolio rationalization.
- August 2025: McGraw Hill launched Emerge!, its flagship K–5 Core English Language Arts curriculum, rooted in the Science of Literacy and offering personalized digital learning experiences for educators and learners in the pre-primary and early primary segments. The product competes in the science-of-reading curriculum replacement cycle across United States school districts.
- June 2025: McGraw Hill and Pearson announced a collaboration to integrate Pearson’s PRoPL interim assessment solution into McGraw Hill’s core K–12 curriculum products. The partnership creates an assessment-and-curriculum workflow for millions of students globally.
- January 2025: Enko Education raised USD 24 million from Africa Capitalworks and Adiwale Partners to triple its learner body to 20,000 students by 2029 across 10 sub-Saharan African countries. The funding supports a buy-and-build strategy for the middle-class international education segment.
Key Questions Answered in the Report
What is the projected value of the pre-primary education sector by 2032?
The sector is projected to reach USD 2.179 trillion by 2032, growing at a 3.3% CAGR between 2027 and 2032.
Which region has the largest share of pre-primary education spending?
Asia-Pacific held a 40.2% share in 2026 and is forecast to grow at a 5.4% CAGR through 2032.
Which curriculum category is growing fastest?
International curricula are forecast to grow at a 5.8% CAGR through 2032, supported by international school expansion and expatriate demand.
Why is digital learning growing in early education?
Blended tools can support personalized learning and structured pedagogy, as shown by a Kenyan trial that improved combined numeracy and literacy by 0.534 standard deviations.
What limits expansion of early childhood education providers?
Budget pressure, teacher shortages, rural connectivity gaps, and fragmented procurement can slow enrollment expansion and technology adoption.
Which providers are shaping the global competitive environment?
Major participants include Pearson, McGraw Hill, Scholastic, Alphabet, Microsoft, Apple, Nord Anglia, GEMS, Cognita, Age of Learning, ClassDojo, and Discovery Education.