
Pre-engineered Buildings (PEB) Construction Market Size and Share
Market Overview
| Study Period | 2021 - 2032 |
|---|---|
| Market Size (2027) | USD 67.10 Billion |
| Market Size (2032) | USD 108.22 Billion |
| Growth Rate (2027 - 2032) | 10.00 % |
| Fastest Growing Market | Asia-Pacific |
| Largest Market | North America |
| Market Concentration | Low |
Major Players *Disclaimer: Major Players sorted in no particular order Image © Mordor Intelligence. Reuse requires attribution under CC BY 4.0. | |
Pre-engineered Buildings (PEB) Construction Market Analysis by Mordor Intelligence
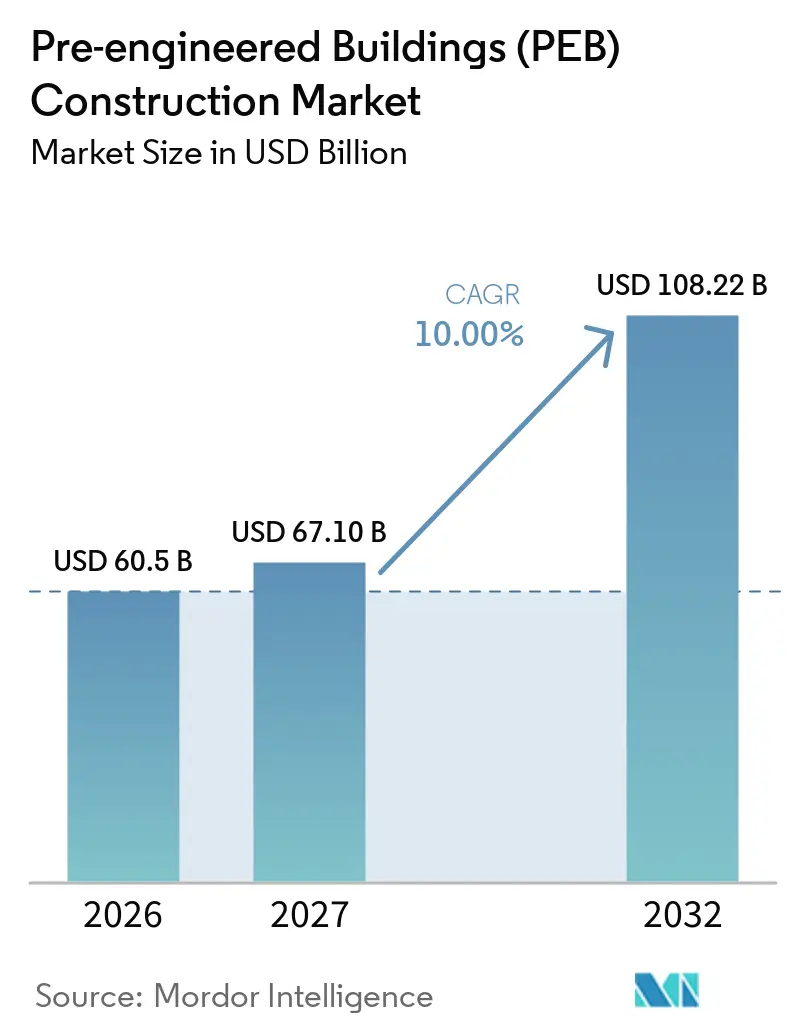
The Pre-engineered Buildings Construction Market size is expected to grow from USD 60.5 billion in 2026 to USD 67.10 billion in 2027 and is forecast to reach USD 108.22 billion by 2032 at 10% CAGR over 2027-2032. Demand is moving beyond routine warehouse construction toward facilities that must be delivered quickly, including fulfillment centers, data centers, factories, and infrastructure-related buildings. This favors suppliers that can fabricate components off-site while foundations and site works progress at the same time. The pre-engineered building construction market also benefits when owners need clear spans, high eave heights, and repeatable building layouts across several locations. Cost pressure and contractor availability remain material constraints, but they also increase the value of predictable engineering and controlled supply chains. Larger manufacturers are responding through capacity additions, integrated steel supply, digital fabrication, and targeted expansion into technical facilities.
Key Report Takeaways
- By structure, single-story buildings held 68.4% of the pre-engineered building construction market share in 2026 and represented the largest contribution to the pre-engineered building construction market size, while multi-story buildings are forecast to grow at a 10.8% CAGR through 2032.
- By product type, panelized and componentized systems held 39% of the pre-engineered building construction market share in 2026 and represented the largest contribution to the pre-engineered building construction market size, while modular buildings are forecast to grow at a 12% CAGR through 2032.
- By application, industrial buildings held 57.2% of the pre-engineered building construction market share in 2026 and represented the largest contribution to the pre-engineered building construction market size, while commercial applications are forecast to grow at an 11.4% CAGR through 2032.
- By geography, North America held 34.8% of the pre-engineered building construction market share in 2026 and represented the largest contribution to the pre-engineered building construction market size, while Asia-Pacific is forecast to grow at an 11.8% CAGR through 2032.
Note: Market numbers in this report are based on Mordor Intelligence's proprietary estimation framework, which combines nine months of actuals with Q4 projections for base year 2026.
Global Pre-engineered Buildings (PEB) Construction Market Trends and Insights
Drivers Impact Analysis*
| Drivers | (~) % Impact on CAGR Forecast | Geographic Relevance | Impact Timeline |
|---|---|---|---|
| Warehouse, Logistics, and E-Commerce Fulfillment Buildouts | +3.0% | Global, concentrated in North America and Asia-Pacific, including India, China, and Vietnam, with spillover to the Middle East, Africa, and South America | Short term (≤ 2 years) |
| Parallel Factory Fabrication and On-Site Erection | +2.0% | Global | Short term (≤ 2 years) |
| Data Center and Advanced Manufacturing Shell Construction | +1.8% | North America, Europe, and the Asia-Pacific, expanding to the Middle East and Africa | Medium term (2-4 years) |
| Nearshoring and Industrial Capacity Relocation | +1.4% | North America, including the Mexico border region, Eastern Europe, Vietnam, and India | Medium term (2-4 years) |
| Code-Certified Wind and Seismic Resilience | +0.8% | North America, Japan, South Korea, Australia, and Turkey | Long term (≥ 4 years) |
| Digital Design-to-Fabrication and Automated Quality Control | +0.7% | Global, with early adoption in North America and Western Europe, and growing adoption in Asia-Pacific | Long term (≥ 4 years) |
| Source: Mordor Intelligence | |||
Warehouse, Logistics, and E-Commerce Fulfillment Buildouts Anchoring Near-Term Demand
Warehousing and fulfillment projects are a major source of demand because they need wide, unobstructed interiors, loading docks, high clearances, and fast handover. The pre-engineered building construction market meets these needs through standardized steel frames and panel systems that can be manufactured while site preparation continues. The supplied American Institute of Architects analysis stated that tariff-related delays represented 22% of total project delays in 2025, compared with 9% in 2023, making schedule reliability more important for project owners. E-commerce operators and third-party logistics providers often develop hub-and-spoke networks that require several mid-sized facilities at once. This project pattern favors suppliers with repeatable systems, regional installation capacity, and dependable material planning. It also creates an advantage for manufacturers serving fast-expanding logistics corridors in India, Vietnam, and Mexico.
Parallel Factory Fabrication and On-Site Erection Compressing Project Timelines
Pre-engineered construction separates factory production from site work, allowing frames, panels, and related components to be prepared while foundations are installed. The resulting overlap can shorten the path to a weather-tight enclosure compared with a sequential construction process. This benefit matters when commissioning dates are tied to lease commitments, equipment installation, or tenant operations. Standardized component schedules also let suppliers purchase materials earlier and set specifications before site conditions create further changes. The pre-engineered building construction market, therefore, rewards companies that control engineering, procurement, fabrication, and erection as one coordinated process. This model is particularly valuable where buyers place a premium on delivery certainty rather than the lowest initial unit price.
Data Center and Advanced Manufacturing Shell Construction Opening a High-Value Segment
Data centers, semiconductor facilities, battery plants, and pharmaceutical sites need large structural shells with clear spans, heavy floor capacity, crane provisions, and disciplined construction schedules. The pre-engineered building construction market is well-positioned for these requirements because engineered steel systems can be adapted to defined process layouts and expanded as capacity grows. Nucor stated that its electric arc furnace steelmaking has a greenhouse gas intensity one-third of the global average for extractive steelmaking. This factor supports specifications with embodied-carbon requirements[1]. Technical facilities also require a reliable building envelope before mechanical and electrical installation can begin. Modular and preassembled elements can improve repeatability where owners build several facilities using similar designs. These projects are larger and more complex than conventional industrial sheds, which raises the importance of supplier qualifications and project controls.
Nearshoring and Industrial Capacity Relocation Generating Structural Demand
Supply-chain diversification is supporting industrial real estate development in North America, Eastern Europe, and Southeast Asia. The pre-engineered building construction market benefits because new plants commonly require adjacent storage, supplier facilities, logistics space, and service buildings. The supplied Columbia Business School Milstein Center material placed vacancy in Mexico’s border-region industrial parks at 4.4% in the fourth quarter of 2025, indicating rapid absorption of available space. Semiconductor and advanced-manufacturing investments also create demand beyond the primary production building. Suppliers, transport providers, and maintenance contractors need nearby facilities that can be delivered on tight schedules. This layered development pattern increases the number of potential projects within each manufacturing investment zone.
Restraints Impact Analysis*
| Restraints | (~) % Impact on CAGR Forecast | Geographic Relevance | Impact Timeline |
|---|---|---|---|
| Steel and Zinc-Coated Coil Price Volatility | -1.5% | Global, most acute in North America and regions dependent on imported steel | Short term (≤ 2 years) |
| Certified Erector and Welder Shortages | -1.2% | Global, most severe in North America, Western Europe, and high-growth Asia-Pacific locations | Medium term (2-4 years) |
| Permitting and Code-Approval Delays for Large-Span Structures | -0.5% | North America and Europe | Medium term (2-4 years) |
| Freight Disruption and Project-Site Logistics Exposure | -0.4% | Global, concentrated in island nations and landlocked developing locations | Short term (≤ 2 years) |
| Source: Mordor Intelligence | |||
Steel and Zinc-Coated Coil Price Volatility Compressing Project Margins
Steel and zinc-coated coil costs affect the economics of pre-engineered systems because structural frames, purlins, girts, and wall panels require significant metal content. The U.S. Bureau of Labor Statistics data cited in the supplied draft showed steel mill product prices rising 13.1% year over year in the third quarter of 2025, while iron and steel rose 9.2% and fabricated structural metal products rose 5.9%[2]. Material swings can reduce quoted margins or require suppliers to renegotiate projects that have long procurement cycles. Zinc-coated coil adds exposure to galvanizing costs and zinc availability beyond the cost of structural steel alone. The pre-engineered building construction market, therefore, gives an advantage to companies with long-term mill contracts, inventory capacity, or captive steel supply. Smaller regional suppliers that purchase on the spot market remain more exposed to rapid price movements.
Certified Erector and Welder Shortages Emerging as a Critical-Path Constraint
Qualified erectors and certified welders are essential to complete steel buildings safely and on schedule. The American Welding Society projected a shortage exceeding 400,000 welders in the United States, and the supplied draft noted an average welder age of 55 years[3]. Limited labor availability can delay envelope completion, which in turn slows mechanical, electrical, and interior trades. This issue is most pressing at data-center and advanced-manufacturing sites where commissioning dates are fixed. The pre-engineered building construction market requires manufacturers to develop installation partners, training programs, and realistic labor schedules. A limited pool of certified personnel also allows qualified contractors to charge higher erection rates.
*Our forecasts treat driver/restraint impacts as directional, not additive. The impact forecasts reflect baseline growth, mix effects, and variable interactions.
Segment Analysis
By Structure: Single-Story Buildings Lead Established Demand, While Multi-Story Buildings Grow Faster
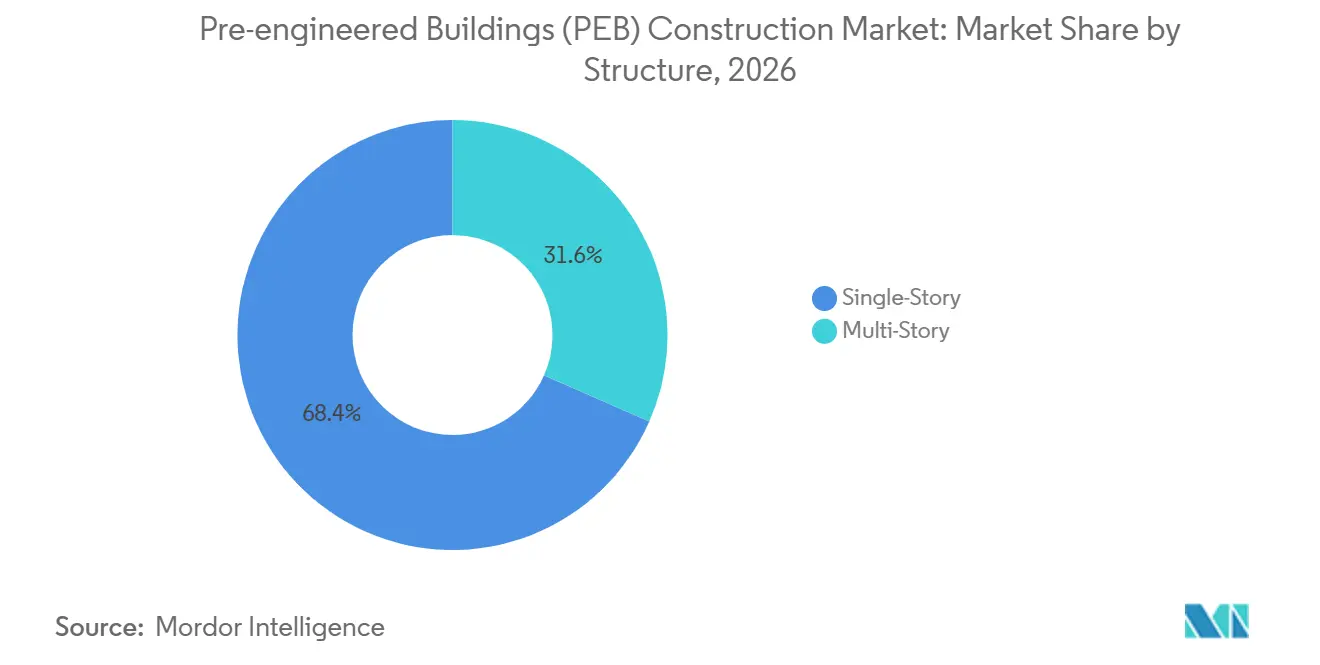
Single-story structures held 68.4% of the pre-engineered building construction market share in 2026. Their position reflects demand from logistics centers, factories, agricultural buildings, and warehouses that need broad floorplates without internal columns. These structures typically have lower foundation complexity and simpler erection sequences than taller alternatives. They also suit sites where high eave clearances, loading bays, and equipment movement are central design requirements. The pre-engineered building construction market uses this format for projects that need practical layouts and rapid delivery.
Multi-story structures are forecast to expand at a 10.8% CAGR during 2027-2032. Growth comes from urban infill locations where limited land availability makes vertical development necessary. Developers can use steel primary frames with concrete podiums and transfer slabs to combine logistics, commercial, or office functions within constrained sites. The 2024 International Building Code and ASCE 7-22 requirements make certified design especially important for high-occupancy and mission-critical structures. Digital design methods can make complex modular arrangements more workable by linking calculations to fabrication data.
By Product Type: Panelized and Componentized Systems Remain the Broadest Format, While Modular Buildings Expand
Panelized and componentized systems accounted for 39% of the pre-engineered building construction market in 2026. They are used across warehouses, factory shells, institutional facilities, agricultural storage, and hybrid projects that combine conventional structural elements with factory-produced components. The format gives developers flexibility because panels and components can be adapted to varied spans, building envelopes, and site conditions. Established supply chains also support consistent production for widely used wall and roof systems. These attributes make panelized systems suitable for projects where a fully modular solution is not required.
Modular buildings are forecast to register a 12% CAGR from 2027 to 2032. Demand is supported by relocatable worker housing, data-center pods, remote healthcare facilities, and projects that require repeatable room layouts. The pre-engineered building construction market benefits from modular production because designs can be manufactured once and repeated across locations. Autodesk workflows that connect design models with fabrication equipment can raise prefabrication levels and reduce field rework. Demountable structures also provide flexibility for occupiers whose space requirements may change.
By Application: Industrial Buildings Anchor Revenue, While Commercial Applications Gain Momentum
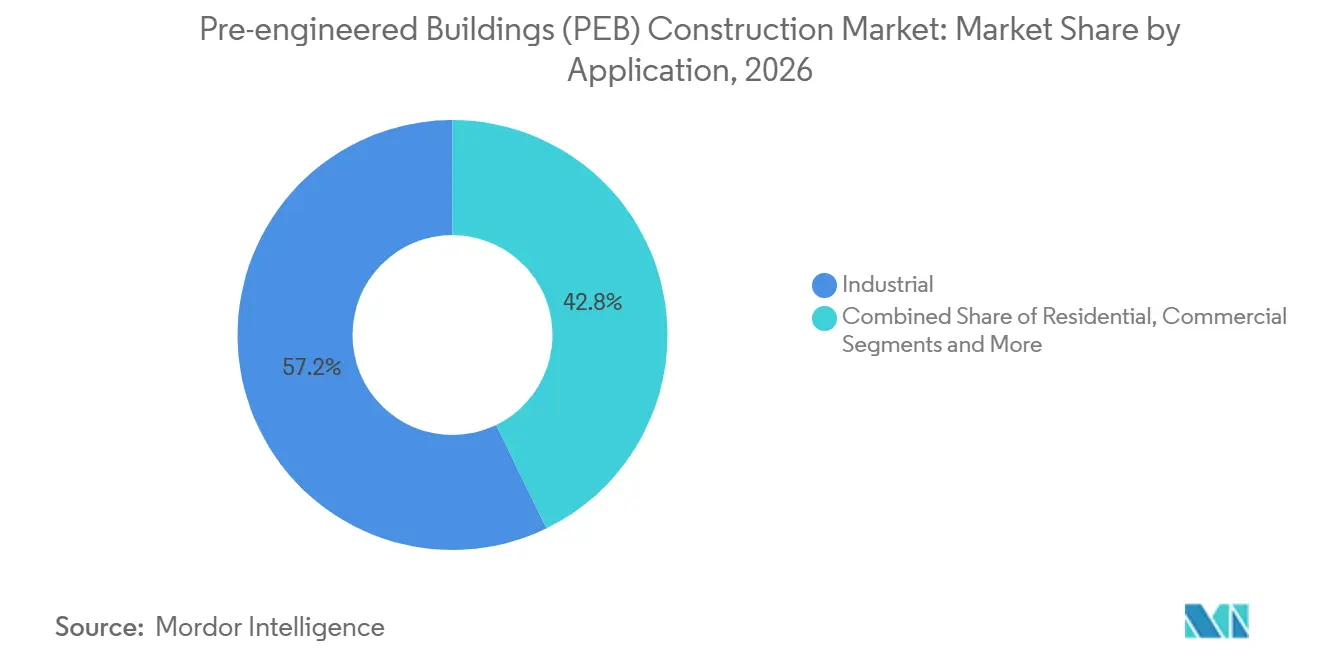
Industrial buildings accounted for 57.2% of the pre-engineered building construction market share in 2026. Manufacturing plants, logistics centers, processing facilities, and storage sites require long spans, high clearances, and layouts that can accommodate machinery or material handling. Industrial buyers also tend to make repeat purchases as they add production lines or open facilities in new locations. This supports durable relationships between established suppliers and major occupiers. The pre-engineered building construction market serves these buyers with standardized systems that can be adapted to site-specific loads and operational needs.
Commercial applications are forecast to grow at an 11.4% CAGR during 2027-2032. Retail complexes, hypermarkets, mixed-use projects, and transit-oriented developments use pre-engineered systems when fast delivery and future reconfiguration are important. In July 2026, Zamil Steel India delivered a 90,000-square-meter facility for Carl Zeiss India in Bangalore that weighed 9,000 metric tons and required two 700-ton cranes with a 100-meter reach. The project shows how technical expectations are extending beyond basic industrial sheds. Data centers, semiconductor-adjacent buildings, and advanced-manufacturing campuses further blur the distinction between industrial and commercial construction.

Geography Analysis
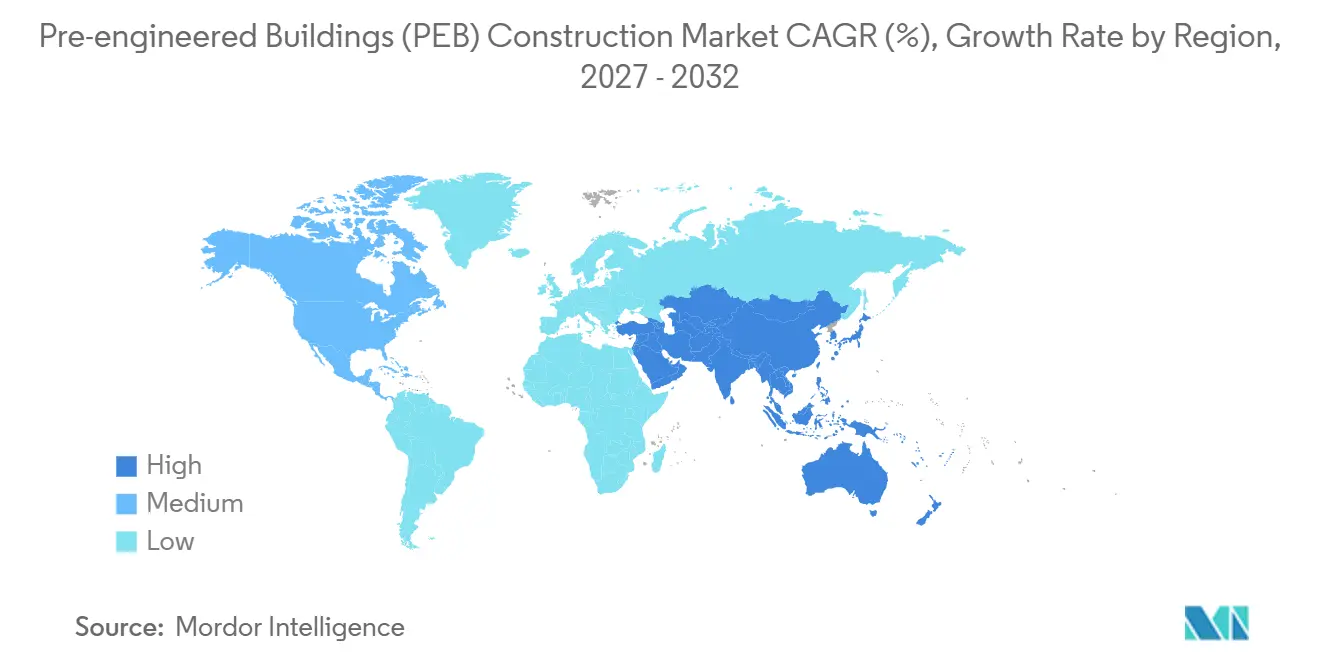
North America held 34.8% of global market revenue in 2026. The region is supported by industrial reshoring, fulfillment infrastructure, data-center development, and federal programs that encourage domestic manufacturing. The supplied draft stated that U.S. manufacturing construction spending remained more than double its pre-2022 level in April 2026, based on Federal Reserve economic data. The Columbia Business School material cited rapid absorption of industrial space in established Mexican corridors.
Asia-Pacific is forecast to grow at an 11.8% CAGR from 2027 to 2032. India is becoming both a major buyer and producer of pre-engineered systems as data centers, semiconductor projects, renewable installations, airports, metro rail, and industrial units add building demand. Tiger Steel Engineering stated in August 2025 that Indian demand for pre-engineered buildings was approaching 0.8-1 million metric tons a year. Vietnam’s export-oriented industrial parks and China’s domestic construction base add further demand channels. ATAD Steel Structure Corporation’s participation in HAKI Jakarta 2026 reflected its effort to deepen ties with Indonesian developers, consultants, and contractors.
Europe, the Middle East and Africa, and South America add distinct demand patterns to the pre-engineered building construction market. Eastern Europe benefits from manufacturing relocation toward lower-cost production locations, while Kingspan has added building-envelope facilities in Germany, the Czech Republic, and Romania. In February 2025, Alghanim Industries broke ground on a Kirby Building Systems facility in Sudair Industrial City with a planned annual capacity of 100,000 metric tons of pre-engineered buildings and 100,000 metric tons of structural steel. Brazil and Argentina support early-stage adoption through agricultural storage, logistics, and commercial construction. These regions offer opportunities in the pre-engineered building construction market, but they also require suppliers to manage local approvals, freight conditions, and steel availability.
Competitive Landscape
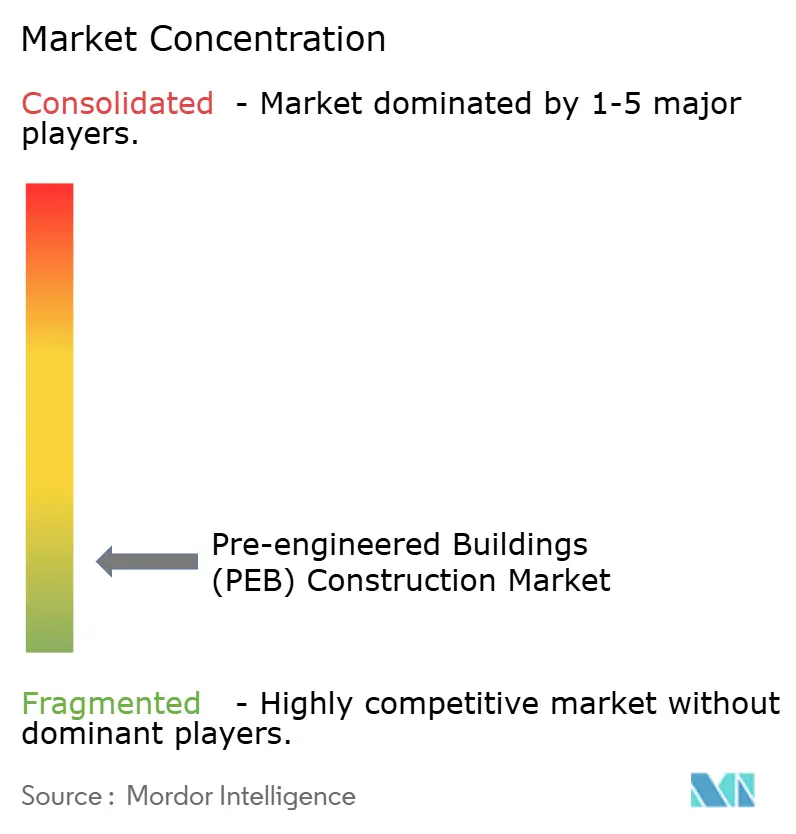
The pre-engineered building construction market is moderately fragmented because regional fabricators compete alongside larger integrated manufacturers. The top 10 players command a minority of global revenue, while local suppliers compete through price, relationships, and project responsiveness. Larger companies have an advantage in complex projects because they can manage steel procurement, engineering, fabrication, and erection in a coordinated way. This lowers supply-chain risk for owners with fixed opening or commissioning dates. Zamil Steel and Kirby Building Systems have broad manufacturing networks across the Gulf Cooperation Council, South Asia, and Southeast Asia.
Consolidation is also shaping the competitive environment. In October 2026, IES Holdings completed its acquisition of DBM Global for a total consideration of USD 691 million, adding a structural steel fabrication and erection platform that serves data centers, industrial buildings, stadiums, and infrastructure projects. The acquired company generated USD 1.5 billion in revenue in the 12 months ended June 2026, according to the supplied filing-based material. The transaction illustrates why scale is becoming more valuable in the pre-engineered building construction market as technical construction demand rises. These moves can expand addressable work while increasing the qualification threshold for smaller competitors.
Indian manufacturers are pursuing capacity and technical specialization. In May 2025, Interarch Building Solutions opened a heavy structural steel facility in Nellore, Andhra Pradesh, with an initial capacity of 25,000 metric tons a year and announced a Canadian joint venture for complex export-oriented structures. EPACK Prefab Technologies formed a dedicated subsidiary for hyperscale data-center structures using Design for Manufacturing and Assembly methods, according to the supplied company-related material. Kingspan reported that its Advnsys division grew 34% in the first half of 2026 on data-infrastructure demand.
Pre-engineered Buildings (PEB) Construction Industry Leaders
-
BlueScope Steel Limited
-
Nucor Corporation
-
Zamil Steel Holding Company
-
Kirby Building Systems
-
Everest Industries Limited
- *Disclaimer: Major Players sorted in no particular order
Recent Industry Developments
- October 2026: IES Holdings, Inc. completed the acquisition of DBM Global Inc. for total consideration of USD 691 million in cash and IES common stock. DBM Global generated USD 1.5 billion in revenue for the 12 months ended June 2026 and is a vertically integrated structural steel fabrication and erection platform serving data centers, industrial, stadium, and infrastructure projects across the United States through brands including Schuff Steel, Banker Steel, and GrayWolf.
- September 2026: Everus Construction Group completed the USD 295 million acquisition of Epsilon Industries, a designer and manufacturer of complex modular mechanical and electrical building infrastructure systems with off-site construction capabilities across facilities in the United States and Canada. The acquisition expanded Everus’s presence in data center, advanced manufacturing, and healthcare end markets.
- July 2026: Zamil Steel India delivered a pre-engineered building for Carl Zeiss India Pvt. Ltd. in Devanahalli, Bangalore. The 90,000-square-meter facility weighed 9,000 metric tons and used two 700-ton cranes with a 100-meter reach.
Global Pre-engineered Buildings (PEB) Construction Market Report Scope
| Single-Story |
| Multi-Story |
| Modular Buildings |
| Panelized and Componentized Systems |
| Other Prefabricated Building Types |
| Residential |
| Commercial |
| Industrial |
| Institutional |
| Others |
| North America | United States | |
| Canada | ||
| Mexico | ||
| South America | Brazil | |
| Argentina | ||
| Chile | ||
| Rest of South America | ||
| Europe | Germany | |
| United Kingdom | ||
| France | ||
| Italy | ||
| Spain | ||
| Russia | ||
| Rest of Europe | ||
| Asia - Pacific | China | |
| India | ||
| Japan | ||
| South Korea | ||
| Australia | ||
| Rest of APAC | ||
| Middle East and Africa | Middle East | United Arab Emirates |
| Saudi Arabia | ||
| Turkey | ||
| Rest of Middle East | ||
| Africa | South Africa | |
| Nigeria | ||
| Rest of Africa | ||
| By Structure | Single-Story | ||
| Multi-Story | |||
| By Product Type | Modular Buildings | ||
| Panelized and Componentized Systems | |||
| Other Prefabricated Building Types | |||
| By Application | Residential | ||
| Commercial | |||
| Industrial | |||
| Institutional | |||
| Others | |||
| By Geography | North America | United States | |
| Canada | |||
| Mexico | |||
| South America | Brazil | ||
| Argentina | |||
| Chile | |||
| Rest of South America | |||
| Europe | Germany | ||
| United Kingdom | |||
| France | |||
| Italy | |||
| Spain | |||
| Russia | |||
| Rest of Europe | |||
| Asia - Pacific | China | ||
| India | |||
| Japan | |||
| South Korea | |||
| Australia | |||
| Rest of APAC | |||
| Middle East and Africa | Middle East | United Arab Emirates | |
| Saudi Arabia | |||
| Turkey | |||
| Rest of Middle East | |||
| Africa | South Africa | ||
| Nigeria | |||
| Rest of Africa | |||
Key Questions Answered in the Report
What is the projected size of the pre-engineered building construction market by 2032?
The pre-engineered building construction market is projected to reach USD 108.2 billion by 2032, growing at a 10% CAGR during 2027-2032.
Which structure type has the largest revenue share?
Single-story buildings lead with 68.4% of revenue in 2026 because logistics, manufacturing, and agricultural users need clear-span floor areas.
Which product category is growing fastest?
Modular buildings are forecast to grow at a 12% CAGR through 2032, supported by demand for repeatable and relocatable facilities.
Which application leads demand?
Industrial buildings account for 57.2% of revenue in 2026, supported by factory, storage, processing, and logistics projects.
Which region is growing fastest?
Asia-Pacific is forecast to grow at an 11.8% CAGR through 2032 as industrial parks, data centers, and manufacturing capacity expand.
What are the main constraints on project delivery?
Steel and zinc-coated coil price volatility, shortages of certified erection labor, permitting delays, and freight disruption can increase costs and extend schedules.