
Power and Control Cable Market Size and Share
Market Overview
| Study Period | 2022 - 2032 |
|---|---|
| Market Size (2027) | USD 225.66 Billion |
| Market Size (2032) | USD 313.23 Billion |
| Growth Rate (2027 - 2032) | 6.78 % |
| Fastest Growing Market | Asia-Pacific |
| Largest Market | Asia-Pacific |
| Market Concentration | Medium |
Major Players *Disclaimer: Major Players sorted in no particular order Image © Mordor Intelligence. Reuse requires attribution under CC BY 4.0. | |
Power and Control Cable Market Analysis by Mordor Intelligence
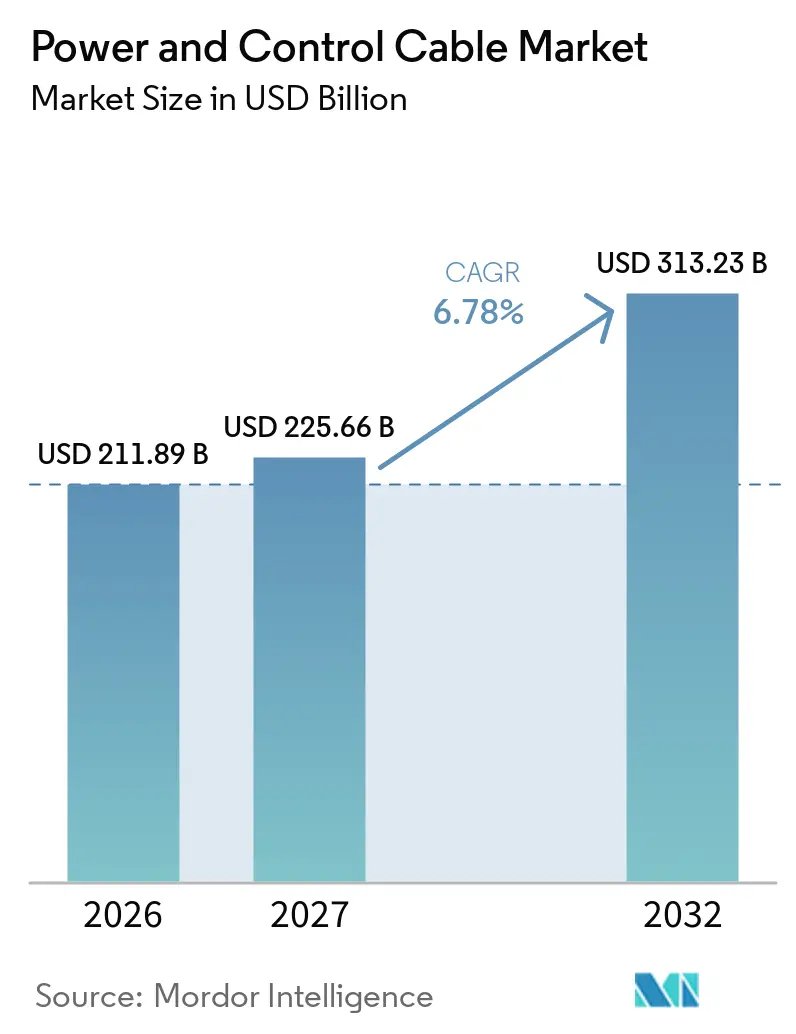
The Power And Control Cable Market size is projected to expand from USD 211.89 billion in 2026 and USD 225.66 billion in 2027 to USD 313.23 billion by 2032, registering a CAGR of 6.78% between 2027 and 2032. The power and control cable market is being shaped by grid expansion, renewable connections, and wider electrification across industry and transport. Long cable procurement periods make qualified manufacturing capacity as important as project demand, especially for high-voltage direct-current systems. Large projects create concentrated demand for high-value power cables, while data centers, charging networks, and smart factories support broader demand for lower-voltage products. Buyers are spreading contracts among qualified suppliers to reduce project risk, while manufacturers are investing in production capacity and installation capability. Material costs and limited vessel availability remain important constraints for power and control of the cable market.
Key Report Takeaways
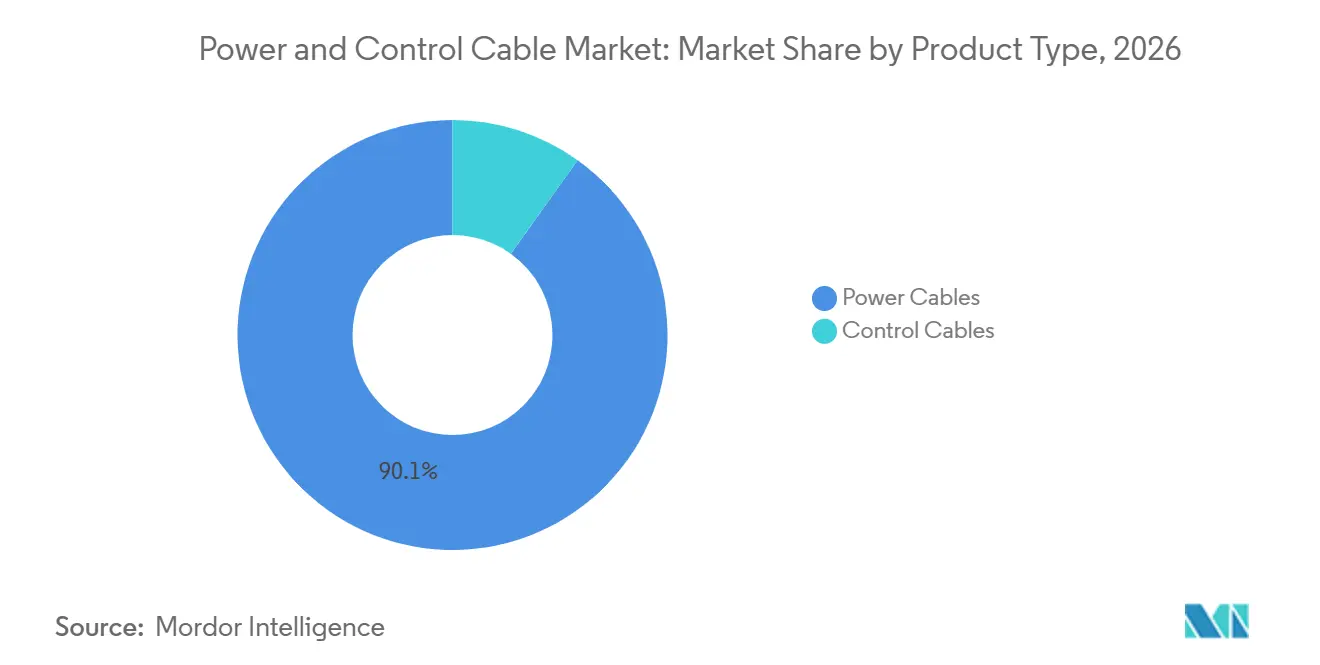
- By product type, power cables held 90.1% of the power and control cable market share in 2026, while power cables are projected to grow at an 8.3% CAGR through 2032.
- By voltage type, low-voltage cables held 62.9% of revenue in 2026, while low-voltage cables are projected to grow at a 9.5% CAGR through 2032.
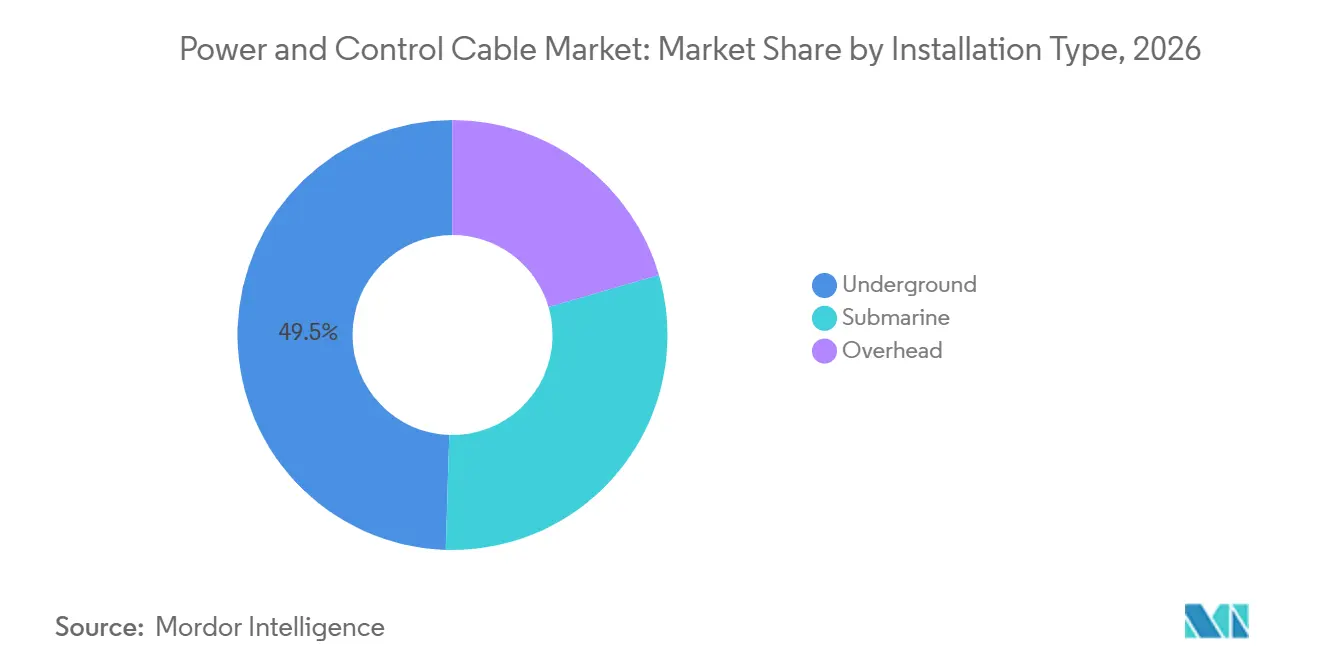
- By installation type, underground cables held 49.5% of revenue in 2026, while submarine cables are projected to grow at an 11.2% CAGR through 2032.
- By end-use industry, energy and utilities held 29.6% of revenue in 2026, while renewable energy is projected to grow at a 9.2% CAGR through 2032.
- By geography, Asia-Pacific held 48.7% of the power and control cable market share in 2026 and is projected to grow at a 9.3% CAGR through 2032.
Note: Market numbers in this report are based on Mordor Intelligence's proprietary estimation framework, which combines nine months of actuals with Q4 projections for base year 2026.
Market Trends and Insights
Drivers Impact Analysis of Power and Control Cable Market*
| Driver | (~) % Impact on CAGR Forecast | Geographic Relevance | Impact Timeline |
|---|---|---|---|
| Grid Modernization and Transmission Expansion | +1.4% | Global, concentrated in the United States, European Union, and China | Medium term (2-4 years) |
| Renewable-Energy Integration and Electrification | +1.5% | Global, strongest in the European Union, China, and India | Long term (≥ 4 years) |
| Offshore Wind and Cross-Border Interconnectors | +0.9% | Northern Europe and East Asia, emerging in the Middle East and Africa | Medium term (2-4 years) |
| Industrial Automation and Smart Manufacturing | +0.5% | Asia-Pacific core, secondary in North America and the European Union | Medium term (2-4 years) |
| Data-Center, EV-Charging, and Digital-Infrastructure Load Growth | +0.7% | North America, European Union, and Asia-Pacific, with spillover to the Middle East and Africa | Short term (≤ 2 years) |
| Subsea Cable Demand from Energy Islands and Long-Distance HVDC | +0.6% | European Union North Sea, East Asia, and the Middle East and North Africa | Long term (≥ 4 years) |
| Source: Mordor Intelligence | |||
Grid Modernization and Transmission Expansion
Grid investment is raising demand for power and controlling cable market because transmission and distribution projects require substantial cable content. Currently planned transmission programs require cable capacity across network corridors, substations, and distribution connections that bring new supply to customers. The International Energy Agency stated in 2025 that lead times for standard cables had risen to 2 to 3 years, while high-voltage direct-current cable lead times extended beyond 5 years.[1] The agency also reported that more than 1,600 GW of solar and wind projects were waiting for grid connections, supporting continued demand for transmission equipment.[2] Updated grid protection requirements can add further design and procurement work for developers. The combination of committed grid projects and long delivery schedules supports demand visibility for qualified cable suppliers.
Renewable-Energy Integration and Electrification
Renewable generation requires cables at the generation site and along with the grid connection, which broadens demand across the power and control cable market. Germany’s SuedLink project is under construction across 6 states and will carry 4 GW of northern wind generation to southern demand centers through 525 kV high-voltage direct-current underground cables.[3] France has announced a EUR 100 billion grid investment plan over 15 years, including an estimated 2,000 km of high-voltage underground cable by 2028. These projects favor cable types that require advanced qualifications, long production runs, and careful route planning. Low-voltage products remain important for distributed energy systems, but the highest-value grid programs concentrate demand in high-voltage systems. This pattern gives qualified producers an opportunity to prioritize capacity for projects with longer order cycles.
Offshore Wind, Interconnectors, and Subsea Cable Demand
Offshore wind and interconnectors are expanding the power and control cable market through larger routes, deeper waters, and higher voltage requirements. The European Commission awarded EUR 645.2 million in funding for the Bornholm Energy Island project in September 2025, which is designed to transmit 3 GW of Baltic Sea wind energy through a 200 km submarine cable system.[4] NKT signed a EUR 650 million contract for the project’s 525 kV cable connection to Zealand. Nexans began installation of the Tyrrhenian Link western section in September 2025, using 500 kV cables at a record depth of 2,150 meters. The Celtic Interconnector began marine cable laying in 2025, although vessel availability and production schedules remained important timing factors. These requirements restrict the number of suppliers that can compete for the most complex subsea contracts.
Digital Infrastructure, Electric Vehicle (EV) Charging, and Industrial Automation
Data centers, charging networks, and automated facilities widen the customer base for power and control cable market. The International Wire and Machinery Association projected data-center cable demand to rise from 264.8 kilotons in 2024 to 727 kilotons by 2029. Charging networks also require high-current connections and supporting distribution equipment that comply with applicable technical standards. Smart manufacturing adds demand for power, control, and shielded cable systems within plants. These applications are more distributed than long-distance transmission programs, creating opportunities for suppliers with construction, industrial, and distribution-channel coverage.
Restraints Impact Analysis of Power and Control Cable Market*
| Restraint | (~) % Impact on CAGR Forecast | Geographic Relevance | Impact Timeline |
|---|---|---|---|
| Copper, Aluminum, and XLPE Input Volatility | -1.3% | Global, most acute in Asia-Pacific manufacturing centers | Short term (≤ 2 years) |
| Permitting and Grid-Connection Delays | -0.9% | North America and the European Union | Medium term (2-4 years) |
| Scarcity of HVDC Installation Vessels and Qualified Jointing Labor | -0.5% | Northern Europe and East Asia | Long term (≥ 4 years) |
| Intermittency-Driven Harmonic Stress and Digital-Cable Cybersecurity Exposure | -0.3% | Global, strongest in Asia-Pacific and the European Union | Long term (≥ 4 years) |
| Source: Mordor Intelligence | |||
Input Costs and Permitting Delays
Copper, aluminum, and insulation materials can change cable pricing and product choices across the power and control cable market. Copper reached USD 10,500 per ton in 2025, and its movement can materially affect products where the metal represents a large share of production cost. Manufacturers may use aluminum alloy conductors in suitable lower-voltage applications when copper costs rise, although project specifications and technical standards limit substitution in many high-voltage uses. Permitting can also be delayed when approved capital plans become cable purchase orders. The International Energy Agency identified permitting as a primary cause of transmission project delays in advanced economies. Connection backlogs and sequential studies can postpone projects even where network investment is planned, which increases uncertainty for suppliers and developers.
Installation Capacity and System Resilience
Limited vessel availability can constrain the power and control cable market where offshore routes require specialized installation work. The Celtic Interconnector’s 2025 marine operation was dependent on vessel availability and production schedules. A shortage of qualified jointing personnel can add another constraint to complex high-voltage projects. Grid systems also face technical risks from changing generation patterns and from digital system exposure. A 2025 scientific study assessed cyberattack vulnerabilities affecting high-voltage direct-current transmission systems. These risks do not reduce the need for infrastructure, but they can extend design, approval, installation, and commissioning periods.
*Our forecasts treat driver/restraint impacts as directional, not additive. The impact forecasts reflect baseline growth, mix effects, and variable interactions.
Power and Control Cable Market Segment Analysis
By Product Type:
Power Cables Anchor Revenue Across Infrastructure ApplicationsPower cables held 90.1% of the power and control cable market size in 2026 and are forecast to grow at an 8.3% CAGR through 2032. Their position reflects the high value of transmission, distribution, renewable connection, and substation applications compared with industrial signal uses. Every large renewable project and grid interconnector requires substantial power cable capacity. High-voltage direct-current and submarine products can have much higher value per kilometer than standard distribution cables. Long manufacturing queues for high-voltage systems also reinforce the importance of early procurement. The power and control cable market therefore depends heavily on producers that can meet advanced project requirements.
Control cables accounted for the remaining 9.9% of revenue in 2026. They serve industrial, marine, and hazardous-area applications where reliable signal transmission and resistance to interference are central requirements. Shielded and armored designs can make control cable pricing less directly dependent on copper movements than power cable pricing. Demand comes from factory automation, transport, offshore applications, and process industries. The segment faces more competition in standardized products than premium high-voltage power cable categories. Suppliers operating in both areas need to balance high-volume industrial sales with capacity for specialized infrastructure work.

By Voltage Type:
Low-Voltage Scale Meets High-Voltage Value CreationLow-voltage cables held 62.9% of the power and control cable market size in 2026 and are projected to expand at a 9.5% CAGR through 2032. Housing construction, urban electrification, data-center distribution, and Electric Vehicle (EV) Charging support widespread demand for these products. The segment benefits from many smaller projects rather than a limited number of large transmission contracts. India’s cable demand has been supported by construction, last-mile grid programs, and network expansion. This broad demand base gives established distribution networks an important role in power and control cable market. Price competition is stronger than in the most specialized high-voltage categories.
Medium-voltage cables connect distribution substations, industrial users, and renewable energy parks. Their demand follows industrial investment and grid modernization schedules. High-voltage and extra-high-voltage cables occupy the highest value-density positions in the portfolio because a single project can require very large cable contracts. Long-term procurement frameworks show that major buyers often reserve qualified capacity well before construction starts. Qualification requirements remain a practical barrier for new entrants at the highest voltage range. This difference in qualification and project scale separates high-voltage value creation from lower-voltage volume demand.
By Installation Type:
Underground Leads Volume, Submarine Drives ValueUnderground cables held 49.5% of revenue in 2026. Reliability needs; urban density, visual requirements, and protected corridors support their use. Germany’s SuedLink and SuedOstLink are examples of long-distance underground high-voltage direct-current development. The German regulator approved the final SuedOstLink section in July 2025. Underground systems can be preferred where overhead construction faces environmental, planning, or community constraints. They also require detailed routing, civil work, and careful installation coordination.
Submarine cables are projected to grow at an 11.2% CAGR through 2032, the fastest rate among installation types. Offshore wind, island connections, and cross-border power links are the main demand sources. These projects need specialized vessels, marine surveys, and strict cable-handling procedures. The value of a subsea route can be much higher than that of a comparable overhead line because of technical and installation requirements. The Institution of Engineering and Technology noted in 2025 that offshore high-voltage direct-current links can carry much higher costs than comparable overhead connections. Manufacturers that control both cable production and installation capability can reduce a critical delivery risk.
By End-Use Industry:
Energy and Utilities Lead, Renewable Energy Outpaces AllEnergy and utilities held 29.6% of revenue in 2026. Transmission, distribution, and substation programs create steady demand across regions. Renewable energy is forecast to grow at a 9.2% CAGR through 2032, the fastest rate among end-use categories. Renewable facilities require cables within the asset and for the grid connection, linking renewable demand closely with utility investment. Industrial manufacturing, construction, and infrastructure remain important secondary demand centers. The power and control cable industry also serves transport systems and other essential infrastructure that need reliable power and control connections.
Oil and gas applications continue to require specialized power and control systems, despite the wider shift in energy investment. The Abu Dhabi National Oil Company (ADNOC) Lightning Project uses high-voltage direct-current submarine links to supply offshore facilities from the mainland grid. Railways and transportation systems need power, signaling, and control cables for upgrades and replacement work. Mining and metals sites require armored and fire-resistant products for demanding operating conditions. These niches can support premium products where safety and certification requirements are stringent. End-user demand is therefore diverse, even though utility investment remains the largest single source of revenue.
Geography Analysis
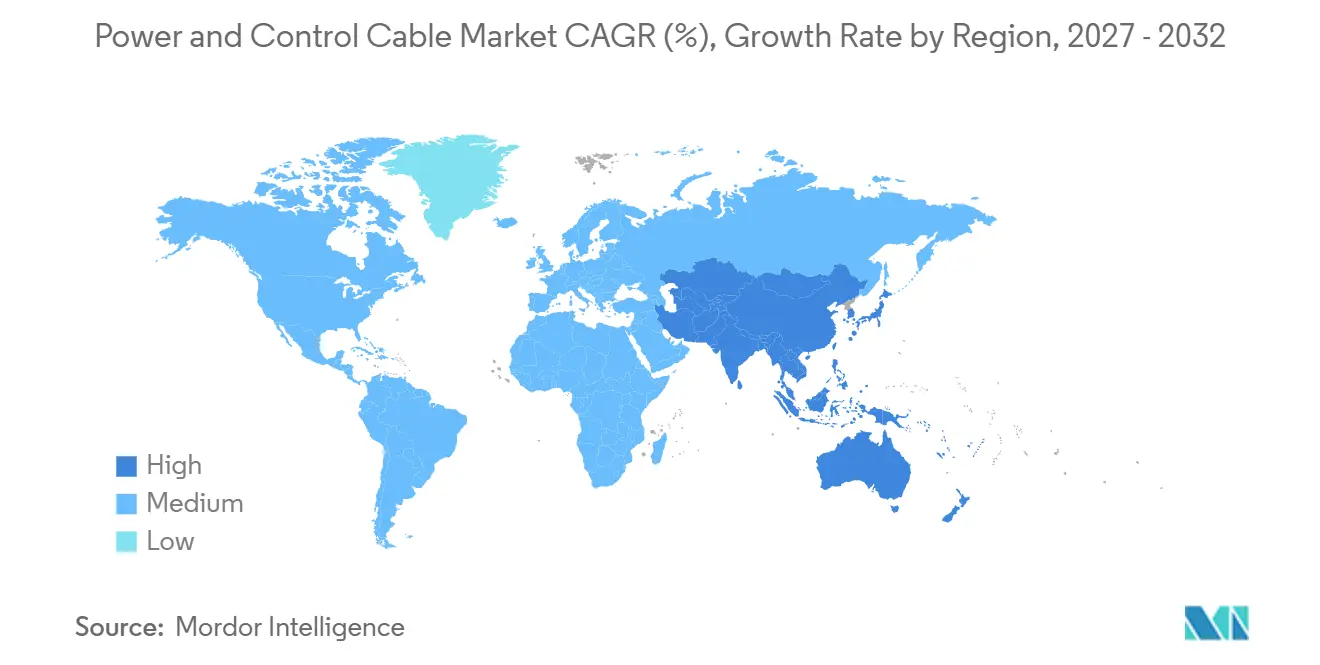
Asia-Pacific held 48.7% of the power and control cable market size in 2026 and is projected to grow at a 9.3% CAGR through 2032. China supports this position through its large transmission network and extensive cable production base. China’s 220 kV and above transmission network reached 960,000 km by 2024. It also cited the 2024 power cable output of USD 80.52 billion (CNY 538.1 billion) from the China Electrical Equipment Industry Association. India adds demand through grid upgrades, transit expansion, electrification, and charging infrastructure. Southeast Asian countries are creating further demand through industrialization and rural electrification programs.
India’s current demand outlook is tied to grid modernization, construction activity, and manufacturing investment. Local producers are also targeting export opportunities as capacity expands. The regional mix includes high-value transmission projects in China and India alongside broad construction and electrification demand across Southeast Asia. This combination supports both specialized and standard cable categories. Asia-Pacific remains central to the power and control cable market because it combines scale, manufacturing depth, and varied end-user demand.
Europe and North America together account for a large share of planned grid investment, supported by transmission upgrades, offshore wind connections, and new electricity demand. German high-voltage direct-current corridors and France’s planned network investment support demand for underground and submarine systems. The United States is also expanding transmission and distribution equipment needs, while data-center development adds distributed cable demand. Smaller demand centers in South America, the Middle East, and Africa have distinct drivers. The World Bank approved USD 698.13 million (EUR 625 million) for Türkiye’s renewable energy transmission project in 2025, including high-voltage substations, underground cable expansion, and initial high-voltage direct-current corridors. The Middle East has specialized offshore and industrial programs, while Africa’s electrification needs support demand for lower-voltage products.
Competitive Landscape
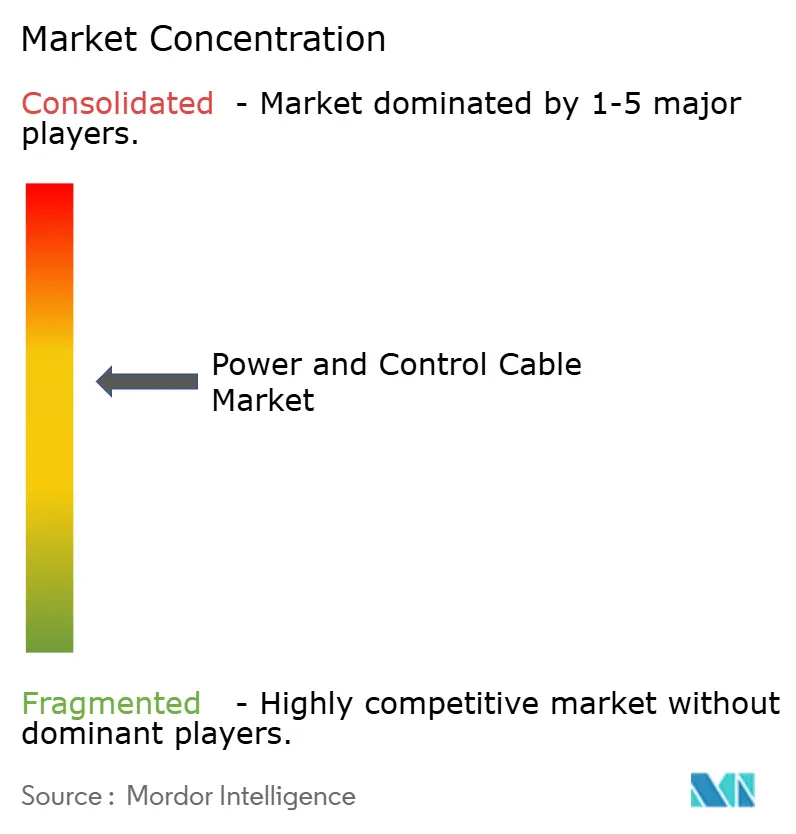
The power and control cable market is moderately concentrated in premium offshore and high-voltage direct-current applications, while lower-voltage segments are more fragmented. Prysmian, Nexans, and NKT have large order backlogs and established manufacturing capacity for complex projects. NKT reported a high-voltage order backlog of USD 11.26 billion (EUR 10.1 billion) in the second quarter of 2025. Nexans reported a PWR-Transmission backlog of USD 8.83 billion (EUR 7.9 billion) in September 2025. Certification and manufacturing qualification requirements limit competition in the highest-voltage segment. Major utility buyers are also using several qualified suppliers to reduce reliance on a single manufacturing source.
Prysmian acquired ACSM in January 2026, adding subsea surveying, route-planning, and seabed-preparation capability. The transaction addresses installation execution risk in offshore cable projects. Prysmian also completed its acquisition of Atkore in October 2026 for USD 3.8 billion, extending its electrical infrastructure offering in the United States. Nexans completed the acquisition of Republic Wire in June 2026, strengthening its North American copper-wire position. Its earlier framework work with Réseau de Transport d’Électricité (RTE) shows the importance of long-term project relationships for high-voltage suppliers. These moves show that leading companies are adding capacity, channel reach, and installation support rather than relying only on organic cable production growth.
Competition is more intense in lower-voltage construction and industrial products, where regional producers and new entrants can compete more readily. New cable investments by UltraTech Cement and Adani Group in India during 2025, which raised competitive pressure on established domestic suppliers. Existing producers responded through capacity plans and export strategies. Aluminum conductor development could become an area of product innovation where technical specifications allow material substitution. Hybrid power, data, and control assemblies may also support differentiated offerings in industrial applications.
Power and Control Cable Industry Leaders
-
Prysmian S.p.A.
-
Nexans S.A.
-
Sumitomo Electric Industries, Ltd.
-
LS Cable & System Ltd.
-
NKT A/S
- *Disclaimer: Major Players sorted in no particular order
Power and Control Cable Market Companies Covered in this Report
- Belden Inc.
- Ducab Group
- Elsewedy Electric Company
- Finolex Cables Limited
- Fujikura Ltd.
- Furukawa Electric Co., Ltd.
- Havells India Limited
- HELUKABEL GmbH
- Hengtong Group Co., Ltd.
- KEI Industries Limited
- Leoni AG
- LS Cable & System Ltd.
- Nexans S.A.
- NKT A/S
- Polycab India Limited
- Prysmian S.p.A.
- Riyadh Cables Group Company
- RR Kabel Limited
- Southwire Company, LLC
- Sumitomo Electric Industries, Ltd.
Recent Industry Developments in Power and Control Cable Market
- October 2026: Prysmian completed the acquisition of Atkore, a US-based provider of electrical infrastructure solutions encompassing conduits, cable management systems, and metal framing, for USD 3.8 billion at USD 95 per share. The combined entity operates more than 60 US manufacturing and distribution sites, significantly strengthening Prysmian's position in data center, utilities, and commercial infrastructure channels.
- October 2026: Prysmian completed the acquisition of Xtera, a UK-and-US specialist in turnkey submarine telecom cable systems, through an 80/20 joint venture with Fincantieri. Xtera was simultaneously selected by EXA Infrastructure for the 6,552 km EXA Meridian transatlantic cable project, and cables will be manufactured at Prysmian's Nordenham, Germany facility, where production capacity is being doubled.
- June 2026: Nexans closed the acquisition of Republic Wire, a US copper wire manufacturer, strengthening the group’s PWR-Connect segment in North America. The company also confirmed full-year 2026 guidance and reported 9M 2026 electrification businesses up 12.9% year-on-year organically.
- January 2026: Prysmian announced the acquisition of ACSM, a Spain-based leader in submarine cable surveying, route planning, and seabed preparation, for USD 189 million (EUR 169 million). Integrating ACSM brings in-house the installation capabilities that represent a primary execution risk in large-scale offshore cable projects.
Global Power and Control Cable Market Report Scope
A power and control cable is a combined or distinct electrical assembly in which power cables transmit high-voltage and high-current electrical energy from a source to equipment, while control cables transmit low-voltage automation, measurement, and command signals to regulate and monitor that equipment.
The global power and control cable market is segmented by product type, voltage type, installation type, end-use industry, and geography. By product type, the market is segmented into power cables and control cables. By voltage type, the market is segmented into low-voltage, medium-voltage, high-voltage, and extra-high-voltage cables. By installation type, the market is segmented into overhead, underground, and submarine cables. By end-use industry, the market is segmented into energy and utilities, industrial manufacturing, oil and gas, construction and infrastructure, transportation and railways, mining and metals, renewable energy, and other end-use industries. The report also covers the market size and forecasts for the global power and control cable market across 28 countries in key regions. For each segment, the market sizing and forecasts have been provided on the basis of value (USD).
Segmentation Overview
| Power Cables |
| Control Cables |
| Low-Voltage Cables |
| Medium-Voltage Cables |
| High-Voltage Cables |
| Extra-High-Voltage Cables |
| Overhead |
| Underground |
| Submarine |
| Energy and Utilities |
| Industrial Manufacturing |
| Oil and Gas |
| Construction and Infrastructure |
| Transportation and Railways |
| Mining and Metals |
| Renewable Energy |
| Other End-Use Industries |
| North America | United States |
| Canada | |
| Mexico | |
| Europe | Germany |
| France | |
| Italy | |
| Spain | |
| United Kingdom | |
| Poland | |
| Netherlands | |
| Russia | |
| Rest of Europe | |
| Asia-Pacific | China |
| India | |
| Japan | |
| South Korea | |
| Australia | |
| Indonesia | |
| Malaysia | |
| Thailand | |
| Philippines | |
| Rest of Asia-Pacific | |
| South America | Brazil |
| Argentina | |
| Colombia | |
| Rest of South America | |
| Middle East and Africa | Saudi Arabia |
| United Arab Emirates | |
| South Africa | |
| Egypt | |
| Nigeria | |
| Rest of Middle East and Africa |
| By Product Type | Power Cables | |
| Control Cables | ||
| By Voltage Type | Low-Voltage Cables | |
| Medium-Voltage Cables | ||
| High-Voltage Cables | ||
| Extra-High-Voltage Cables | ||
| By Installation Type | Overhead | |
| Underground | ||
| Submarine | ||
| By End-Use Industry | Energy and Utilities | |
| Industrial Manufacturing | ||
| Oil and Gas | ||
| Construction and Infrastructure | ||
| Transportation and Railways | ||
| Mining and Metals | ||
| Renewable Energy | ||
| Other End-Use Industries | ||
| By Geography | North America | United States |
| Canada | ||
| Mexico | ||
| Europe | Germany | |
| France | ||
| Italy | ||
| Spain | ||
| United Kingdom | ||
| Poland | ||
| Netherlands | ||
| Russia | ||
| Rest of Europe | ||
| Asia-Pacific | China | |
| India | ||
| Japan | ||
| South Korea | ||
| Australia | ||
| Indonesia | ||
| Malaysia | ||
| Thailand | ||
| Philippines | ||
| Rest of Asia-Pacific | ||
| South America | Brazil | |
| Argentina | ||
| Colombia | ||
| Rest of South America | ||
| Middle East and Africa | Saudi Arabia | |
| United Arab Emirates | ||
| South Africa | ||
| Egypt | ||
| Nigeria | ||
| Rest of Middle East and Africa | ||
Key Questions Answered in the Report
What is the projected value of the power and control cable market by 2032?
The power and control cable market is forecast to reach USD 313.23 billion by 2032, growing at a 6.78% CAGR from 2027 to 2032.
Which product category holds the largest share?
Power cables hold the largest share at 90.1% in 2026 and are projected to grow at an 8.3% CAGR through 2032.
Which cable installation type is growing fastest?
Submarine cables are the fastest-growing installation type, with a projected CAGR of 11.2% through 2032.
Why are high-voltage direct-current cables important to grid expansion?
They support long-distance transmission, offshore wind connections, and interconnectors, but projects face long manufacturing lead times and vessel constraints.
Which region leads demand for power and control cables?
Asia-Pacific leads with 48.7% share in 2026 and is projected to grow at a 9.3% CAGR through 2032.
Which end-use segment is expanding fastest?
Renewable energy is the fastest-growing end-use segment, with a projected CAGR of 9.2% through 2032.