
Post-Consumer Recycled Plastics Market Size and Share
Market Overview
| Study Period | 2022 - 2032 |
|---|---|
| Market Size (2027) | USD 18.54 Billion |
| Market Size (2032) | USD 29.22 Billion |
| Growth Rate (2027 - 2032) | 9.53 % |
| Fastest Growing Market | Asia-Pacific |
| Largest Market | Asia-Pacific |
| Market Concentration | Medium |
Major Players *Disclaimer: Major Players sorted in no particular order Image © Mordor Intelligence. Reuse requires attribution under CC BY 4.0. | |
Post-Consumer Recycled Plastics Market Analysis by Mordor Intelligence
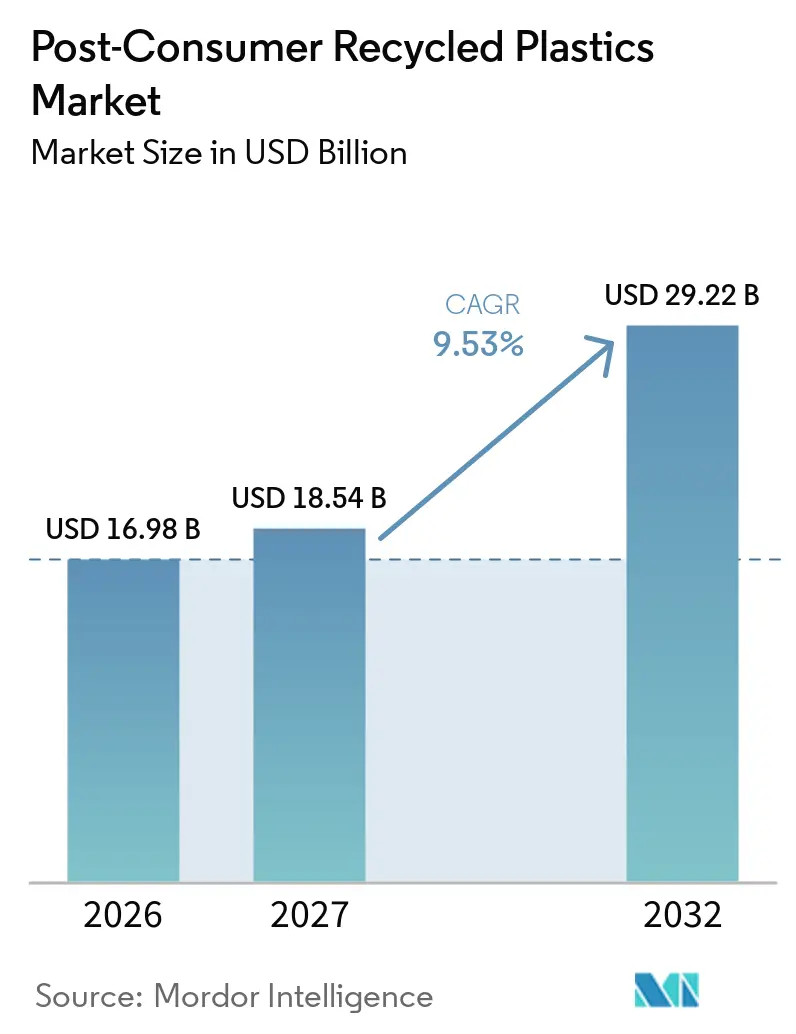
The post-consumer recycled plastics market size was valued at USD 16.98 billion in 2026 and is estimated to grow from USD 18.54 billion in 2027 to USD 29.22 billion by 2032, at a CAGR of 9.53% during the forecast period (2027-2032). Packaging remains the primary demand base for post-consumer recycled plastics, as recycled-content regulations apply directly to beverage containers, rigid packs, and flexible films. These regulatory requirements are shifting procurement from a voluntary environmental target to a compliance obligation for many buyers. As a result, verified material quality, collection capacity, and traceable supply have become more important competitive factors. Asia-Pacific combines large processing capacity with growing formal recycled-content requirements, while North America and Europe rely more heavily on regulatory implementation to drive demand. The post-consumer recycled plastics market faces strong demand signals, but progress depends on reliable feedstock availability and workable price relationships with virgin resin.
Key Report Takeaways
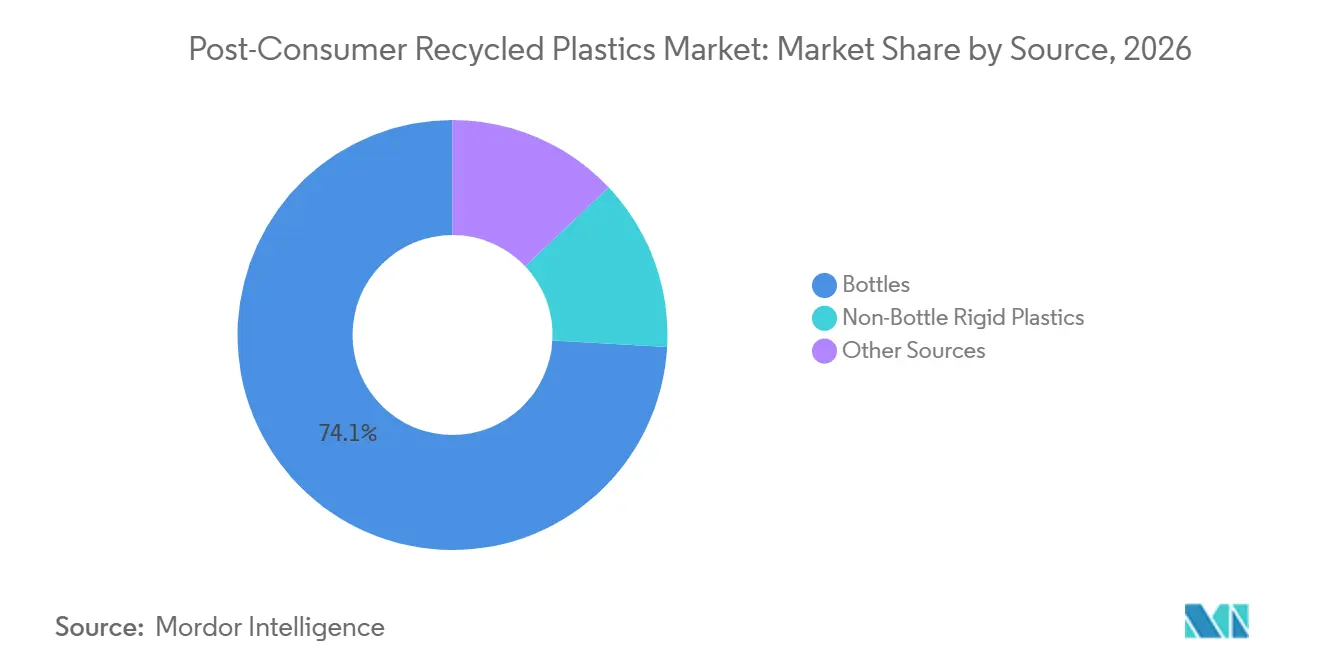
- By source, bottles held 74.12% of the post-consumer recycled plastics market share in 2026, while bottles are forecast to grow at a CAGR of 10.32% through 2032.
- By polymer type, polyethylene terephthalate (PET) held 35.71% of the post-consumer recycled plastics market share in 2026, while polystyrene is forecast to grow at a CAGR of 10.56% through 2032.
- By processing type, mechanical recycling held 70.67% of the post-consumer recycled plastics market share in 2026, while chemical recycling is forecast to grow at a CAGR of 10.71% through 2032.
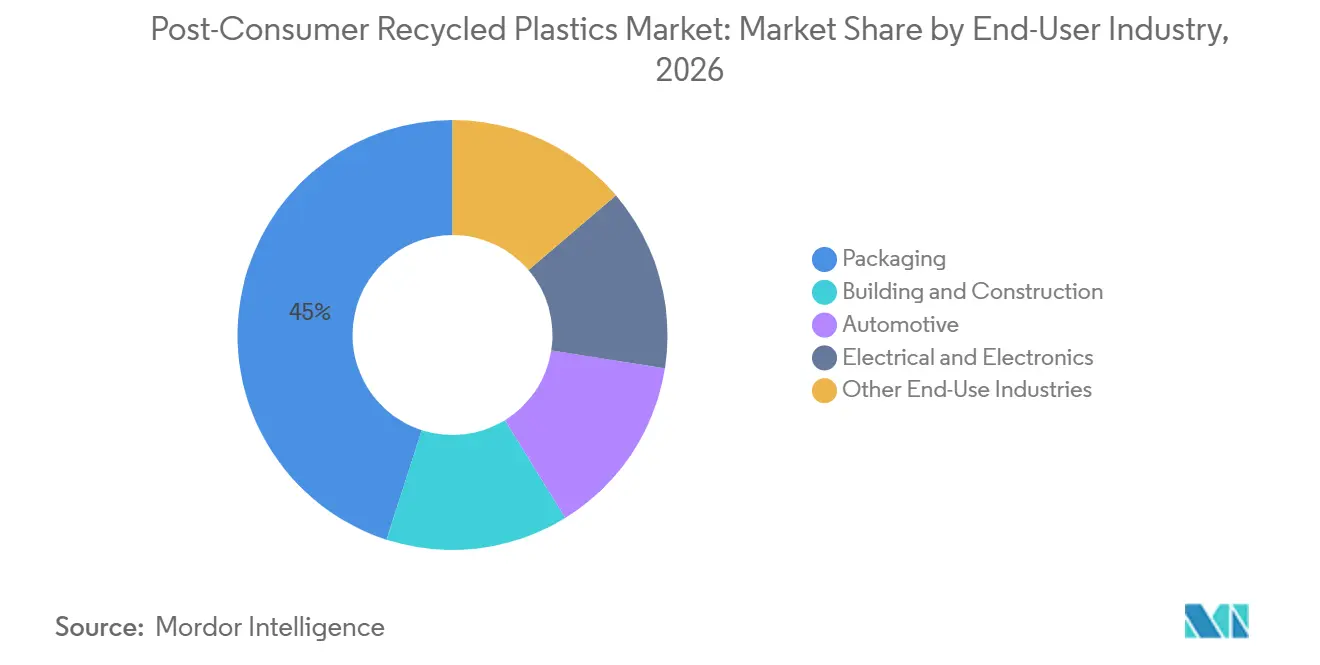
- By end-user industry, packaging accounted for 45.04% of the post-consumer recycled plastics market share in 2026, and is forecast to grow at a CAGR of 11.69% through 2032.
- By geography, Asia-Pacific held 40.26% of the post-consumer recycled plastics market share in 2026 and is forecast to grow at a CAGR of 11.14% through 2032.
Note: Market numbers in this report are based on Mordor Intelligence's proprietary estimation framework, which combines nine months of actuals with Q4 projections for base year 2026.
Market Trends and Insights
Drivers Impact Analysis of Post-Consumer Recycled Plastics Market*
| Drivers | (~) % Impact on CAGR Forecast | Geographic Relevance | Impact Timeline |
|---|---|---|---|
| Recycled-Content Mandates and Extended Producer Responsibility (EPR)-Linked Demand | +2.5% | Global, concentrated in North America and EU | Medium term (2-4 years) |
| Brand-Owner Procurement Commitments for Circular Packaging | +2.0% | Global | Short term (≤ 2 years) |
| Advances in Sorting, Washing, and Food-Grade Reprocessing | +1.5% | Global, with early gains in the EU and APAC | Long term (≥ 4 years) |
| Expansion of Applications and Traceable Domestic Feedstock | +2.0% | Global, with relevance in North America, the EU, and East Asia | Medium term (2-4 years) |
| Domestic Supply Security and Traceable Circular Feedstock | +0.8% | North America, EU, East Asia | Long term (≥ 4 years) |
| Source: Mordor Intelligence | |||
Recycled-Content Mandates and Extended Producer Responsibility (EPR)-Linked Demand
Regulation provides the most dependable demand signal for the post-consumer recycled plastics market. Regulation (EU) 2025/40 began to apply from August 2026 and requires a minimum recycled content in plastic packaging from 2030. PET contact-sensitive packaging must contain 30% post-consumer recycled content from 2030, with higher requirements planned for later years. Washington requires 25% post-consumer recycled content in covered plastic beverage containers under its statutory framework. The Association of Plastic Recyclers also records recycled-content requirements across several U.S. states, including requirements affecting beverage, cleaning, and personal care packaging. These layered requirements make material purchasing an operational necessity rather than a discretionary sustainability action. The rules can also narrow the usable supply pool because jurisdictions do not always accept the same methods for proving recycled content. Washington permits mass-balance attribution in relevant circumstances, while other approaches may require physically segregated content. This difference can tighten the supply of material eligible for compliance, even when overall recycling capacity is available.
Brand-Owner Procurement Commitments for Circular Packaging
Brand-owner purchasing commitments support demand beyond formal regulation in the post-consumer recycled plastics market. Signatories to the Ellen MacArthur Foundation Global Commitment raised recycled content in plastic packaging from 14% in 2023 to 16% in 2024. The reported share was 5% in 2018, showing a sustained shift away from virgin material among participating companies. Recycler signatories produced nearly 2 million metric tons of recycled content in 2024, up 6% from 2023. L'Oréal reached 37% recycled content in 2024 against its 50% target, supporting demand for high-purity PET and HDPE streams. Consistent purchasing programs can give recyclers more confidence to invest in capacity. Church & Dwight reported that constrained supply and higher costs can still leave purchasers below internal recycled-content goals[1]. Procurement commitments are important, but they cannot replace improvements in feedstock availability and processing yields.
Advances in Sorting, Washing, and Food-Grade Reprocessing
Improvements in sorting, washing, and reprocessing are increasing the number of post-consumer streams that meet demanding end-use requirements. India approved food-grade recycled PET in 2025, opening a regulated path for beverage and dairy applications. Mechanically recycled polystyrene also entered commercial food-packaging applications in Japan and Europe during early 2025. A 2025 Nature Chemical Engineering study reported monomer yields of 78% to 98% from mixed polyester waste via catalytic methanolysis. The study reported that recycled PET exhibited tensile strength and thermal performance comparable to those of commercial virgin PET. It also estimated a minimum selling price of USD 2.37 per kilogram, 36% below virgin material costs, and 41% lower greenhouse gas emissions. A separate Nature Chemical Engineering review noted that solvent-based processes can produce high-quality resins from diverse waste without breaking polymer chains. These technologies can improve quality for applications that require tight material specifications.
Expansion of Applications and Traceable Domestic Feedstock
The post-consumer recycled plastics market is expanding beyond its historical dependence on packaging. The World Economic Forum estimated that automotive applications account for 12% to 15% of global plastic demand. Electric vehicle adoption can increase demand for plastics and fiber-reinforced composites that reduce vehicle weight. Germany's construction sector consumed 686,000 tons of post-consumer recyclates, compared with 472,000 tons in the packaging sector, according to BKV-GmbH. The same study reported 22% recycled content in construction applications. Laing O'Rourke used noise walls with 75% recycled content on an Australian project, diverting 104 tons of plastic waste from landfill. Broader use across packaging, automotive, and construction spreads demand across more end markets. Traceable local supply also becomes more valuable when buyers require dependable compliance-grade materials.
Restraints Impact Analysis of Post-Consumer Recycled Plastics Market*
| Restraints | (~) % Impact on CAGR Forecast | Geographic Relevance | Impact Timeline |
|---|---|---|---|
| Contamination and Polymer-Mix Variability in Municipal Streams | -1.2% | Global | Short term (≤ 2 years) |
| Price Competition for Low-Cost Virgin Resin and Imported Post-Consumer Recycled (PCR) | -1.5% | North America and the EU | Short term (≤ 2 years) |
| Uncertain mass-balance acceptance and chain-of-custody rules | -0.8% | EU, North America | Medium term (2-4 years) |
| Source: Mordor Intelligence | |||
Contamination and Polymer-Mix Variability in Municipal Streams
Inconsistent feedstock quality remains a major operating constraint in the post-consumer recycled plastics market. Municipal collection streams often combine PET, HDPE, PP, PVC, and multilayer materials. Recyclers must separate and clean these materials before processing, which increases costs and reduces usable yields. This problem is especially acute for polystyrene, as collection systems vary widely across regions. Chemical recycling facilities may therefore rely on industrial plastic waste rather than a consistent post-consumer supply. A 2025 Royal Society of Chemistry (RSC) Sustainability review found that real-world plastic waste streams are complex mixtures that mechanical infrastructure cannot adequately or economically process. This constraint is structural rather than a result of low investment. The EU Packaging and Packaging Waste Regulation (PPWR) will require published recyclability performance grades from 2030 and evidence of large-scale sorting and recycling from 2035. These requirements increase the value of packaging designs that produce cleaner feedstock.
Price Competition for Low-Cost Virgin Resin and Imported Post-Consumer Recycled (PCR)
Low-cost virgin resin can weaken demand and margins in the post-consumer recycled plastics market. European recyclers also face competition from lower-cost imported recycled polymers. Biffa reported that low virgin polymer prices reduced demand for domestically recycled material and contributed to the closure of the Washington Polymers site and the Wigan material recovery facility[2]. Price pressure can discourage investment when recyclers cannot secure dependable offtake agreements. This issue is particularly difficult for operators who added capacity before regulations created enforceable demand. The speed of policy enforcement can therefore matter as much as stated recycling targets. Buyers may use spot purchasing when price differentials widen, which weakens the stability of long-term supply arrangements. The combination of volatile input costs and uncertain selling prices keeps smaller operators exposed to financial pressure.
*Our forecasts treat driver/restraint impacts as directional, not additive. The impact forecasts reflect baseline growth, mix effects, and variable interactions.
Post-Consumer Recycled Plastics Market Segment Analysis
By Source:
Bottles Anchor Supply, Non-Bottle Rigid Plastics Catching UpBottles accounted for 74.12% of the post-consumer recycled plastics market share in 2026 and are projected to grow at a 10.32% CAGR through 2032. This position reflects mature bottle collection systems and the relative value of homogeneous feedstock. Bottle-grade polyethylene terephthalate (PET) and high-density polyethylene (HDPE) typically have lower contamination levels than mixed municipal material. Processors can therefore achieve food-contact output with fewer washing and sorting stages. This cost advantage can protect margins when virgin resin prices shift sharply. Deposit return systems in Germany, Norway, and several U.S. states provide concentrated, predictable pools of bottle feedstock. Return rates in these systems exceed 90%, supporting recycling capacity that can be financed against known supply. The post-consumer recycled plastics market size linked to bottles benefits from established collection, sorting, and processing infrastructure. These conditions make bottles a dependable input stream for high-quality recyclate production.
Non-bottle rigid plastics include clamshells, tubs, and caps. These materials are the biggest opportunity for incremental growth in the source landscape. Near-infrared sorting and AI-enabled identification are improving the ability to separate these items from complex waste streams. Better identification can reduce the cost of recovering materials that were previously underprocessed. Films, agricultural plastics, and rigid industrial containers remain less mature sources for recycled output at scale. They continue to attract investment from chemical recyclers and petrochemical companies seeking feedstock for new solvent-based and pyrolysis plants. Extended producer responsibility programs can increase the collection of these materials where the eligible waste stream is broadened. Technology improvements can then convert a larger share of collected plastics into usable feedstock. The source mix is likely to diversify as collection rules and sorting capability improve.

By Polymer Type:
PET Leads, Polystyrene Advances Through Chemical RoutesPET held 35.71% of the post-consumer recycled plastics market share in 2026. Its position rests on extensive bottle collection and established bottle-to-bottle recycling systems. Indorama Ventures recycled 26.4 billion PET bottles during 2024 across more than 20 facilities in 11 countries. On August 5, 2025, the company reached 150 billion recycled post-consumer PET bottles since 2011. PET has clear end markets in beverage packaging and other food-contact applications. Its collection infrastructure gives processors access to better-understood feedstock quality. The established base also supports compliance with recycled-content requirements in packaging. PET retains its position because material recovery systems and end-use demand have developed together.
HDPE is the second-largest polymer stream and remains important to brand owners pursuing recycled-content commitments. Demand for recycled natural HDPE is strong, particularly where purchasers seek consistent packaging-grade material. Polystyrene is the fastest-growing polymer type, with a projected CAGR of 10.56% from 2027 to 2032. Chemical recycling provides routes to convert polystyrene back into food-grade styrene monomer. Denka's Agilyx-licensed pyrolysis facility in Chiba, Japan, and European depolymerization projects illustrate this direction. PP, LDPE, PVC, and PUR are used in construction, automotive, and electrical applications. Their lower collection rates and greater exposure to mixed waste streams continue to limit the quality and output of their recyclate. The post-consumer recycled plastics industry requires better collection and separation systems to unlock more value from these polymer types.
By Processing Type:
Mechanical Recycling Remains Dominant, Chemical Recycling Broadens OptionsMechanical recycling accounted for 70.67% of the post-consumer recycled plastics market share in 2026. It has a large installed base of washing lines, extruders, and pelletizing equipment. This route also has lower capital requirements than many chemical processes. Mechanical recycling is well-suited to clean, well-sorted PET and HDPE streams. It remains the primary processing route, with collection systems providing a consistent supply of material. Its operational experience makes it a key player in meeting near-term recycled-content requirements. The post-consumer recycled plastics market size associated with mechanical recycling is supported by established infrastructure and lower capital intensity. Its primary limitation is the difficulty of handling mixed, contaminated, or multilayer waste. This limitation results in a large share of the collected plastic being outside high-value mechanical recycling applications.
Chemical recycling is projected to expand at a CAGR of 10.71% from 2027 to 2032. It can process some material streams that are unsuitable for mechanical recycling. A facility in Jieyang, Guangdong, began trial production in 2025 with the capacity to process more than 200,000 tons of unsorted mixed plastics each year. The facility reported a product yield above 92%. Chemical routes can create chemical feedstocks from low-value plastic waste, but verification rules for recycled-content claims remain inconsistent. Biological recycling remains in its early stages, although investment in intellectual property is increasing. Carbios and Indorama Ventures are developing a manufacturing plant in France for fully bio-recycled PET. The project represents industrial-scale enzyme-based recycling for a post-consumer stream. Chemical and biological methods are expected to complement mechanical recycling rather than displace it in the near term.
By End-User Industry:
Packaging Leads by Quantity, Automotive Leads by ValuePackaging accounted for 45.04% of the post-consumer recycled plastics market size in 2026 and is projected to expand at a CAGR of 11.69% through 2032. Packaging uses large quantities of material and faces targeted recycled-content requirements. The EU Packaging and Packaging Waste Regulation (PPWR) requires 30% recycled content in contact-sensitive plastic packaging from 2030. This requirement creates a defined demand base for food-contact recycled material. Packaging converters need stable quality and verified content to meet these obligations. This supports investment in bottle-to-bottle PET and other high-purity recycling systems. Packaging demand is also closely tied to the availability of collection systems that supply clean feedstock. Its position reflects both its scale and its direct exposure to regulation.
Automotive is a growing secondary application for recycled plastics. The revised EU End-of-Life Vehicles Directive requires 95% recoverability, thereby supporting circular material use. Covestro has worked with NIO and Volkswagen on a car-to-car plastic recycling supply chain in China. China has 6 million to 7 million vehicles reaching the end of life each year. Construction already represented 22.7% recycled content in Europe, compared with 4.6% in automotive applications. Electrical and electronic uses are fewer in number but can support premium grades of recycled Acrylonitrile Butadiene Styrene (ABS) and polypropylene (PP). MBA Polymers UK received Carbon Trust Lower CO₂ certification for recycled ABS, with an 86% lower carbon footprint than the virgin equivalent. These applications reduce reliance on a single end market and increase the value placed on consistent material performance.
Geography Analysis
APAC Post-Consumer Recycled Plastics Market
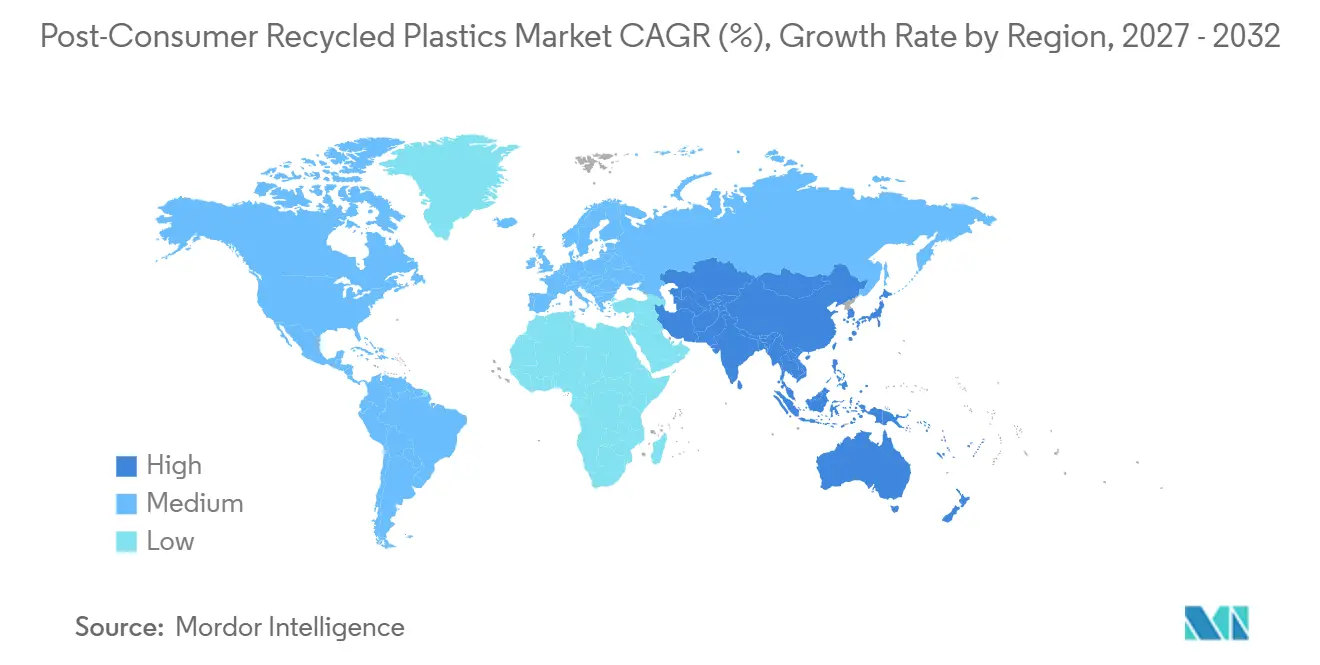
Asia-Pacific held 40.26% of the post-consumer recycled plastics market share in 2026 and is projected to record a CAGR of 11.14% through 2032. China is expanding its mechanical and chemical recycling capacity. India is formalizing extended producer responsibility requirements for recycled PET in food-grade rigid packaging. Japan and South Korea contribute mature industrial systems to the region's supply base. The OECD expects Japan's recycling rate to increase from 14% in 2022 to 26% in 2050, and South Korea's rate to rise from 10% to 22% during the same period.
China and India Post-Consumer Recycled Plastics Market
China's supply scale gives the region a strong position in the post-consumer recycled plastics market. However, the oversupply of virgin PET in China is a near-term pressure on recycled PET purchasing, demonstrating that large capacity does not eliminate exposure to feedstock economics. India's food-grade rPET approval supports new demand from beverage and dairy applications. Japan's and South Korea's established systems provide useful foundations for higher-quality recycling output. Regional growth depends on maintaining adequate waste collection as new processing capacity comes online, and on whether converters can absorb recycled material when virgin resin prices are low.
The Americas and EMEA Post-Consumer Recycled Plastics Market
North America and Europe remain central to regulatory-led demand. The EU PPWR began applying in August 2026, and its recycled-content rules will take effect in 2030. Europe faces higher energy costs, lower-cost imports, and reduced recycling capacity. South America is developing more defined EPR legislation, though unclear import rules continue to affect recyclers and importers. Brazil shows a growing reliance on imported PET flakes to meet downstream requirements. The Middle East and Africa remain earlier-stage markets, led by Saudi Arabia and South Africa. Their role may expand as Gulf Cooperation Council countries implement circular economy programs linked to Vision 2030 goals.
Competitive Landscape
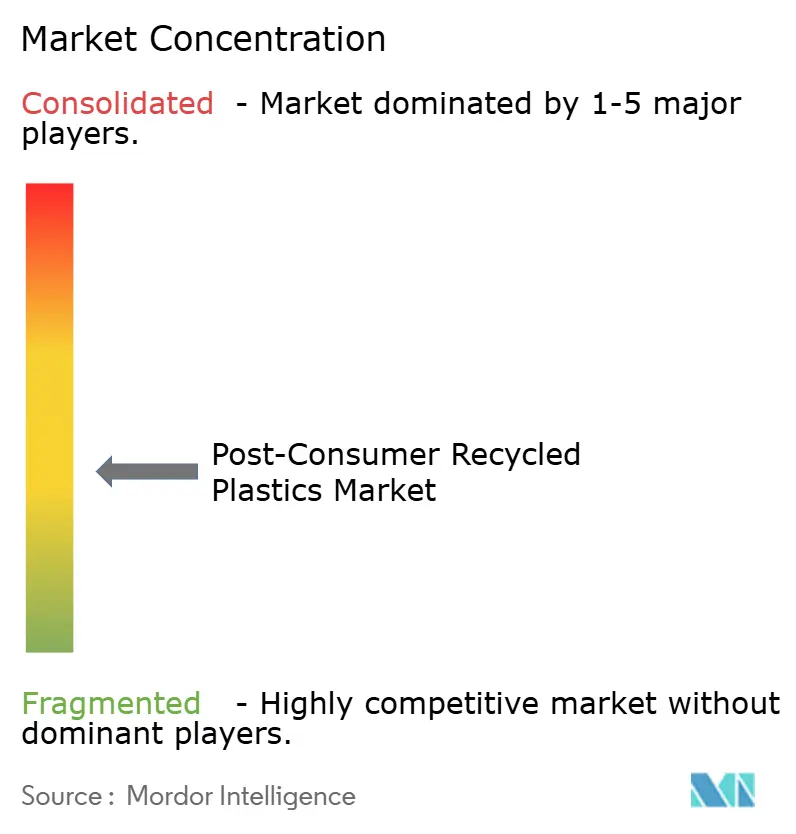
The post-consumer recycled plastics market is moderately fragmented. Veolia, SUEZ, and REMONDIS SE compete with specialist recyclers such as Indorama Ventures, Plastipak Holdings, and MBA Polymers. The largest operators seek control across collection, sorting, washing, pelletizing, and compounding. Vertical integration can reduce exposure to spot purchasing and preserve more value across the material chain. It can also help operators meet buyers' requirements for traceable, consistent recyclate. Indorama Ventures operates more than 20 recycling facilities in 11 countries, with a committed capacity of 1.5 million tons of recycled PET by 2030. The company raised USD 2.7 billion in sustainability financing between 2018 and 2024.
Chemical recycling offers a strategic opportunity for companies to address mixed plastic waste. OMV uses ReOil technology, while Carbios and Agilyx are developing routes that complement conventional mechanical processing. Compliance credentials are also becoming more important. ISCC PLUS sets chain-of-custody requirements for certified material flows, and ISO 22095:2020 provides a framework for mass-balance chain-of-custody accounting. Companies with documented certification and tracking systems can better support compliance claims where jurisdictions accept these methods. This capability may differentiate certified operators from recyclers that cannot provide equivalent documentation. Competitive advantage increasingly depends on quality assurance, traceability, and the ability to secure feedstock.
Consolidation is increasing among mid-sized operators. MBA Polymers completed its merger with energenta AG in 2025, creating a combined platform spanning collection, sorting, material recovery, and advanced compounding. Veolia reported its 2025 operating and financial performance in February 2026, reflecting the continued role of integrated environmental services groups in the value chain. Indorama's global facility network provides another example of scale built around PET collection and reprocessing. These developments raise the capital and operating requirements for smaller recyclers, though smaller companies can still compete through specialized collection, advanced sorting, or chemical recycling technologies.
Post-Consumer Recycled Plastics Industry Leaders
-
Indorama Ventures Public Company Limited
-
Veolia
-
SUEZ
-
Amcor plc
-
Plastipak Holdings, Inc.
- *Disclaimer: Major Players sorted in no particular order
Post-Consumer Recycled Plastics Market Companies Covered in this Report
- Amcor plc
- Biffa
- CarbonLITE Industries LLC
- Clear Path Recycling LLC
- Custom Polymers, Inc.
- Envision Plastics
- Indorama Ventures Public Company Limited
- KW Plastics
- MBA Polymers Inc.
- Plastipak Holdings, Inc.
- REMONDIS SE & Co. KG
- Republic Services, Inc.
- SUEZ
- Veolia
- Waste Connections
- WM Intellectual Property Holdings, L.L.C.
Recent Industry Developments in Post-Consumer Recycled Plastics Market
- October 2026: Plastipak Holdings invested USD 28 million to open a new PET Material Center in Verbania, Italy. The investment expands the company's European closed-loop PET recycling and reprocessing capacity ahead of approaching EU Packaging and Packaging Waste Regulation (PPWR) recycled-content requirements.
- September 2025: Indorama Ventures inaugurated a new PET recycling plant in San Roque, Spain, backed by a EUR 16.7 million (~USD 18.74 million) investment. The regional government of Andalucía provided a EUR 3.45 million (~USD 3.87 million) incentive for energy-efficiency improvements in water treatment. The San Roque facility serves as the company's primary European hub for recycled PET (rPET) pellet production.
Global Post-Consumer Recycled Plastics Market Report Scope
Post-consumer recycled (PCR) plastics are materials derived from plastic items, such as water bottles, food containers, and packaging, that have been used by consumers, discarded, and processed through municipal recycling programs. These materials are collected from households and commercial establishments, sorted by resin type, cleaned to remove contaminants, and then reprocessed into raw material that manufacturers use to produce new plastic products.
The post-consumer recycled plastics market is segmented by source, polymer type, processing type, end-user industry, and geography. By source, the market is segmented into bottles, non-bottle rigid plastics, and other sources. By polymer type, the market is segmented into polyethylene terephthalate (PET), high-density polyethylene (HDPE), low-density polyethylene (LDPE), polypropylene (PP), polystyrene (PS), polyvinyl chloride (PVC), polyurethane (PUR), and other polymer types. By processing type, the market is segmented into mechanical recycling, chemical recycling, and biological recycling. By end-user industry, the market is segmented into packaging, building and construction, automotive, electrical and electronics, and other end-use industries. The report also covers market sizes and forecasts for the global post-consumer recycled plastics across 16 countries in major regions. The market sizes and forecasts are provided in terms of value (USD).
Segmentation Overview
| Bottles |
| Non-Bottle Rigid Plastics |
| Other Sources |
| Polyethylene Terephthalate (PET) |
| High-Density Polyethylene (HDPE) |
| Low-Density Polyethylene (LDPE) |
| Polypropylene (PP) |
| Polystyrene (PS) |
| Polyvinyl Chloride (PVC) |
| Polyurethane (PUR) |
| Other Polymer Types |
| Mechanical Recycling |
| Chemical Recycling |
| Biological Recycling |
| Packaging |
| Building and Construction |
| Automotive |
| Electrical and Electronics |
| Other End-Use Industries |
| Asia-Pacific | China |
| India | |
| Japan | |
| South Korea | |
| ASEAN Countries | |
| Rest of Asia-Pacific | |
| North America | United States |
| Canada | |
| Mexico | |
| Europe | Germany |
| United Kingdom | |
| France | |
| Italy | |
| NORDIC Countries | |
| Russia | |
| Rest of Europe | |
| South America | Brazil |
| Argentina | |
| Rest of South America | |
| Middle East and Africa | Saudi Arabia |
| South Africa | |
| Rest of Middle East and Africa |
| By Source | Bottles | |
| Non-Bottle Rigid Plastics | ||
| Other Sources | ||
| By Polymer Type | Polyethylene Terephthalate (PET) | |
| High-Density Polyethylene (HDPE) | ||
| Low-Density Polyethylene (LDPE) | ||
| Polypropylene (PP) | ||
| Polystyrene (PS) | ||
| Polyvinyl Chloride (PVC) | ||
| Polyurethane (PUR) | ||
| Other Polymer Types | ||
| By Processing Type | Mechanical Recycling | |
| Chemical Recycling | ||
| Biological Recycling | ||
| By End-User Industry | Packaging | |
| Building and Construction | ||
| Automotive | ||
| Electrical and Electronics | ||
| Other End-Use Industries | ||
| By Geography | Asia-Pacific | China |
| India | ||
| Japan | ||
| South Korea | ||
| ASEAN Countries | ||
| Rest of Asia-Pacific | ||
| North America | United States | |
| Canada | ||
| Mexico | ||
| Europe | Germany | |
| United Kingdom | ||
| France | ||
| Italy | ||
| NORDIC Countries | ||
| Russia | ||
| Rest of Europe | ||
| South America | Brazil | |
| Argentina | ||
| Rest of South America | ||
| Middle East and Africa | Saudi Arabia | |
| South Africa | ||
| Rest of Middle East and Africa | ||
Key Questions Answered in the Report
What is current market size of Post-Consumer Recycled Plastics Market?
The post-consumer recycled plastics market size was valued at USD 16.98 billion in 2026 and is estimated to grow from USD 18.54 billion in 2027 to USD 29.22 billion by 2032, at a CAGR of 9.53% during the forecast period (2027-2032).
Which polymer has the strongest growth outlook?
Polystyrene is projected to grow at a CAGR of 10.56% through 2032 as chemical recycling creates new paths to food-grade material.
Why does mechanical recycling remain important?
Mechanical recycling held a 70.67% share in 2026 because it has an established equipment base and lower capital needs than chemical processing.
Which region has the strongest outlook?
Asia-Pacific held a 40.26% share in 2026 and is expected to grow at a CAGR of 11.14% through 2032.