Polyether Ether Ketone (PEEK) Market Size and Share
Market Overview
| Study Period | 2020 - 2031 |
|---|---|
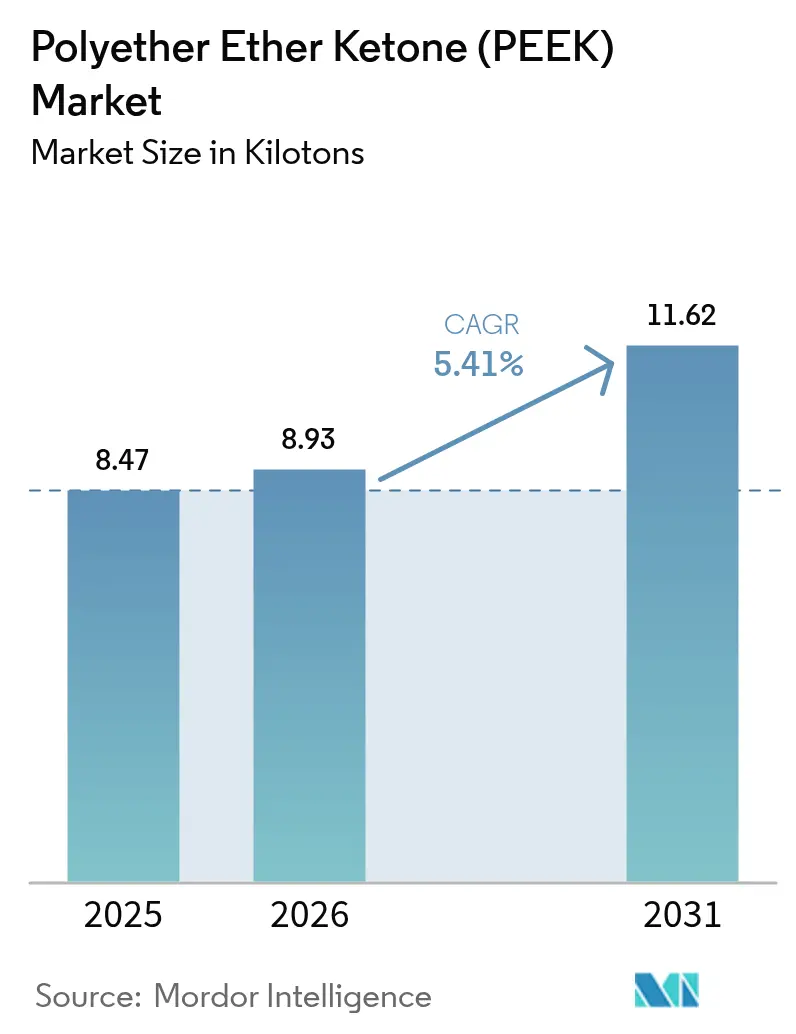
| Market Volume (2026) | 8.93 kilotons |
| Market Volume (2031) | 11.62 kilotons |
| Growth Rate (2026 - 2031) | 5.41% CAGR |
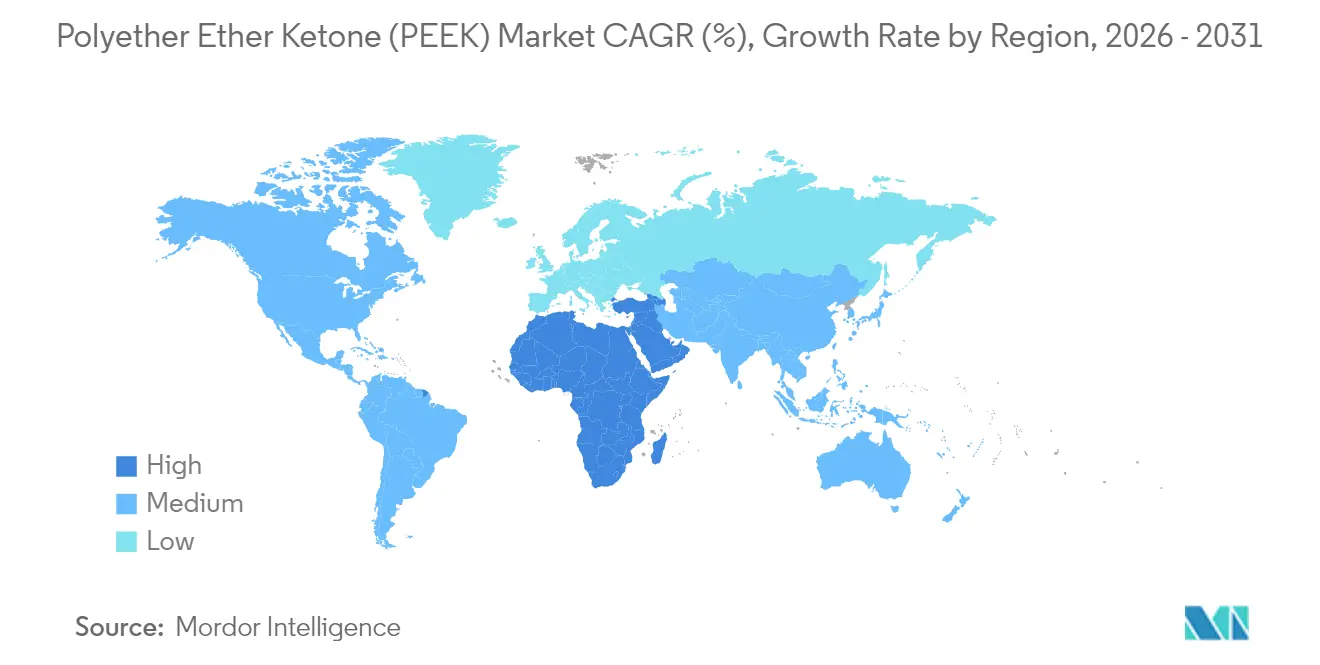
| Fastest Growing Market | Middle East and Africa |
| Largest Market | Asia Pacific |
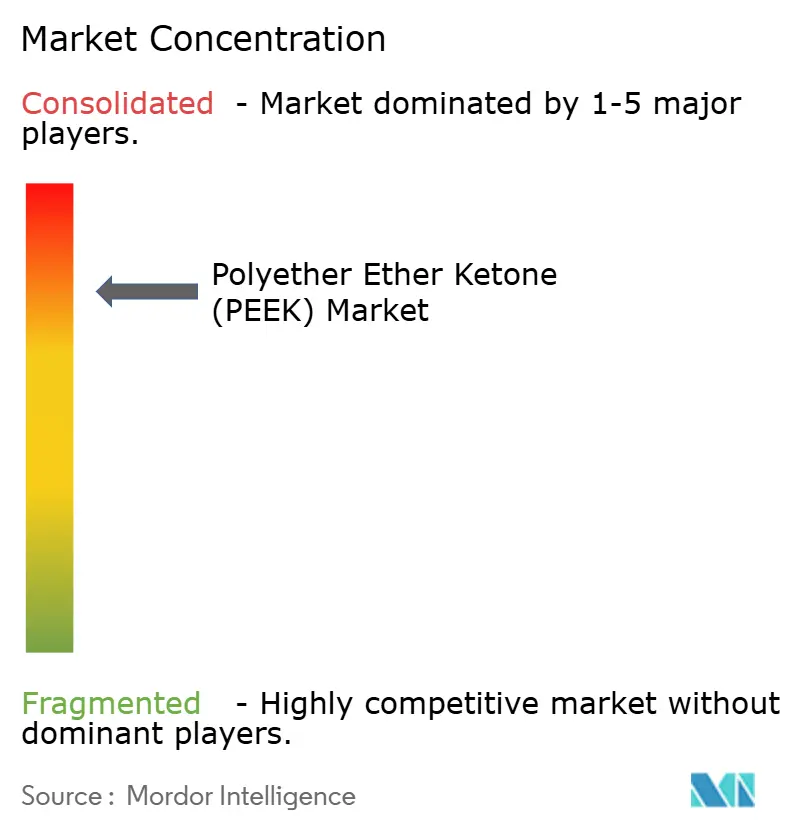
| Market Concentration | High |
Major Players *Disclaimer: Major Players sorted in no particular order Image © Mordor Intelligence. Reuse requires attribution under CC BY 4.0. | |
Polyether Ether Ketone (PEEK) Market Analysis by Mordor Intelligence
The Polyether Ether Ketone market size is expected to grow from 8.47 kilotons in 2025 to 8.93 kilotons in 2026 and is forecast to reach 11.62 kilotons by 2031 at 5.41% CAGR over 2026-2031. Strong demand for lightweight, heat-resistant polymers in the aerospace and electric vehicle sectors, the rapid maturation of additive manufacturing technologies, and regulatory support for biocompatible implants keep the growth momentum intact. Producers are expanding their capacity in Asia to capitalize on proximity advantages, while end-users in Europe and North America are increasingly specifying carbon-filled grades that combine stiffness with flame retardancy. Supply security for the 4,4'-DFBP precursor remains a key factor that favors vertically integrated players, who can buffer volatility. Competitive intensity centers on processing know-how rather than price, as customers require defect-free parts with tight tolerances. Over the next five years, broader use of PEEK in hydrogen infrastructure and humanoid robotics is poised to open new high-margin niches where performance gains outweigh cost concerns.
Key Report Takeaways
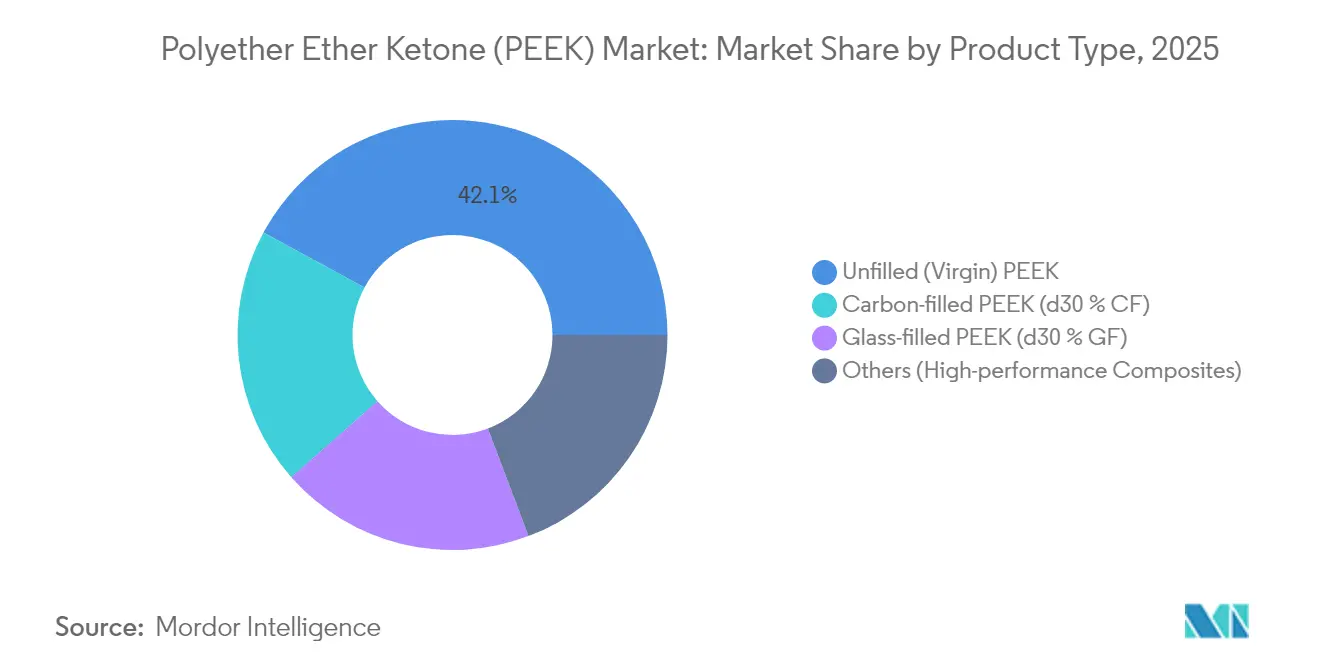
- By product type, unfilled grades held 42.10% of the PEEK market share in 2025, while carbon-filled variants are projected to expand at a 5.95% CAGR through 2031.
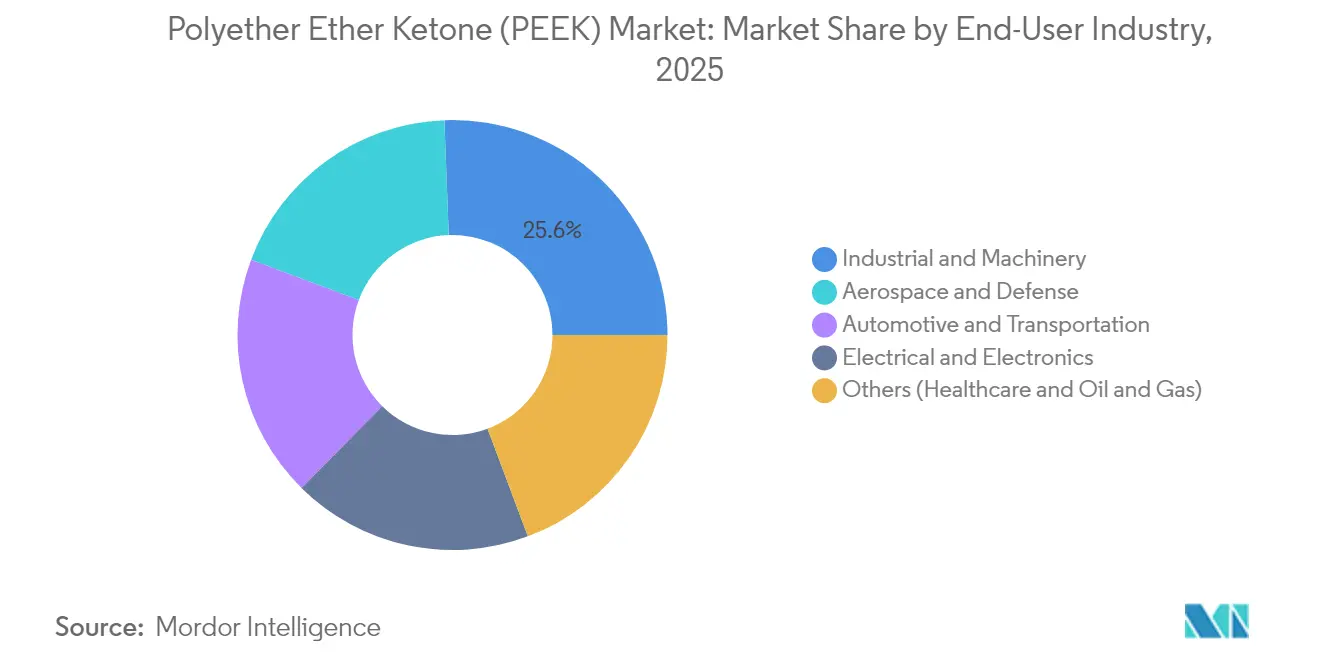
- By end-user industry, the industrial and machinery sector accounted for 25.60% of the PEEK market size in 2025; the aerospace and defense sector is advancing at a 5.70% CAGR to 2031.
- By geography, the Asia-Pacific region led with a 41.20% revenue share in 2025, whereas the Middle East-Africa region is forecast to grow at a 6.05% CAGR during 2026-2031.
Note: Market size and forecast figures in this report are generated using Mordor Intelligence’s proprietary estimation framework, updated with the latest available data and insights as of 2026.
Global Polyether Ether Ketone (PEEK) Market Trends and Insights
Drivers Impact Analysis*
| Driver | (~) % Impact on CAGR Forecast | Geographic Relevance | Impact Timeline |
|---|---|---|---|
| Lightweighting push in aerospace and automotive | +1.80% | North America, Europe | Medium term (2-4 years) |
| Expanding use in medical implants and devices | +1.20% | North America, European Union | Long term (≥ 4 years) |
| Surge in additive-manufacturing grade demand | +0.90% | Asia-Pacific, North America | Short term (≤ 2 years) |
| Humanoid-robot mass-production requirements | +0.70% | Asia-Pacific manufacturing hubs, early adoption in North America | Medium term (2-4 years) |
| Hydrogen-service oil-and-gas components need CF-PEEK | +0.60% | Middle East, North America | Medium term (2-4 years) |
| Source: Mordor Intelligence | |||


Lightweighting push in aerospace and automotive
Aircraft manufacturers validate PEEK brackets, clamps, and cable guides to reduce component weight by up to 30% without compromising mechanical strength, thereby supporting reduced fuel burn targets[1]“PEEK for Aircraft Interior Applications,” Boeing, boeing.com. Electric vehicle programs utilize polymers for battery housings, motor insulation, and cooling manifolds, where simultaneous exposure to heat, vibration, and chemicals renders metals or commodity plastics unsuitable. Design engineers appreciate the material’s low smoke and flame-out properties, which help platforms meet rigorous safety regulations. Growing commitments to net-zero goals by 2050 lock in structural demand, because weight reduction remains one of the few levers that deliver measurable carbon savings across vehicle lifecycles. Mature supply chains in Europe and North America accelerate qualification cycles, reinforcing the use of PEEK in chassis electronics and powertrain sealing systems.
Expanding use in medical implants and devices
PEEK’s radiolucency allows surgeons to monitor bone growth and implant alignment under X-ray or MRI, prompting orthopedic OEMs to replace legacy titanium cages with polymer alternatives. Recent US regulatory guidance has shortened approval timelines for spinal fusion systems using PEEK composites, sparking new investment in precision machining centers and clean-room molding lines. Demand also rides a demographic wave: global hip and spine procedures rise steadily as populations age and remain active. Hospitals seek implants that remain inert inside the body yet withstand repeated sterilization cycles, and PEEK meets both needs. Dental and cardiovascular applications represent an emerging frontier as device designers harness the material’s vibration-damping and fatigue-resistance for long-term in vivo performance. The cumulative effect is to enlarge the addressable volume while lifting average selling prices.
Surge in additive-manufacturing grade demand
High-temperature fused-filament and powder-bed systems now process PEEK into flight-ready parts with complex lattices, significantly reducing the time-to-market for low-volume aerospace hardware. On-demand manufacturing mitigates the risk of supply disruptions and reduces waste, since designers print only what is required. Material suppliers tailor filament rheology and powder morphology to enhance layer adhesion, thereby minimizing porosity that previously limited mechanical performance. Automotive start-ups are leveraging 3D printing to localize the production of battery cooling plates and sensor brackets, thereby sidestepping the expensive tooling that hampers rapid design changes. Service bureaus in the Asia-Pacific region deploy clusters of printers to serve medical device manufacturers that require customized implants, underscoring how additive processes democratize access to high-performance polymers. Short learning curves and declining equipment costs sustain double-digit growth for printable PEEK compounds.
Humanoid-robot mass-production requirements
Robotics programs transitioning from prototype to shop-floor deployment utilize PEEK gears, joint housings, and cable carriers to reduce weight and mitigate motor torque loads[2]“AI Day 2024 Transcript,” Tesla, tesla.com . The polymer’s fatigue endurance extends service intervals, a decisive advantage for robots designed to operate continuously. Suppliers co-develop injection-molded and carbon-filled variants that deliver stiffness without adding bulk, ensuring precise motion control in multi-axis limbs. As factories automate repetitive tasks, each humanoid incorporates tens of PEEK sub-assemblies, multiplying material volumes. Government incentives for smart manufacturing across Asia accelerate this trend, while North American OEMs leverage local molding partners to secure fast response and intellectual property protection. The interplay of cost, durability, and design freedom positions PEEK as a backbone material for next-generation automation.
Restraints Impact Analysis*
| Restraint | (~) % Impact on CAGR Forecast | Geographic Relevance | Impact Timeline |
|---|---|---|---|
| High resin and processing cost | -1.40% | Global | Short term (≤ 2 years) |
| Substitution threat from PPS / PEI | -0.80% | Cost-sensitive markets worldwide | Medium term (2-4 years) |
| Raw-material bottleneck in 4,4′-DFBP feedstock | -0.60% | Global, acutest in Asia-Pacific | Short term (≤ 2 years) |
| Source: Mordor Intelligence | |||
High resin and processing cost
Feedstock scarcity for key intermediates, alongside energy-intensive polymerization steps, keeps baseline PEEK pricing well above USD 50 per kg, thereby narrowing its use in mass-market goods. Specialized extrusion and molding equipment with barrel temperatures above 380 °C requires operators to invest in nichrome heaters, sealed screw designs, and ventilation upgrades. For small fabricators, the capital barrier is significant, slowing geographic expansion into emerging economies. Fluctuations in natural gas prices add further uncertainty because utilities represent a material share of conversion cost. Vertical integration partially cushions integrated producers, yet downstream OEMs still face elevated part prices that strain budgets for cost-sensitive programs. Consequently, designers limit the polymer to applications where its full property package is indispensable.
Substitution threat from PPS / PEI
Polyphenylene sulfide and polyetherimide have improved substantially, closing the gap in continuous-use temperature and chemical resistance for many under-hood automotive uses. Tier-1 suppliers actively benchmark PEEK against these lower-cost options during each platform refresh. Electronics assemblers adopt PEI for connector housings that no longer face the extreme heat seen in legacy soldering waves, while industrial customers consider PPS for pump housings exposed to mild solvents. Resin makers strengthen the challenge by offering glass- or mineral-filled grades that approach the stiffness of PEEK. Although the high-end polymer retains a decisive edge in combined fatigue, temperature, and radiation resistance, ongoing substitution reviews shave growth potential in borderline applications. The result is a continuous need for PEEK suppliers to educate engineers and to demonstrate total cost savings at the system level.
*Our forecasts treat driver/restraint impacts as directional, not additive. The impact forecasts reflect baseline growth, mix effects, and variable interactions.
Segment Analysis
By Product Type: Carbon-filled variants gain traction
Unfilled resin remains the workhorse, underpinned by 42.10% PEEK market share for applications such as high-purity semiconductor wares and chemical-processing seals. Glass-filled grades offer a mid-range option for designers who require dimensional stability at a moderate price premium. Carbon fiber loadings exceeding 30% unlock a modulus of over 18 GPa, a threshold critical for frame components that face cyclical loads in next-generation aircraft. However, fiber segregation during molding poses quality risks that compel producers to refine screw geometry and residence time. Advances in powder-bed fusion techniques permit near-isotropic reinforcement dispersion, widening the appeal of carbon-filled PEEK for intricate parts. Coupled with niche introductions, such as electrically conductive variants for EMI shielding, the segment will continue to set the innovation pace throughout the decade. Carbon-filled formulations accounted for 19.40% of the PEEK market size in 2025 and are projected to rise at a 5.95% CAGR, the fastest among all product categories. The boost comes from aerospace and oil-and-gas users who favor a strength-to-weight ratio surpassing that of aluminum.
Processing developments reinforce these trends. Continuous fiber co-extrusion now embeds carbon yarns inside PEEK ribbons, creating hybrid tapes for structural over-molding. Such semi-finished forms help Tier-1 aero suppliers replace aluminum ribs and stringers without redesigning entire assemblies. In additive manufacturing, controlled build-chamber temperatures limit warpage even at high carbon loading. Consequently, the broader ecosystem around tooling, simulation, and inspection evolves quickly to support these new material forms. Competitive positioning hinges on supplying data packages that prove long-term fatigue life and environmental stress-crack resistance under both aerospace and down-hole conditions. As end users gain confidence, carbon-filled PEEK is likely to displace metals not only for weight but also for total installed cost, given reduced corrosion maintenance needs.


By End-User Industry: Aerospace acceleration reshapes volume mix
Industrial and machinery applications held a 25.60% PEEK market share in 2025, as pumps, valves, and compressor components rely on the polymer to handle abrasive slurries and hot gases. Yet aerospace and defense, though smaller in absolute volume, lead growth at a 5.70% CAGR. Cabin interior panels, cable clips, and structural brackets must satisfy flammability and smoke requirements, areas where PEEK outperforms polyimides that historically dominated. Defense programs utilize the polymer in missile fins and radar connectors that are exposed to rapid temperature fluctuations. Automotive electrification provides another boost: battery OEMs specify PEEK separators and coolant manifolds that withstand a combination of glycol and flame-retardant additives at elevated temperatures. Medical device consumption grows steadily because surgeons seek implants that simplify postoperative imaging, while cosmonauts benefit from the polymer’s radiation resilience in human-rated spacecraft.
Cross-pollination of best practices accelerates adoption. Techniques proven in orthopedic screw machining migrate to produce precise aerospace fasteners with lower scrap rates. Conversely, surface-activation protocols developed for aircraft painting help orthopedic OEMs coat implants with osteoconductive layers. Supply relationships diversify accordingly. Aerospace primes sign multi-year take-or-pay agreements to secure resin volumes, while medical device firms demand batch traceability down to polymerization lots. This matrix of requirements compels resin producers to invest in digital twins and blockchain tracing, raising the bar for new entrants and supporting mid-single-digit pricing power despite raw-material inflation.
Geography Analysis
The Asia-Pacific region controlled 41.20% of the PEEK market share in 2025, primarily due to China’s large-scale consumption across the electronics, rail, and chemical-processing sectors. Government policies that champion domestic supply chains have led to the establishment of new resin lines in Jiangsu and Liaoning, easing the prior dependency on imports. Japan remains at the frontier of application development, especially for semiconductor wafer-handling parts that require ultrapure grades. South Korea leverages its battery supply chain to specify PEEK vent caps and bus-bar insulators for next-generation EV packs. Southeast Asian economies, such as Vietnam, host contract manufacturers that mold medical device parts for export, thereby anchoring further material demand. Downside risks center on trade disputes that could dent cross-border technology transfer; however, intra-Asian demand is strong enough to offset rerouting scenarios.
North America ranks second in volume, primarily driven by its aerospace manufacturing corridor, which extends from Washington through South Carolina, and a robust network of medical device clusters centered around Minneapolis and Boston. US Advanced Manufacturing Tax Credits passed in 2024 stimulated upgrades to high-temperature molding presses, improving throughput and lowering scrap. Canada’s oil-sand industry requires piping liners with excellent sour-gas resistance, positioning PEEK as a material of choice for corrosion mitigation in CO₂-injection wells. Mexico’s automotive plants incorporate the polymer into wiring harness clips and turbocharger bushings for vehicles earmarked for US export. Regional producers also benefit from shale-gas-based feedstocks that improve cost competitiveness versus Europe.
Europe maintains technology leadership in automotive and sustainable energy. German OEMs redesign battery housings around the polymer to achieve cell-to-pack integration while meeting stringent crash norms. France applies PEEK in cryogenic valves for its nascent hydrogen economy, whereas the United Kingdom continues to certify additive-manufactured aircraft parts under the Civil Aviation Authority. Energy-efficiency directives spur replacement of brass in compressor pistons with polymer composites that cut frictional losses. Eastern Europe sees steady pick-up in rail applications, notably in door-mechanism bushings that must handle temperature swings from -40°C to 80°C. Currency volatility remains the main concern, although forward contracts mitigate most transaction exposure for integrated players.
Middle East-Africa logs the highest regional CAGR at 6.05% as energy majors roll out hydrogen and ammonia projects, each requiring PEEK tubing, seals, and sensor covers to handle aggressive media. Saudi Arabia invests in a 300-ton green-field resin plant to capture value from upstream aromatics. The United Arab Emirates deploys 3D-printed PEEK parts in solar-thermal installations where UV-resistant metals corrode quickly. South Africa’s mining operations introduce the polymer in slurry pump liners that extend mean time between failures. Logistics hurdles and limited technical labor remain growth brakes, yet ongoing partnerships with European engineering firms are closing the gap. South America, while smaller, shows promise as Brazilian aircraft programs move toward all-composite fuselages requiring high-temperature clips and ducts.

Competitive Landscape
The Polyether Ether Ketone (PEEK) market is substantially concentrated, with the global capacity being concentrated among five producers. Price competition remains limited because quality validation cycles can span two years, dissuading OEMs from opportunistic switching. Instead, value-added services carry weight: finite-element modeling support, rapid prototyping centers, and on-site molding workshops anchor long-term contracts. Intellectual property related to carbon fiber dispersion and surface energy modification becomes a key to premium niches.
Polyether Ether Ketone (PEEK) Industry Leaders
Evonik Industries AG
Solvay
Panjin Zhongrun High Performance Polymer Co., Ltd.
Celanese Corporation
Victrex plc
- *Disclaimer: Major Players sorted in no particular order

Recent Industry Developments
- September 2025: Essentra Components launched a new range of PEEK fasteners with high chemical resistance, thermal stability, and mechanical properties for extreme environments, such as components in fuel systems or those operating in an ultra-high vacuum, thereby reducing the risk of containment and thermal instability.
- May 2024: Evonik announced a new non-exclusive distribution partnership with ProductionToGo to handle the distribution of Evonik’s photopolymers and PEEK-based filaments of the INFINAM brand in the European Union, Switzerland, Norway, and the United Kingdom.


Global Polyether Ether Ketone (PEEK) Market Report Scope
Aerospace, Automotive, Electrical and Electronics, Industrial and Machinery are covered as segments by End User Industry. Africa, Asia-Pacific, Europe, Middle East, North America, South America are covered as segments by Region.| Unfilled (Virgin) PEEK |
| Glass-filled PEEK (≤30 % GF) |
| Carbon-filled PEEK (≤30 % CF) |
| Others (High-performance Composites (CF > 30 %, hybrid, MOD)) |
| Aerospace and Defense |
| Automotive and Transportation |
| Electrical and Electronics |
| Industrial and Machinery |
| Others (Healthcare and Oil and Gas) |
| Asia-Pacific | China |
| India | |
| Japan | |
| South Korea | |
| ASEAN Countries | |
| Rest of Asia-Pacific | |
| North America | United States |
| Canada | |
| Mexico | |
| Europe | Germany |
| United Kingdom | |
| France | |
| Spain | |
| Italy | |
| Russia | |
| NORDIC Countries | |
| Rest of Europe | |
| South America | Brazil |
| Argentina | |
| Rest of South America | |
| Middle-East and Africa | Saudi Arabia |
| Turkey | |
| South Africa | |
| Rest of Middle-East and Africa |
| By Product Type | Unfilled (Virgin) PEEK | |
| Glass-filled PEEK (≤30 % GF) | ||
| Carbon-filled PEEK (≤30 % CF) | ||
| Others (High-performance Composites (CF > 30 %, hybrid, MOD)) | ||
| By End-User Industry | Aerospace and Defense | |
| Automotive and Transportation | ||
| Electrical and Electronics | ||
| Industrial and Machinery | ||
| Others (Healthcare and Oil and Gas) | ||
| By Geography | Asia-Pacific | China |
| India | ||
| Japan | ||
| South Korea | ||
| ASEAN Countries | ||
| Rest of Asia-Pacific | ||
| North America | United States | |
| Canada | ||
| Mexico | ||
| Europe | Germany | |
| United Kingdom | ||
| France | ||
| Spain | ||
| Italy | ||
| Russia | ||
| NORDIC Countries | ||
| Rest of Europe | ||
| South America | Brazil | |
| Argentina | ||
| Rest of South America | ||
| Middle-East and Africa | Saudi Arabia | |
| Turkey | ||
| South Africa | ||
| Rest of Middle-East and Africa | ||


Market Definition
- End-user Industry - Automotive, Aerospace, Industrial Machinery, Electrical & Electronics, and Others are the end-user industries considered under the polyether ether ketone market.
- Resin - Under the scope of the study, virgin polyether ether ketone resin in primary forms such as powder, pellet, etc. are considered.
| Keyword | Definition |
|---|---|
| Acetal | This is a rigid material that has a slippery surface. It can easily withstand wear and tear in abusive work environments. This polymer is used for building applications such as gears, bearings, valve components, etc. |
| Acrylic | This synthetic resin is a derivative of acrylic acid. It forms a smooth surface and is mainly used for various indoor applications. The material can also be used for outdoor applications with a special formulation. |
| Cast film | A cast film is made by depositing a layer of plastic onto a surface then solidifying and removing the film from that surface. The plastic layer can be in molten form, in a solution, or in dispersion. |
| Colorants & Pigments | Colorants & Pigments are additives used to change the color of the plastic. They can be a powder or a resin/color premix. |
| Composite material | A composite material is a material that is produced from two or more constituent materials. These constituent materials have dissimilar chemical or physical properties and are merged to create a material with properties unlike the individual elements. |
| Degree of Polymerization (DP) | The number of monomeric units in a macromolecule, polymer, or oligomer molecule is referred to as the degree of polymerization or DP. Plastics with useful physical properties often have DPs in the thousands. |
| Dispersion | To create a suspension or solution of material in another substance, fine, agglomerated solid particles of one substance are dispersed in a liquid or another substance to form a dispersion. |
| Fiberglass | Fiberglass-reinforced plastic is a material made up of glass fibers embedded in a resin matrix. These materials have high tensile and impact strength. Handrails and platforms are two examples of lightweight structural applications that use standard fiberglass. |
| Fiber-reinforced polymer (FRP) | Fiber-reinforced polymer is a composite material made of a polymer matrix reinforced with fibers. The fibers are usually glass, carbon, aramid, or basalt. |
| Flake | This is a dry, peeled-off piece, usually with an uneven surface, and is the base of cellulosic plastics. |
| Fluoropolymers | This is a fluorocarbon-based polymer with multiple carbon-fluorine bonds. It is characterized by high resistance to solvents, acids, and bases. These materials are tough yet easy to machine. Some of the popular fluoropolymers are PTFE, ETFE, PVDF, PVF, etc. |
| Kevlar | Kevlar is the commonly referred name for aramid fiber, which was initially a Dupont brand for aramid fiber. Any group of lightweight, heat-resistant, solid, synthetic, aromatic polyamide materials that are fashioned into fibers, filaments, or sheets is called aramid fiber. They are classified into Para-aramid and Meta-aramid. |
| Laminate | A structure or surface composed of sequential layers of material bonded under pressure and heat to build up to the desired shape and width. |
| Nylon | They are synthetic fiber-forming polyamides formed into yarns and monofilaments. These fibers possess excellent tensile strength, durability, and elasticity. They have high melting points and can resist chemicals and various liquids. |
| PET preform | A preform is an intermediate product that is subsequently blown into a polyethylene terephthalate (PET) bottle or a container. |
| Plastic compounding | Compounding consists of preparing plastic formulations by mixing and/or blending polymers and additives in a molten state to achieve the desired characteristics. These blends are automatically dosed with fixed setpoints usually through feeders/hoppers. |
| Plastic pellets | Plastic pellets, also known as pre-production pellets or nurdles, are the building blocks for nearly every product made of plastic. |
| Polymerization | It is a chemical reaction of several monomer molecules to form polymer chains that form stable covalent bonds. |
| Styrene Copolymers | A copolymer is a polymer derived from more than one species of monomer, and a styrene copolymer is a chain of polymers consisting of styrene and acrylate. |
| Thermoplastics | Thermoplastics are defined as polymers that become soft material when it is heated and becomes hard when it is cooled. Thermoplastics have wide-ranging properties and can be remolded and recycled without affecting their physical properties. |
| Virgin Plastic | It is a basic form of plastic that has never been used, processed, or developed. It may be considered more valuable than recycled or already used materials. |


Research Methodology
Mordor Intelligence follows a four-step methodology in all our reports.
- Step-1: Identify Key Variables: The quantifiable key variables (industry and extraneous) pertaining to the specific product segment and country are selected from a group of relevant variables & factors based on desk research & literature review; along with primary expert inputs. These variables are further confirmed through regression modeling (wherever required).
- Step-2: Build a Market Model: In order to build a robust forecasting methodology, the variables and factors identified in Step-1 are tested against available historical market numbers. Through an iterative process, the variables required for market forecast are set and the model is built on the basis of these variables.
- Step-3: Validate and Finalize: In this important step, all market numbers, variables and analyst calls are validated through an extensive network of primary research experts from the market studied. The respondents are selected across levels and functions to generate a holistic picture of the market studied.
- Step-4: Research Outputs: Syndicated Reports, Custom Consulting Assignments, Databases & Subscription Platforms


