
North America Rigid Plastic Packaging Market Size and Share
Market Overview
| Study Period | 2020 - 2031 |
|---|---|
| Forecast Data Period | 2026 - 2031 |
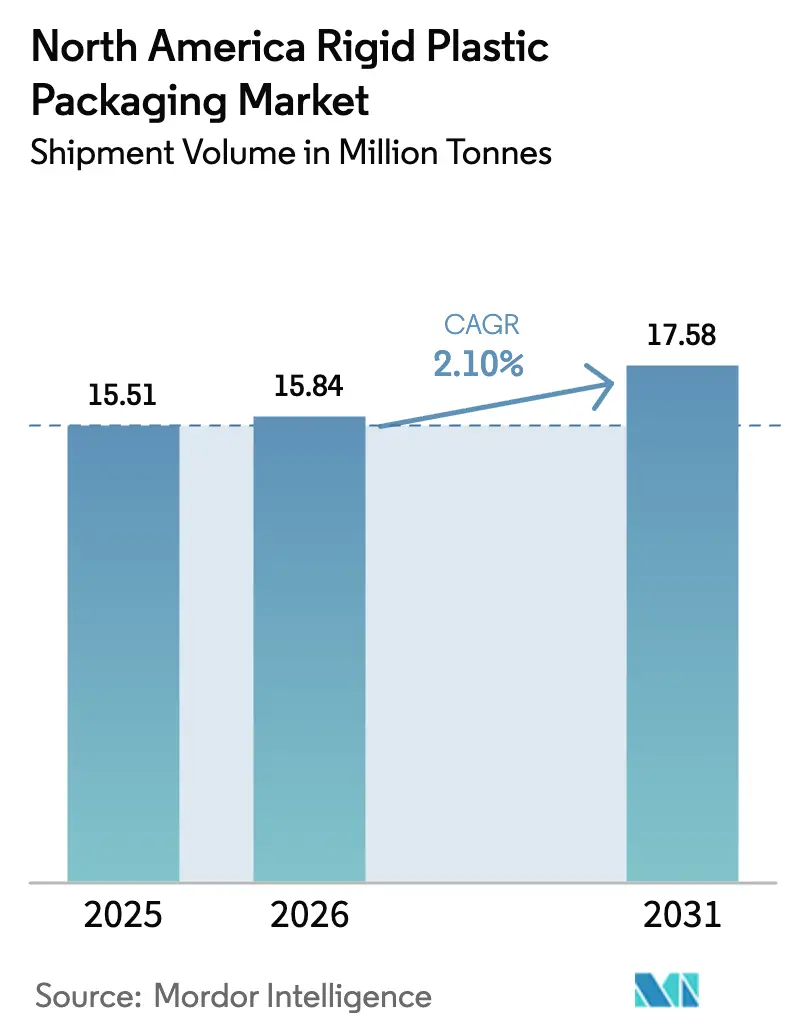
| Base Year Market Size (2025) | 15.51 Million tonnes |
| Market Volume (2026) | 15.84 Million tonnes |
| Market Volume (2031) | 17.58 Million tonnes |
| Growth Rate (2026 - 2031) | 2.10 % |
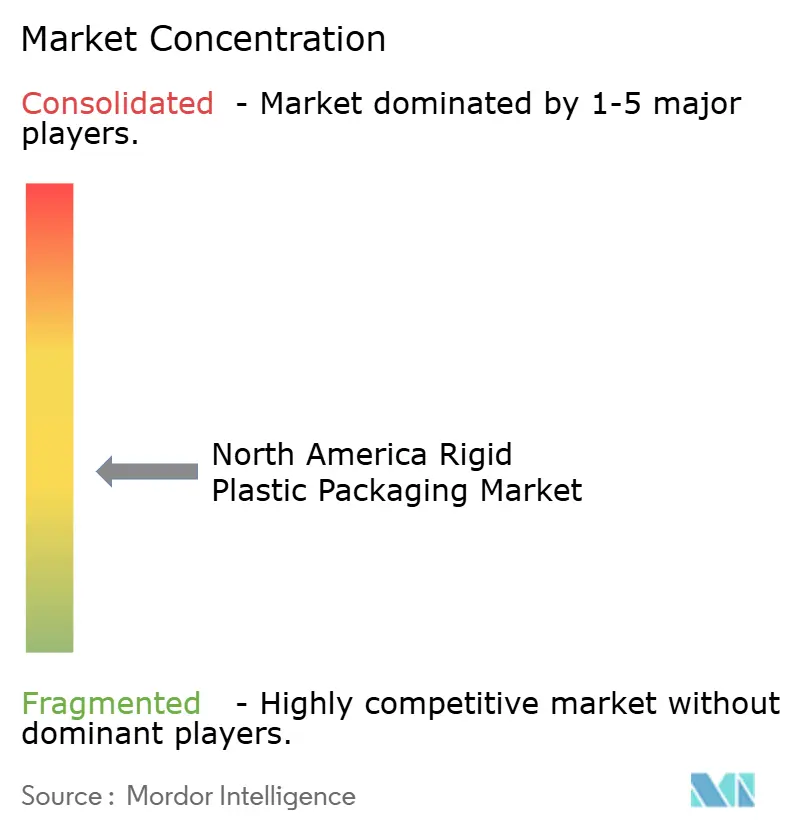
| Market Concentration | Medium |
Major Players
*Disclaimer: Major Players sorted in no particular order Image © Mordor Intelligence. Reuse requires attribution under CC BY 4.0. |
|
North America Rigid Plastic Packaging Market Analysis by Mordor Intelligence
The North America rigid plastic packaging market size is expected to grow from 15.51 million tonnes in 2025 to 15.84 million tonnes in 2026 and is forecast to reach 17.58 million tonnes by 2031 at 2.10% CAGR over 2026-2031. Petrochemical capacity reallocations from fuels to polymers are lowering resin input costs, enabling producers to defend margins even as sustainability and regulatory pressures intensify. Brand-owner commitments to higher recycled content, rapid e-commerce adoption, and automation investments in molding lines collectively sustain moderate tonnage growth. Competitive dynamics remain fragmented because mid-sized converters retain strong customer relationships, while multinationals press scale advantages in feedstock sourcing and technology deployment. Across end-user sectors, beverages, food, and pharmaceuticals dominate demand, yet growth accelerates most sharply in healthcare packaging as biologics and specialty drugs proliferate.
Key Report Takeaways
- By resin type, polyethylene held 29.10% of the North America rigid plastic packaging market share in 2025; polyethylene terephthalate is advancing at a 3.72% CAGR through 2031.
- By product type, bottles and jars captured 45.10% revenue share in 2025; caps and closures are forecast to expand at a 3.1% CAGR to 2031.
- By end-user industry, beverages led with 35.90% of the North America rigid plastic packaging market size in 2025; healthcare and pharmaceuticals are growing fastest at 4.74% CAGR through 2031.
- By manufacturing process, injection molding accounted for 25.40% share in 2025; thermoforming posts the highest projected CAGR at 3.6% to 2031.
- By country, the United States dominated with 71.10% share in 2025, while Mexico records the highest 4.05% CAGR through 2031.
Note: Market size and forecast figures in this report are generated using Mordor Intelligence’s proprietary estimation framework, updated with the latest available data and insights as of 2026.
North America Rigid Plastic Packaging Market Trends and Insights
Drivers Impact Analysis*
| Driver | (~) % Impact on CAGR Forecast | Geographic Relevance | Impact Timeline |
|---|---|---|---|
| Growing FMCG penetration boosts demand | +0.8% | North America, strongest in Mexico and US South | Medium term (2-4 years) |
| PET bottle sustainability programs accelerate rPET procurement | +0.6% | US and Canada, regulatory-driven | Long term (≥ 4 years) |
| Expansion of e-commerce and D2C channels raises protective-packaging needs | +0.4% | North America, urban concentration | Short term (≤ 2 years) |
| FDA migration-limit revisions spur barrier-coating investments | +0.3% | US market, food contact applications | Medium term (2-4 years) |
| AI-enabled defect-detection lowers scrap rates and widens profit pools | +0.2% | US and Canada, technology-advanced facilities | Long term (≥ 4 years) |
| NA petro-chemical capacity shift from fuels to polymers keeps resin prices competitive | +0.1% | North America, Gulf Coast concentration | Long term (≥ 4 years) |
| Source: Mordor Intelligence | |||
Growing FMCG Penetration Drives Volume Expansion
Rising disposable income and urbanization in Mexico and the US South are broadening modern retail footprints and lifting demand for packaged food and beverages. National convenience-store chains drive high product turnover, requiring rigid containers that protect freshness during longer shelf cycles.[1]U.S. Census Bureau, “Economic Census Manufacturing Data,” CENSUS.GOV Brand owners favor polyethylene and polypropylene bottles for oil, sauces, and household goods because material cost stability supports predictable unit economics. Large retailers also promote private-label ranges, stimulating smaller production runs that benefit from flexible injection and blow-molding equipment. The combined effect of more SKUs and higher per-capita consumption underpins baseline growth in the North America rigid plastic packaging market. FMCG penetration therefore offsets sluggish demand in mature categories such as carbonated soft drinks.
PET Bottle Sustainability Programs Accelerate rPET Procurement
Major beverage companies have pledged minimum recycled content thresholds often 25% or higher by 2030, catalyzing investment in food-grade rPET capacity. Collection systems improved, lifting the regional PET bottle recycling rate to 27.9% in 2024. Producers such as Plastipak and ALPLA responded by expanding depolymerization and purification lines, helping brand owners meet voluntary and legislative targets. Recycled resin trades at a premium to virgin PET, but volume commitments enable long-term offtake contracts that de-risk capital spending. As rPET adoption grows, converters differentiate through contamination control and traceability audits demanded by beverage clients. These sustainability programs are now a structural driver of the North America rigid plastic packaging market
E-Commerce Growth Intensifies Protective-Packaging Requirements
Direct-to-consumer shipments expose products to multiple handling points, heightening breakage risks for liquids, supplements, and cosmetics. Rigid bottles with thicker wall sections and tamper-evident closures mitigate this risk and align with Amazon’s Frustration-Free Packaging guidelines. Healthcare brands shipping temperature-sensitive products adopt molded polyethylene containers that integrate passive cooling elements, ensuring efficacy over extended transit times. The requirement for barcode compatibility and in-box presentation value further pushes suppliers to add labeling and design capabilities in-house. Consequently, specialized SKUs destined for e-commerce fulfilment centers are increasing their share of the North America rigid plastic packaging market
FDA Migration-Limit Revisions Drive Barrier Technology Investment
In 2024, the FDA updated guidance on specific migration limits for food-contact substances, tightening rules for acidic and high-fat products. Rigid packaging suppliers responded by deploying plasma-enhanced coatings and multilayer structures that block mineral oil hydrocarbons and reduce oxygen ingress. These technologies extend shelf life for sauces, ready-to-eat meals, and baby foods, giving adopters a competitive edge with grocery partners. Compliance projects often coincide with plant upgrades that include inline spectrometry tools to verify barrier performance, raising capital requirements and barriers to entry. The need for proven migration performance cements long-term demand for high-specification containers within the North America rigid plastic packaging market.[2]U.S. Food and Drug Administration, “Food Contact Substance Regulations,” FDA.GOV
Restraints Impact Analysis*
| Restraint | (~) % Impact on CAGR Forecast | Geographic Relevance | Impact Timeline |
|---|---|---|---|
| Shift toward flexible and paper-based formats | -0.4% | North America, consumer goods focus | Medium term (2-4 years) |
| Volatile virgin-resin feedstock prices | -0.3% | North America, petrochemical-dependent regions | Short term (≤ 2 years) |
| Shortfall of food-grade PCR supply caps recycled-content adoption | -0.2% | US and Canada, beverage industry concentration | Long term (≥ 4 years) |
| State-level EPR fees squeeze low-margin rigid formats | -0.1% | US state-level, California and Northeast focus | Medium term (2-4 years) |
| Source: Mordor Intelligence | |||
Flexible and Paper-Based Format Competition Intensifies
Environment-conscious consumers perceive single-use rigid plastics as less sustainable than lightweight pouches or emerging fiber-based solutions. Brand owners responding to retailer scorecards convert selected SKUs such as dry snack packs and seasoning mixes to laminates or coated paperboard. Packaging machinery suppliers now offer multimodal filling lines, lowering switching costs between rigid and flexible formats. Nevertheless, rigid packaging retains functional advantages where impact resistance, stack strength, or tamper evidence is critical, limiting share erosion to specific categories. The competitive tension suppresses price-increase headroom for converters in the North America rigid plastic packaging market.
Feedstock Price Volatility Creates Cost Pressures
Though overall resin capacity is growing, unplanned cracker outages and geopolitical events can still trigger 15% quarter-to-quarter price swings for polypropylene and polyethylene. Smaller converters operating on thin margins struggle to pass through surcharges swiftly, compressing cash flow. Hedging instruments exist but require financial expertise and minimum volumes, favoring integrated multinationals. Persistent volatility incentivizes lightweighting programs and alternate material exploration, but such redesigns entail capital expenditure and qualification timelines. These dynamics temper profit expansion across the North America rigid plastic packaging industry during high-price cycles
*Our forecasts treat driver/restraint impacts as directional, not additive. The impact forecasts reflect baseline growth, mix effects, and variable interactions.
Segment Analysis
By Resin Type: PET Growth Outpaces Traditional Polyolefins
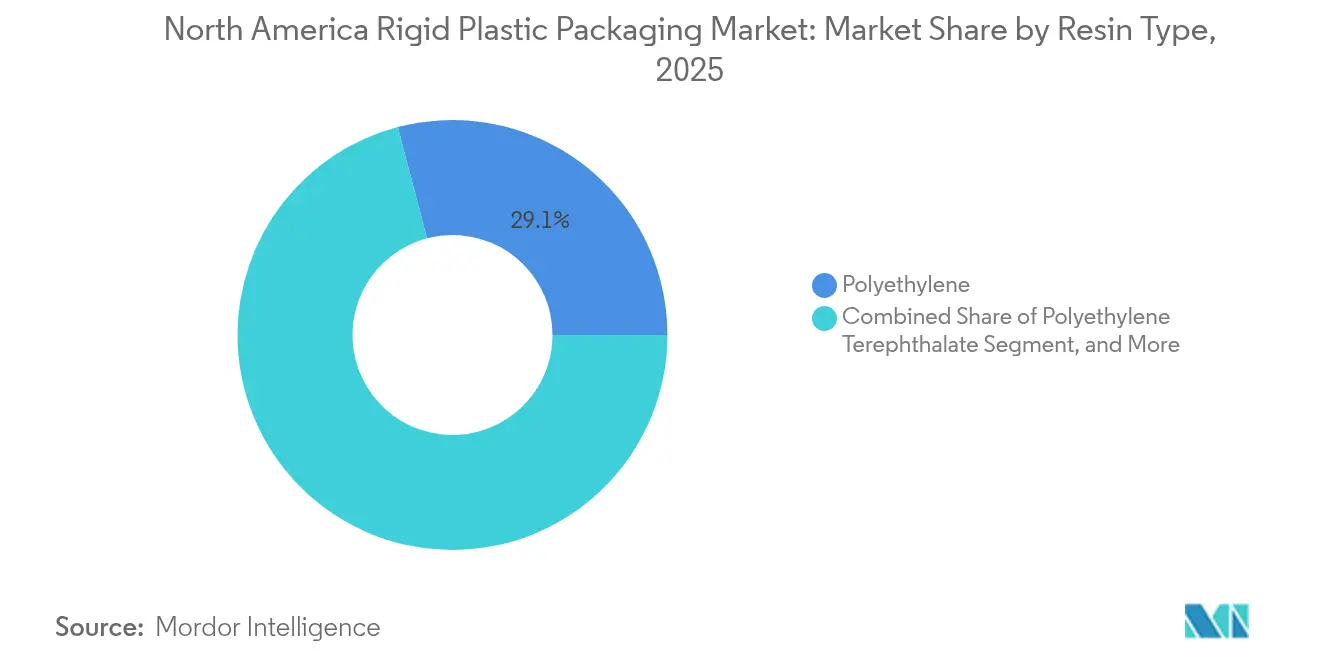
Polyethylene commanded the largest 29.10% share in 2025, reflecting entrenched processing infrastructure and versatile performance. Beverage, household, and industrial chemical producers rely on high-density grades for chemical resistance and rigidity. The North America rigid plastic packaging market size for polyethylene reached 4.51 million tonnes in 2025, yet its forward CAGR trails that of PET. PET’s 3.72% CAGR benefits from recyclability credentials and clarity prized by beverage brands. Recycled-content mandates accelerate food-grade rPET use, creating premium niches for suppliers with advanced decontamination reactors. Polypropylene retains specialized roles in hot-fill and microwaveable containers, while polystyrene’s decline continues due to municipal bans. Emerging bio-based resins appear in pilot volumes, appealing to premium cosmetic lines. Overall, resin diversification is rising but polyolefins and PET will remain core pillars of the North America rigid plastic packaging market.
Ongoing R&D focuses on barrier additives and chain-extension chemistries that enable higher recycled content without compromising mechanical properties. Converters collaborate with resin producers to qualify new grades under FDA 21 CFR regulations for food contact, shortening commercialization timelines. Such partnerships embed resin suppliers deeper into customer value chains, supporting stable demand even as material circularity expectations climb



By Product Type: Caps and Closures Lead Innovation-Driven Growth
Bottles and jars represented 45.10% of 2025 shipments, aligned with long-standing filling and distribution systems across beverages, sauces, and personal care. Their entrenched tooling bases and compatibility with existing labeling lines safeguard share within the North America rigid plastic packaging market. Trays and tubs serve ready-meal and dairy applications that demand rigidity to prevent deformation during microwave heating. Intermediate bulk containers support chemicals and lubricants thanks to stack strength, while drums cater to bulk transport.
Caps and closures exhibit the fastest 3.1% CAGR, propelled by heightened safety and convenience needs. Child-resistant mechanisms, dose-control droppers, and tethered closures to meet single-use-plastic directives drive design complexity and raise average unit revenue. Smart closures integrating NFC chips enter pilot scale in premium spirits, providing authenticity verification. Converters invest in multi-component molding and post-mold assembly automation to capture this high-value segment. As a result, caps and closures gain strategic prominence inside the North America rigid plastic packaging market.
By End-User Industry: Healthcare Drives Premium Growth
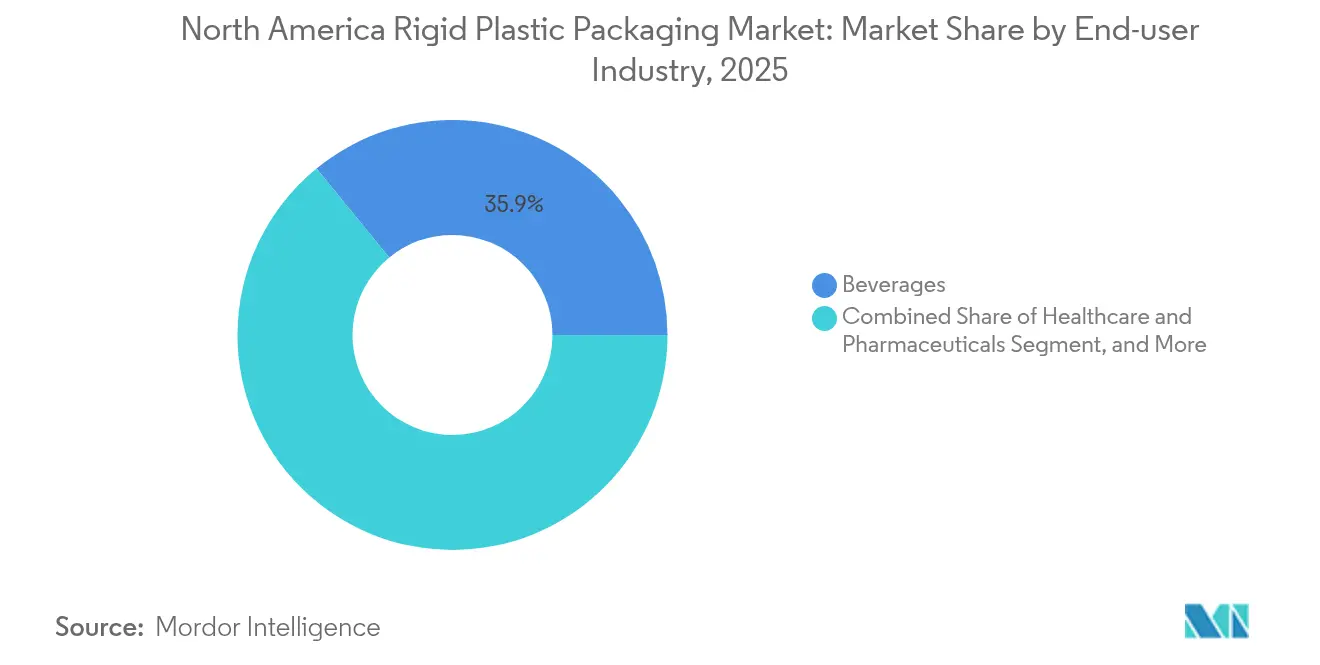
Beverages dominated at 35.90% share in 2025, with bottled water, functional drinks, and alcoholic beverages underpinning volume. Carbonated soft drinks maintain relevance, yet flavor innovations in sparkling water and energy segments support incremental bottle demand. Across food applications, sauces, condiments, and dairy require oxygen and light barriers that favor multilayer rigid containers.
Healthcare and pharmaceuticals post the strongest 4.74% CAGR because biologics, diagnostic kits, and self-administration devices need high-precision plastic packaging. USP <661.2> standards govern extractables and leachables, directing material selection toward medical-grade polypropylene and cyclic olefin copolymers. Aging demographics and telehealth trends boost demand for unit-dose blister packs and oral-solid bottles shipped direct to consumers. As regulators encourage child-resistant and senior-friendly designs, rigid formats hold functional advantages over flexible pouches, lifting their share of the North America rigid plastic packaging market.
By Manufacturing Process: Thermoforming Gains from Efficiency Improvements
Injection molding held 25.40% share in 2025 owing to capability to produce intricate geometries and threaded finishes essential for closures and medical components. High-cavitation molds coupled with all-electric presses achieve short cycle times and tight tolerances. The method therefore anchors high-volume beverage and household chemical supply chains.
Thermoforming records the leading 3.6% CAGR as processors target lightweight tray and clamshell applications. Advances in infrared heating and servo-controlled form-cut-stack systems cut energy consumption, making the process cost-competitive for medium-run volumes. Rapid tool changeovers enable SKU proliferation demanded by grocery retail. Blow molding continues to dominate monolayer PET bottles, while compression molding finds niche use in specialty closures. Process digitalization via IoT sensors and predictive analytics elevates uptime, reinforcing manufacturing competitiveness across the North America rigid plastic packaging industry.
Geography Analysis
In the United States, extensive petrochemical feedstock stemming from shale gas production sustains globally competitive polyethylene pricing, anchoring domestic conversion volumes. Large converters leverage automation and proximity to multinational brand owners to secure multiyear contracts. FDA rule updates on food-contact migration accelerate adoption of advanced barrier technologies, providing differentiation for innovation-oriented suppliers.
Mexico’s demographic tailwinds and expanding organized retail spur rigid container uptake in sauces, dairy, and personal-care categories. State-level incentives for recycled-content production encourage joint ventures between local recyclers and international resin producers. Logistics corridors linking central Mexico to Texas foster efficient bidirectional trade in preforms and closures, embedding Mexican plants within the broader North America rigid plastic packaging market ecosystem.
Canada’s high per-capita income fuels steady demand for premium beverages and nutraceuticals. Federal targets for 90% recycling of plastic beverage containers by 2029 stimulate investment in deposit-return infrastructure. Converters differentiate through post-consumer resin certification and carbon-neutral manufacturing claims, resonating with eco-conscious consumers. Health Canada’s risk-based review process influences material and additive choices, favoring suppliers with robust toxicological data packages
Value Chain Analysis
The North America rigid plastic packaging value chain begins with feedstock and resin production (PET, PE, PP) concentrated around petrochemical hubs, then moves through compounding and additives, including colorants, before conversion via injection molding, blow molding, and thermoforming. Converters deliver bottles and jars, caps and closures, trays and containers, drums, and IBC components to brand owners across beverages, food, healthcare and pharmaceuticals, personal care, and industrial chemicals. Downstream needs typically include decoration and labeling, filling-line compatibility, and distribution performance for retail and e-commerce channels.
Circularity services increasingly run parallel to the physical flow, covering bale collection, sorting, washing, and reprocessing into PCR, especially food-grade rPET constraints, along with certification and traceability programs. Industry bodies such as the Plastics Industry Association (PLASTICS) and the Industrial Packaging Alliance of North America (IPANA), plus application groups including the Rigid Intermediate Bulk Container Association (RIBCA), shape standards and advocacy that influence specifications and procurement in industrial rigid formats. Frameworks like GreenBlue's Recycled Material Standard (RMS) are used to document recycled-resin attributes through mass-balance or related accounting approaches, aligning with the auditability brand owners seek for recycled-content targets.
Competitive Landscape
The market remains moderately fragmented; the top five suppliers hold an estimated 38% combined share, leaving ample space for regional specialists. Amcor, Berry Global, and Plastipak operate integrated resin-to-packaging chains, securing raw-material certainty and cost efficiencies. These firms co-develop lightweight bottle platforms with beverage giants to meet performance and sustainability targets. Regional players such as TricorBraun excel in design services and agile order fulfillment, earning loyalty among craft beverage and personal-care brands.
Strategic moves concentrate on capacity expansion, recycled-content integration, and smart-packaging technologies. The 2024 Amcor–Berry Global merger created a global rigid packaging powerhouse with broad resin know-how and a diversified customer base. ALPLA’s USD 75 million rPET upgrade broadened food-grade resin availability, while Gerresheimer’s USD 45 million injection blow-molding expansion addresses rising biologic drug demand. Patents filed at the USPTO for AI-enabled inspection platforms and enzymatic recycling indicate future competitive arenas.[3]U.S. Patent and Trademark Office, “Packaging Technology Patent Database,” USPTO.GOV Suppliers anticipate regulatory tightening and consumer scrutiny, embedding circular-economy principles into long-range capital planning across the North America rigid plastic packaging market.
North America Rigid Plastic Packaging Industry Leaders
-
Sonoco Products Company
-
ALPLA Group
-
Plastipak Holdings Inc.
-
Polytainers Inc.
-
Amcor plc
- *Disclaimer: Major Players sorted in no particular order

Market Opportunities and Future Outlook
Opportunities are strongest where rigid plastics can combine compliance, barrier performance, and circularity, particularly in food-contact and healthcare packaging that face tighter material and quality expectations. The 2024 FDA guidance updates on specific migration limits have raised the bar for higher-spec barrier structures and verification capabilities, creating space for converters that can pair barrier performance with recyclability or higher PCR content without compromising safety and shelf life.
Investment and product activity also point to circularity-linked inputs and alternative substrate strategies reshaping rigid portfolios. In July 2026, Plastipak introduced pakPET Single Pellet Solution, incorporating 30% recycled content for food and drink applications, a product-level step aimed at improving recycled-content economics and consistency for PET packaging. At the same time, North American demand pull for lower-impact formats shows up in converter capacity adds, including Sonoco adding a second rigid paper can manufacturing line in West Chicago in June 2026. These moves indicate that rigid-plastic suppliers can protect share by integrating PCR, tightening traceability, and upgrading processes such as AI-enabled inspection to lower scrap, while also competing with adjacent rigid alternatives in specific end uses.
Recent Industry Developments
- July 2026: Plastipak Holdings Inc. introduces pakPET Single Pellet Solution, a PET resin with 30% recycled content, certified under EN15343 for food/drink packaging. The launch expands recycled-content capabilities in North American packaging, enabling brand partners to meet sustainability targets. Capacity expansion strengthens Plastipak's position in the NA rigid packaging value chain against resin-cost volatility.
- June 2026: Sonoco Products Company added a second rigid paper cans manufacturing line at West Chicago, Illinois facility to double production capacity. The capacity increase expands alternative-material packaging options in the North American market, supporting brands seeking lighter or sustainable solutions. The capacity addition enhances portfolio resilience against resin-cost fluctuations and plastic demand shifts.
- May 2026: Sonoco Products Company unveiled CapOnCan mono-material steel and AFNOR-certified microwaveable metal bowls at Interpack 2026 as alternatives to plastics and glass. The new metal packaging options broaden the materials mix for NA customers. The development may moderate plastic demand growth in the North American market.


Research Methodology Framework and Report Scope
Market Definition and Coverage
For this methodology, the market covers rigid plastic packaging produced and consumed across North America, measured as the physical volume of rigid plastic packs used to contain, protect, and distribute products across end-use industries.
Scope exclusions: This estimate excludes flexible plastic packaging formats and any paper, glass, or metal rigid packs.
Segmentation Overview
-
By Resin Type
-
Polyethylene
- High-Density Polyethylene (HDPE)
- Low-Density Polyethylene (LDPE)
- Linear Low-Density Polyethylene (LLDPE)
- Polyethylene Terephthalate
- Polypropylene
- Polystyrene and EPS
- Other Resin Type
-
Polyethylene
-
By Product Type
- Bottles and Jars
- Trays and Containers
- Caps and Closures
- Intermediate Bulk Containers (IBCs)
- Drums
- Other Product Types
-
By End-user Industry
-
Food
- Candy and Confectionery
- Dairy and Frozen
- Meat, Poultry and Seafood
- Other Food Types
- Beverage
- Healthcare and Pharmaceuticals
- Cosmetics and Personal Care
- Industrial Chemicals
- Building and Construction
- Other End-user Industry
-
Food
-
By Manufacturing Process
- Injection Moulding
- Blow Moulding
- Thermoforming
- Compression Moulding
- Extrusion
- Other End-user Industries
-
By Country
- United States
- Canada
- Mexico
Data Sources, Market Sizing, and Validation
Desk Research
Desk research was used to set the boundary for what counts as rigid plastic packaging and to anchor model inputs to public, repeatable data points. We reviewed official datasets and technical references such as US Census Bureau manufacturing and trade tables, Statistics Canada manufacturing shipments, the US International Trade Commission trade data, and US EPA materials and recycling publications, which helped frame resin flow and packaging-related conversion context.
To make the assumptions more realistic, company annual reports and investor presentations were checked for packaging demand commentary, capacity additions, and productivity moves, which were then cross-checked with reputable press and association publications for plastics and packaging. In a few spots, paid databases that track company financials, patent activity, and shipment-level import-export movements were used to fill gaps around conversion activity and supply chain shifts. This list is not exhaustive, and many other public sources were also used for data collection, validation, and clarification during the work.
Primary Interviews and Surveys
Primary interviews and surveys were carried out with packaging converters, resin-linked stakeholders, and buyers across food, beverage, healthcare, and household product supply chains so that assumptions could be corrected where public data was too broad. The discussion focused on pack weight trends, recycled content adoption, process mix shifts (blow molding, injection molding, thermoforming), and the way pricing and contracts move through the year across the region.
Distribution of primary research fieldwork respondents
| Company type | Respondent position |
|---|---|
| Top tier: 27% | CXOs: 13% |
| Mid tier: 57% | Functional/Unit leaders: 43% |
| Smaller Players: 16% | Managers: 44% |
Market-Sizing & Forecasting
The core model is built in volume terms (tonnes) because this market is strongly driven by pack weight, resin substitution, and lightweighting, which are easier to track in physical units than in revenue. A top-down build is first created by reconstructing packaging demand using end-use output and consumption signals, followed by adjustments for rigid packaging intensity and typical pack weights by application.
To keep the totals grounded, selective bottom-up approximations are then used as a cross-check, such as rolling up a sample of converter output capacity, process utilization ranges, and a few ASP times volume checks for representative rigid formats, with gaps handled through conservative interpolation when company-level disclosure is limited. Inputs that materially move the model include shifts in resin-to-pack conversion yields, average container weight changes driven by downgauging, the mix between bottles, tubs, trays, and closures, recycled resin availability that affects run rates, and trade flows for empty packs and related preforms.
For forecasting, scenario analysis is used to reflect the practical range of outcomes tied to consumer packaged goods volumes, sustainability mandates, and resin price pass-through behavior. The final trajectory is smoothed using simple time-series techniques where the historical curve is stable. Forecast assumptions are stress-tested with expert views so that the end numbers stay consistent with observed production and demand signals.
Data Validation & Update Cycle
Validation is done by comparing the modeled tonnes with independent checks such as manufacturing output direction, resin and packaging trade signals, and end-use consumption patterns, and then investigating any sharp variances before results are locked. Where an outlier is seen, the model is revisited for pack weight assumptions, process mix, and end-use intensity factors, and follow-up calls are triggered to confirm what changed in the market.
Before sign-off, the work passes through multi-step analyst review so that calculations, unit conversions, and assumptions are consistent across countries and end uses. Reports are refreshed annually, and interim updates are made when material events occur, such as policy shifts on recycled content, major capacity changes, or sudden demand disruptions. Right before delivery, a final review pass is completed so clients receive the most current view available at that time.
Mordor Intelligence's North America Rigid Plastic Packaging Market Size Versus Other Published Estimates
Published market sizes for rigid plastic packaging can look far apart because the unit of measure, timing, and what is counted as rigid packaging are not always aligned. In practice, differences commonly come from mixing revenue and volume, using different currency timing for price conversion, and treating closures, preforms, and industrial rigid items in inconsistent ways.
A refresh-led gap is also common because resin-linked pricing and lightweighting can move the implied value quickly even when tonnes are steady, and some estimates keep older ASPs for longer periods. The table reflects these issues, where the model refresh cadence, currency timing, and quarterly checks on pack-weight and conversion yields are used to keep the North America tonnage series internally consistent. This is why the reported spread differs in Mordor Intelligence.
Benchmark comparison
| Source | Market Size | Gaps in Research Methodology |
|---|---|---|
| Mordor Intelligence | USD 15.51 M (2025) | |
| Trade Journal A | USD 67.92 B (2024) | Reported in revenue, not tonnes, and likely applies blended regional ASPs and a different year basis, which can overstate movement when resin prices swing and pack lightweighting is not modeled explicitly. |
| Regional Consultancy B | USD 72.40 B (2026) | Uses a later base year and value-based sizing that can fold in adjacent rigid categories and apply generalized price escalation, with limited visibility on how recycled-content driven grade changes affect realized pricing. |
Across the three figures, the biggest driver is not demand alone. It is mainly how units and pricing are treated over time. By keeping the market in tonnes and validating the curve against process and end-use signals each refresh cycle, the estimate stays traceable to repeatable inputs instead of being pushed mainly by assumed ASP growth.


Key Questions Answered in the Report
How large is the North America rigid plastic packaging market in 2026?
It stands at 15.84 million tonnes and is forecast to reach 17.58 million tonnes by 2031.
Which resin grows fastest in regional rigid packaging?
Polyethylene terephthalate leads with a 3.72% CAGR through 2031, driven by recycled-content mandates.
Why are caps and closures attracting investment?
They post the highest 3.1% CAGR as brand owners demand tamper evidence, child resistance, and smart features.
What drives Mexico’s rapid demand growth?
Expanding food processing capacity and middle-class consumption lift rigid container usage at a 4.05% CAGR.
How are converters improving margins?
AI-enabled vision systems cut scrap up to 20%, boosting equipment effectiveness and reducing material waste.
Which end-user segment shows premium growth?
Healthcare and pharmaceuticals climb at 4.74% CAGR due to stringent quality norms and biologics expansion.
Page last updated on:





