Piezoelectric Energy Harvesting Market Size and Share
Market Overview
| Study Period | 2019 - 2030 |
|---|---|
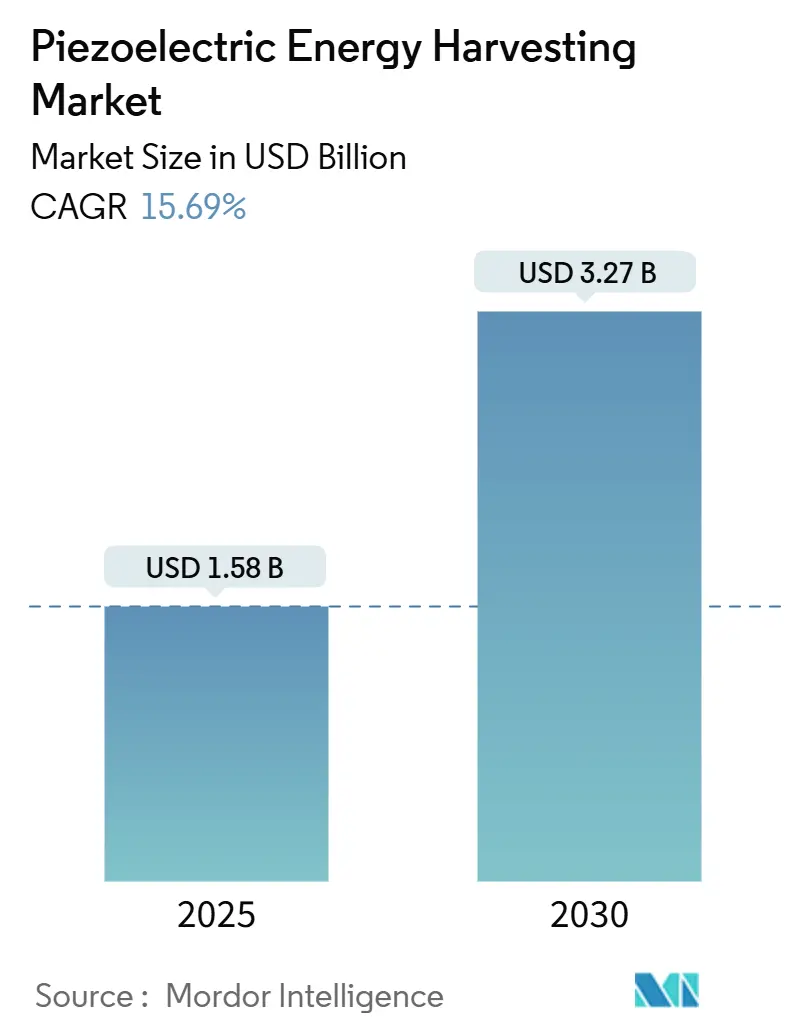
| Market Size (2025) | USD 1.58 Billion |
| Market Size (2030) | USD 3.27 Billion |
| Growth Rate (2025 - 2030) | 15.69% CAGR |
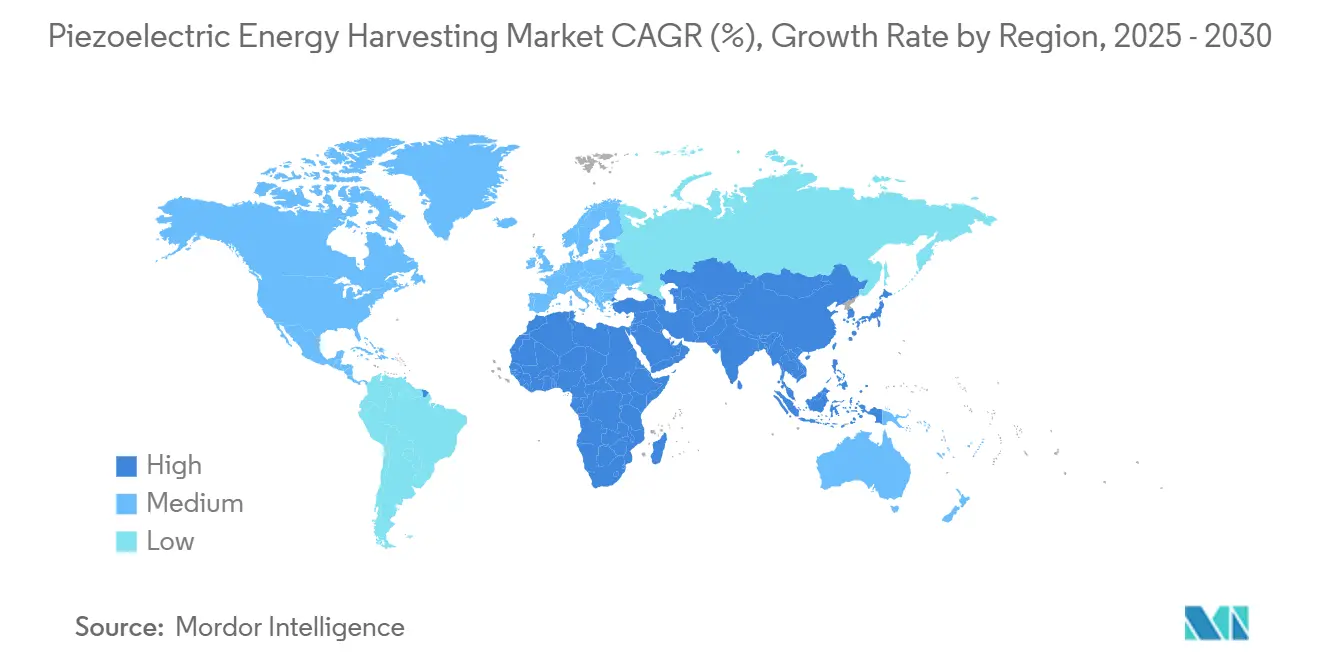
| Fastest Growing Market | Asia Pacific |
| Largest Market | Asia Pacific |
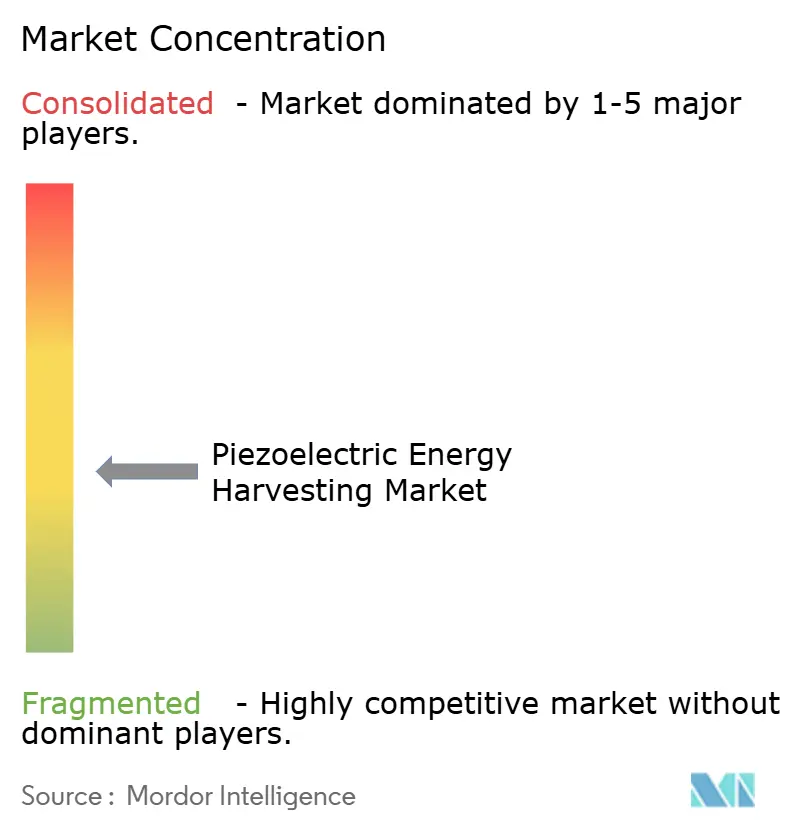
| Market Concentration | Medium |
Major Players *Disclaimer: Major Players sorted in no particular order Image © Mordor Intelligence. Reuse requires attribution under CC BY 4.0. | |
Piezoelectric Energy Harvesting Market Analysis by Mordor Intelligence
The Piezoelectric Energy Harvesting Market size is estimated at USD 1.58 billion in 2025, and is expected to reach USD 3.27 billion by 2030, at a CAGR of 15.69% during the forecast period (2025-2030).
Expansion aligns with rising demand for battery-free sensors, breakthroughs in scandium-doped aluminum nitride thin films, and stricter sustainability targets that encourage the replacement of disposable batteries with energy-autonomous devices. Producers of materials, components, and complete modules are scaling capacity to serve fast-growing consumer electronics, industrial monitoring, and smart infrastructure projects. Technology, synergized with 5G connectivity, edge computing, and AI-enabled power management, amplifies adoption by ensuring reliable micro-watt to milli-watt outputs in diverse vibration environments. Regulatory limits on lead ceramics and concerns about scandium sourcing pose challenges, yet they also stimulate innovation in lead-free ceramics and recycling pathways that diversify supply and improve environmental profiles.
Key Report Takeaways
- By material type, ceramics held 66.8% of the piezoelectric energy harvesting market share in 2024, while polymers are projected to expand at a 17.7% CAGR through 2030.
- By component, transducers captured 62.5% of the piezoelectric energy harvesting market size in 2024, while power-management ICs are poised to grow at an 18.5% CAGR through 2030.
- By application, consumer electronics and wearables led with 36.2% revenue in 2024; aerospace and defense applications are forecast to grow at 19.2% CAGR between 2025-2030
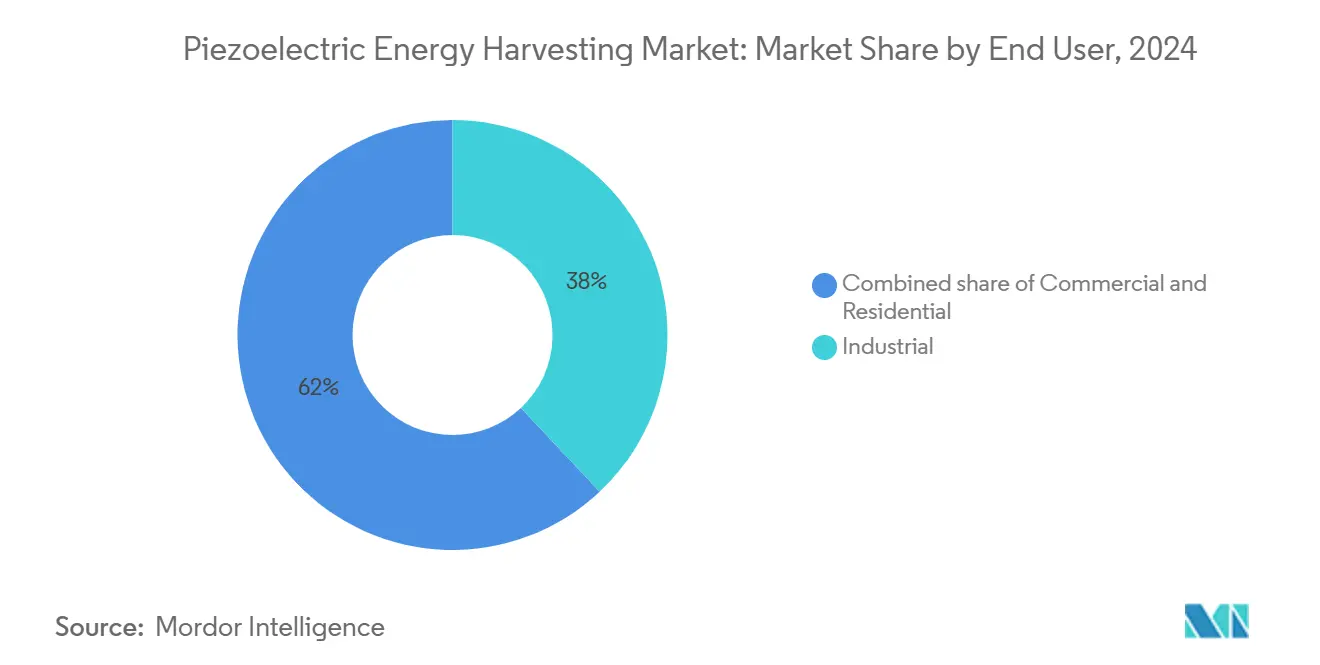
- By end user, industrial enterprises accounted for 38.0% of the piezoelectric energy harvesting market share in 2024, while commercial buildings are advancing at an 18.1% CAGR to 2030
- Asia-Pacific commanded 40.3% of global revenue in 2024 and is set to register a 17.3% CAGR, making it both the largest and fastest-growing regional opportunity
Global Piezoelectric Energy Harvesting Market Trends and Insights
Drivers Impact Analysis*
| Driver | (~) % Impact on CAGR Forecast | Geographic Relevance | Impact Timeline |
|---|---|---|---|
| IoT sensor proliferation | 3.20% | Global, led by Asia-Pacific | Medium term (2-4 years) |
| Flexible PVDF for wearables | 2.80% | North America & Europe | Short term (≤ 2 years) |
| Industrial asset monitoring mandates | 2.10% | Global, regulations in EU & North America | Long term (≥ 4 years) |
| Roadway harvesters (smart highways) | 1.90% | Asia-Pacific, European Union | Long term (≥ 4 years) |
| ScAlN thin-film breakthroughs | 2.40% | Global, fabrication in Asia-Pacific | Medium term (2-4 years) |
| Airport baggage power tiles | 1.10% | Global aviation hubs | Medium term (2-4 years) |
| Source: Mordor Intelligence | |||
IoT Sensor Proliferation
Global shipments of ambient IoT devices are projected to hit 1.1 billion units by 2030, creating sustained demand for energy-autonomous sensors.[1]IoT Now, “Ambient IoT Device Forecast to 2030,” iotnow.com Piezoelectric harvesters are suitable for industrial sites where replacing batteries is hazardous or costly, and 5G-edge architectures support ultra-low-power duty cycles that match the harvested energy. Hybrid modules combining thermoelectric and piezoelectric elements have demonstrated a more than 50% higher power output than single-source systems, allowing sensors to remain operational in mixed heat-vibration environments.[2]Science X, “Hybrid Thermo-Piezo Systems Boost Output,” phys.org Adaptive power management firmware enables devices to adjust their sampling frequency in accordance with available energy, thereby improving uptime without requiring manual intervention.
Flexible PVDF for Wearables
Advances in polyvinylidene fluoride nanocomposites have lifted piezoelectric coefficients to 15-19 pm/V while tolerating 40% mechanical strain, outpacing the flexibility of rigid ceramics. Carbon-infused PVDF films unite energy harvesting with strain sensing, enabling multifunctional garments and medical patches. Three-dimensional stretchable PZT architectures now achieve 280-fold efficiency gains compared with planar organic layers, supplying practical milli-watt levels to smart shirts and fitness trackers. Inkjet printing of P(VDF-TrFE) on polyimide cuts production costs and supports design personalization for niche wearable categories.
Industrial Asset Monitoring Mandates
The Petroleum Safety Authority Norway requires continuous structural health data on offshore facilities, explicitly citing battery-free piezoelectric sensors for multi-year deployment. Integration with narrowband IoT transports data from hazardous zones where wired power is unavailable. Vibration harvesters that meet ISO 10816 standards operate in refineries, eliminating the need for battery swaps and supporting predictive maintenance analytics. Digital twins synchronize with live, self-powered sensor streams, refining machine-learning models that forecast failures and optimize maintenance windows.
Roadway Harvesters (Smart Highways)
Pilot highways embed multilayer piezoelectric stacks that convert traffic loads into energy and real-time pavement data. A University of California, Merced prototype produced 333 W per square foot, implying 150 kW per kilometer for large-scale deployments.[3]University of California Merced, “High-Power Density Roadway Harvesters,” ucmerced.edu California’s lane network could reduce CO₂ emissions by 115 million metric tons annually if such harvesters power signage and sensor nodes. Compression-based PZT-5H units have delivered 0.8-3 mW per transducer in field tests, and modular assemblies scale output for roadway lighting and connected-vehicle beacons.
Restraints Impact Analysis*
| Restraint | (~) % Impact on CAGR Forecast | Geographic Relevance | Impact Timeline |
|---|---|---|---|
| Non-resonant efficiency losses | −2.1% | Global | Short term (≤ 2 years) |
| Competing PV / RF harvesters | −1.8% | Global | Medium term (2-4 years) |
| Lead-ceramic disposal rules | −1.4% | EU & North America | Long term (≥ 4 years) |
| Scandium supply bottleneck | −1.7% | Global manufacturing regions | Medium term (2-4 years) |
| Source: Mordor Intelligence | |||
Non-Resonant Efficiency Losses
Piezoelectric harvesters lose output when ambient vibrations deviate from resonance, limiting returns in variable-frequency environments.[4]Journal of the Acoustical Society of America, “Non-Resonant Piezoelectric Efficiency,” acousticalsociety.org Impedance matching complexities further attenuate energy transfer. Specialized PMICs with maximum power point tracking narrow the gap yet remain bound by material physics. Multi-beam nonlinear arrays increase the harvestable bandwidth to 25-40 Hz, producing 35 mW, which is 3.24 times more than single-frequency strips, but still fall short of theoretical ceilings.
Competing PV / RF Harvesters
RF rectifiers now achieve 31.1% conversion efficiency at −20 dBm and 62.4% at −10 dBm, challenging piezo solutions in indoor IoT applications. Spin-rectifier diodes push zero-bias sensitivity to 34,500 mV/mW, expanding the usable electromagnetic spectrum. Ultra-flexible photovoltaics achieve over 16% power conversion and fold seamlessly into wearables, crowding out applications that once relied on piezoelectric generation. Hybrid harvesters bundle PV, RF, and thermal capture, diluting reliance on mechanical energy.
*Our forecasts treat driver/restraint impacts as directional, not additive. The impact forecasts reflect baseline growth, mix effects, and variable interactions.
Segment Analysis
By Material Type: Ceramics Dominate, Polymers Accelerate
Ceramics captured 66.8% of the piezoelectric energy harvesting market share in 2024, propelled by mature lead zirconate and barium titanate platforms that deliver high electromechanical coupling for aerospace and industrial machinery. However, the piezoelectric energy harvesting market size for polymers is projected to grow at a 17.7% CAGR as PVDF and P(VDF-TrFE) gain traction in wearables that demand flexibility and biocompatibility. Lead-free KNN ceramics offer d33 values exceeding 4,000 pC/N, complying with tightening disposal regulations while maintaining performance.
Polymer nanocomposites integrate carbon nanotubes to achieve mechanical stretchability and multifunctional sensing, thereby widening the end-use cases for healthcare patches and flexible IoT tags. Composite segments, although still niche, utilize macro fiber composites in carbon fiber structures to maximize vibration capture in aircraft wings and wind turbine blades, demonstrating how multifunctional design unlocks new revenue streams within the piezoelectric energy harvesting market.
By Component: Transducers Lead, Power Management Gains Pace
Transducers held 62.5% of the piezoelectric energy harvesting market size in 2024, representing the core energy conversion element in every deployment. Performance improvements in 3-D stretchable PZT structures drive miniaturization and elevate energy density, supporting medical implants and smart textiles. Power-management ICs are expected to show the fastest expansion at an 18.5% CAGR, integrating voltage boost, storage control, and adaptive impedance matching to optimize yield across unpredictable vibration profiles.
Energy storage modules such as thin-film micro-batteries and supercapacitors remain the smallest component slice yet play a critical reliability role. Closed-loop converters that adjust in real time under variable wind-induced loads underscore system-level innovation that differentiates suppliers in the piezoelectric energy harvesting market.


By Application: Volume Consumer Devices Meet High-Value Aerospace
Consumer electronics and wearables led the revenue growth with 36.2% in 2024, leveraging a high production scale for smartphones, wireless earbuds, and smartwatches that benefit from extended battery life. The aerospace and defense sector is expected to register a 19.2% CAGR to 2030, illustrating customers' premium on maintenance-free sensors in aircraft fuselage monitoring, satellite health systems, and soldier-worn electronics.
Due to mandated predictive maintenance in refineries and manufacturing plants, industrial machinery monitoring remains a robust segment. Healthcare utilizes self-powered implants for hearing restoration and bone growth stimulation, while civil infrastructure incorporates piezoelectric arrays in bridges and skyscrapers for real-time damage detection. Each niche contributes to incremental growth in the piezoelectric energy harvesting market.
By End User: Industrial Base Sustains, Commercial Buildings Accelerate
Industrial users accounted for 38.0% of the piezoelectric energy harvesting market share in 2024 as the sector adopted autonomous sensors to track machine health in remote and hazardous sites. The return on investment is clear because battery swaps disrupt operations and increase safety costs. Commercial facilities are forecasted to grow at a 18.1% CAGR, spurred by smart-building codes that mandate continuous monitoring of occupancy, air quality, and structural integrity without requiring wiring or battery maintenance.
Residential uptake remains modest yet promising as smart home platforms integrate self-powered sensors for windows, doors, and appliances. Cross-sector IoT ecosystems blur boundaries, allowing technology designed for factories to migrate into offices and homes, reinforcing network effects and supporting sustained expansion of the piezoelectric energy harvesting market.
Geography Analysis
Asia-Pacific commanded 40.3% of global revenue in 2024 and is expected to grow at a 17.3% CAGR, combining cost-competitive manufacturing with concentrated scandium supplies that underpin ScAlN devices. China maintains leadership in consumer electronics assembly, while Japan and South Korea contribute high-precision component expertise, particularly in automotive advancements from TDK and Murata. National initiatives, such as Made in China 2025 and Korea’s Digital New Deal, prioritize smart factories, thereby widening procurement pipelines for vibration and structural health sensors.
North America ranks second in revenue, buoyed by strong demand in the aerospace and defense sectors and large-scale IoT rollouts across the oil, gas, and utilities industries. Domestic scandium production in Quebec aims to mitigate supply risk, and federal infrastructure bills allocate funding for smart highways that integrate piezoelectric harvesters. Venture capital engagement through programs like ADVentures adds financial momentum that accelerates commercialization.
Europe records steady growth through aggressive sustainability and circular-economy legislation that penalize battery waste. Automotive electrification and building energy directives promote the adoption of lead-free piezoelectric devices. Research consortia connect universities and industry to develop low-temperature KNN processing and recyclable composites. South America, the Middle East & Africa show emerging opportunities tied to road modernization and renewable power grids, though funding constraints and limited local supply chains temper market penetration.

Competitive Landscape
The piezoelectric energy harvesting market remains moderately fragmented. Electronics majors such as TDK Corporation, Murata Manufacturing, and Analog Devices integrate material science and semiconductor design to secure broad portfolios ranging from ScAlN wafers to PMICs. TDK’s 2024 showcase of piezoelectric MEMS mirrors and ultrasonic lens cleaners underscores its push into automotive driver assistance. Murata’s partnership with Synaptics brings energy-harvesting wireless modules to connected vehicles, highlighting the value of cross-domain collaborations.
Startups concentrate on niche breakthroughs, including high-temperature ceramics for hypersonic platforms and airport piezoelectric tiles. Intellectual property around ScAlN deposition and MEMS packaging forms tangible barriers for new entrants. Meanwhile, supply chain vulnerabilities for scandium prompt alliances with mining companies to secure long-term access to materials. Patent cross-licensing and co-development agreements are common as firms rush to integrate self-powered features into next-generation IoT, aerospace, and medical devices.
Piezoelectric Energy Harvesting Industry Leaders
Murata Manufacturing Co., Ltd.
TDK Corporation
Analog Devices Inc.
CTS Corporation
Mide Technology Corporation
- *Disclaimer: Major Players sorted in no particular order

Recent Industry Developments
- June 2025: Analog Devices launched ADVentures, a venture fund for climate and energy startups.
- March 2025: Researchers reported a 250% boost in ScAlN modulus via thermal annealing to 45.5 pC/N.
- February 2025: JetWind Power installed aircraft wind-capture pods at Dallas Love Field Airport, each yielding 50-80 kWh daily.
- January 2025: Synaptics and Murata unveiled automotive wireless modules with embedded energy harvesting.


Global Piezoelectric Energy Harvesting Market Report Scope
| Ceramics (PZT, BaTiO?, PMN-PT) |
| Polymers (PVDF, PVDF-TrFE, PLLA) |
| Composites and Nanocomposites (MFC, ZnO, Graphene) |
| Piezoelectric Transducer |
| Power-Management IC |
| Energy-Storage Unit (Super-caps / ?-batteries) |
| Consumer Electronics and Wearables |
| Industrial Machinery Monitoring |
| Automotive (ICE and EV) |
| Healthcare Devices and Implants |
| Aerospace and Defense |
| Civil Infrastructure and Smart Buildings |
| Industrial |
| Commercial |
| Residential |
| North America | United States |
| Canada | |
| Mexico | |
| Europe | Germany |
| United Kingdom | |
| France | |
| Italy | |
| NORDIC Countries | |
| Russia | |
| Rest of Europe | |
| Asia-Pacific | China |
| India | |
| Japan | |
| South Korea | |
| ASEAN Countries | |
| Rest of Asia-Pacific | |
| South America | Brazil |
| Argentina | |
| Rest of South America | |
| Middle East and Africa | Saudi Arabia |
| United Arab Emirates | |
| South Africa | |
| Egypt | |
| Rest of Middle East and Africa |
| By Material Type | Ceramics (PZT, BaTiO?, PMN-PT) | |
| Polymers (PVDF, PVDF-TrFE, PLLA) | ||
| Composites and Nanocomposites (MFC, ZnO, Graphene) | ||
| By Component | Piezoelectric Transducer | |
| Power-Management IC | ||
| Energy-Storage Unit (Super-caps / ?-batteries) | ||
| By Application | Consumer Electronics and Wearables | |
| Industrial Machinery Monitoring | ||
| Automotive (ICE and EV) | ||
| Healthcare Devices and Implants | ||
| Aerospace and Defense | ||
| Civil Infrastructure and Smart Buildings | ||
| By End User | Industrial | |
| Commercial | ||
| Residential | ||
| By Geography | North America | United States |
| Canada | ||
| Mexico | ||
| Europe | Germany | |
| United Kingdom | ||
| France | ||
| Italy | ||
| NORDIC Countries | ||
| Russia | ||
| Rest of Europe | ||
| Asia-Pacific | China | |
| India | ||
| Japan | ||
| South Korea | ||
| ASEAN Countries | ||
| Rest of Asia-Pacific | ||
| South America | Brazil | |
| Argentina | ||
| Rest of South America | ||
| Middle East and Africa | Saudi Arabia | |
| United Arab Emirates | ||
| South Africa | ||
| Egypt | ||
| Rest of Middle East and Africa | ||


Key Questions Answered in the Report
What is the forecast value of the piezoelectric energy harvesting market by 2030?
The sector is projected to reach USD 3.27 billion by 2030, growing at a 15.69% CAGR.
Which region leads growth in piezoelectric energy harvesting?
Asia-Pacific leads both size and growth, holding 40.3% share in 2024 and set for a 17.3% CAGR to 2030.
Which material segment grows fastest in this field?
Polymers, especially advanced PVDF formulations, are expected to expand at 17.7% CAGR through 2030.
What application shows the highest growth potential?
Aerospace and defense deployments are forecast to rise at a 19.2% CAGR, outperforming other segments.
How do regulatory trends impact ceramic materials?
Stricter lead disposal rules in the EU and North America motivate the shift toward lead-free alternatives such as potassium sodium niobate.
Why are power-management ICs gaining traction?
Sophisticated ICs optimize harvested energy through adaptive impedance matching and boost conversion, enabling reliable operation across variable vibration frequencies.
Page last updated on:


