
Physical AI In Manufacturing and Logistics Market Size and Share
Market Overview
| Study Period | 2021 - 2032 |
|---|---|
| Market Size (2027) | USD 37.21 Billion |
| Market Size (2032) | USD 88.01 Billion |
| Growth Rate (2027 - 2032) | 18.79 % |
| Fastest Growing Market | North America |
| Largest Market | Asia-Pacific |
| Market Concentration | Medium |
Major Players *Disclaimer: Major Players sorted in no particular order Image © Mordor Intelligence. Reuse requires attribution under CC BY 4.0. | |
Physical AI In Manufacturing and Logistics Market Analysis by Mordor Intelligence
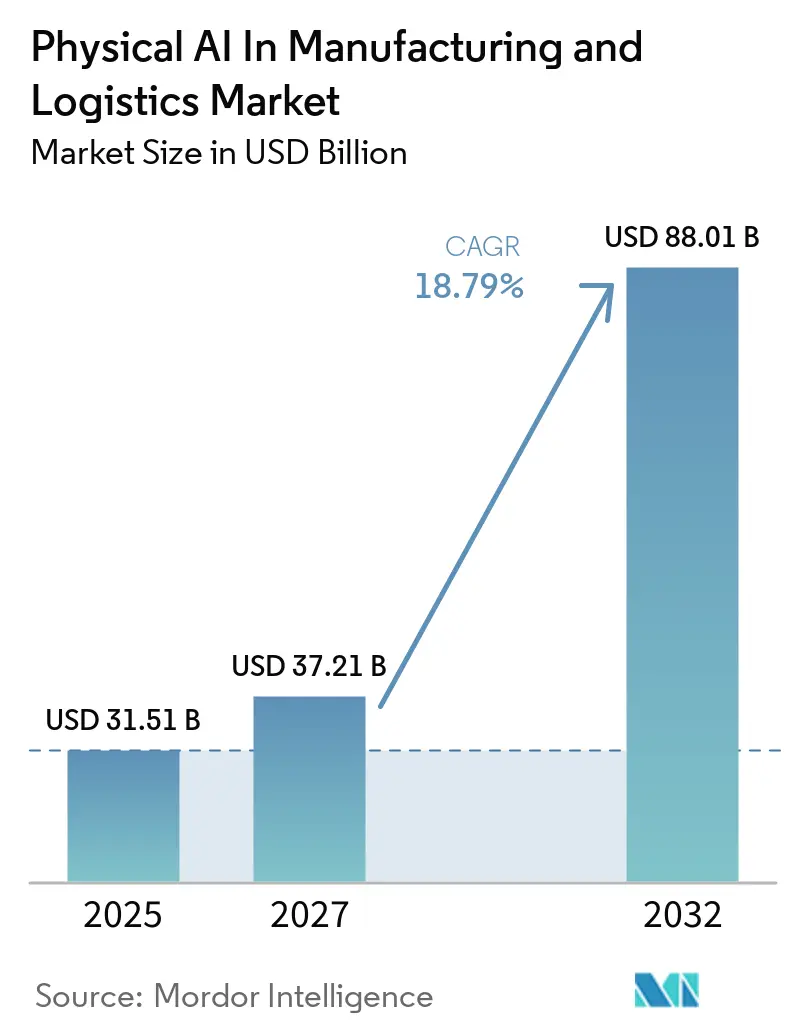
The physical AI in manufacturing and logistics market size is expected to increase from USD 31.51 billion in 2026 to reach USD 88.01 billion by 2032, expanding at a CAGR of 18.79% over 2027-2032. The physical AI in manufacturing and logistics market is being shaped by persistent labor shortages, faster fulfillment expectations, and investment in domestic production capacity, with each factor increasing the need to complete work reliably in changing operating conditions. Robots are moving beyond fixed motions because edge-based models can interpret changing conditions and support more flexible work. This shift gives manufacturers and logistics operators more options to automate tasks that were previously difficult to standardize, widening the potential use cases for the physical AI in the manufacturing and logistics market across production, material movement, picking, inspection, and related handling activities. The physical AI in manufacturing and logistics market also benefits from simulation tools that shorten development and testing cycles. Capital requirements, compliance work, and data gaps in unusual operating conditions remain significant barriers to adoption, especially for companies that must introduce new technology without disrupting established production or distribution operations.
Key Report Takeaways
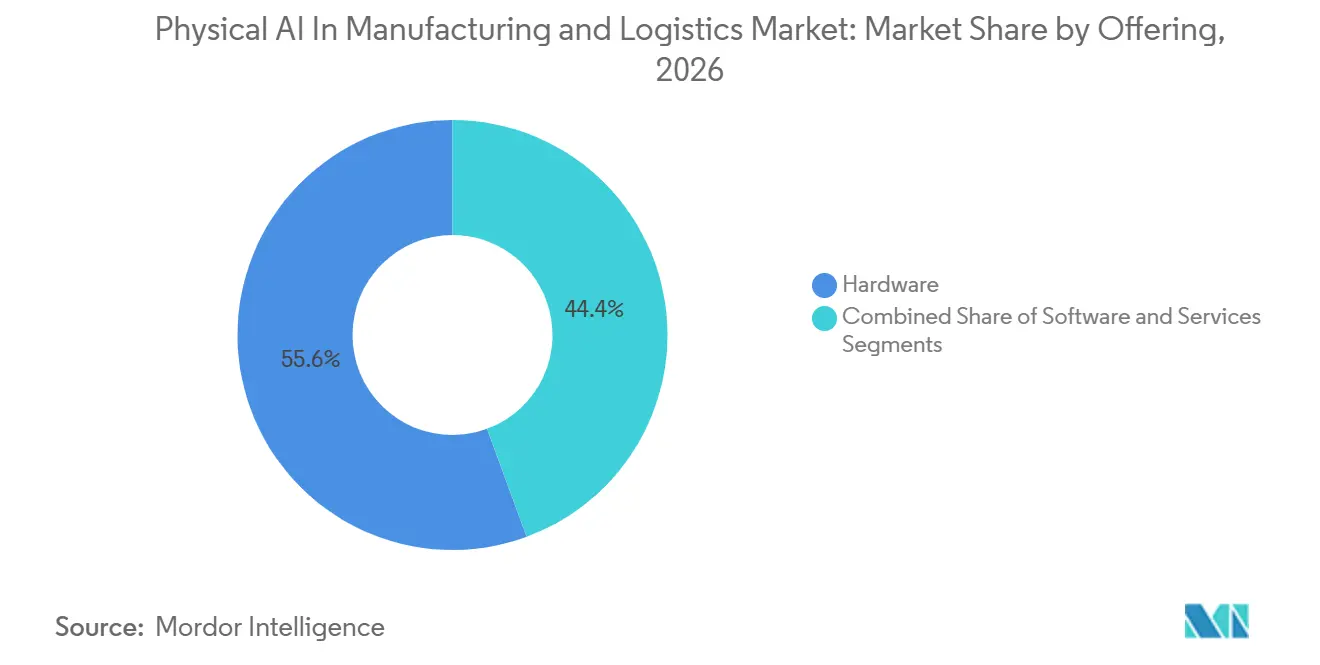
- By offering, hardware held 55.61% of the physical AI market share in the manufacturing and logistics market in 2026, while software is projected to expand at a 19.76% CAGR through 2032.
- By robot form factor, autonomous mobile robots held 27.88% revenue share in 2026, while mobile manipulators are projected to expand at a 20.13% CAGR through 2032.
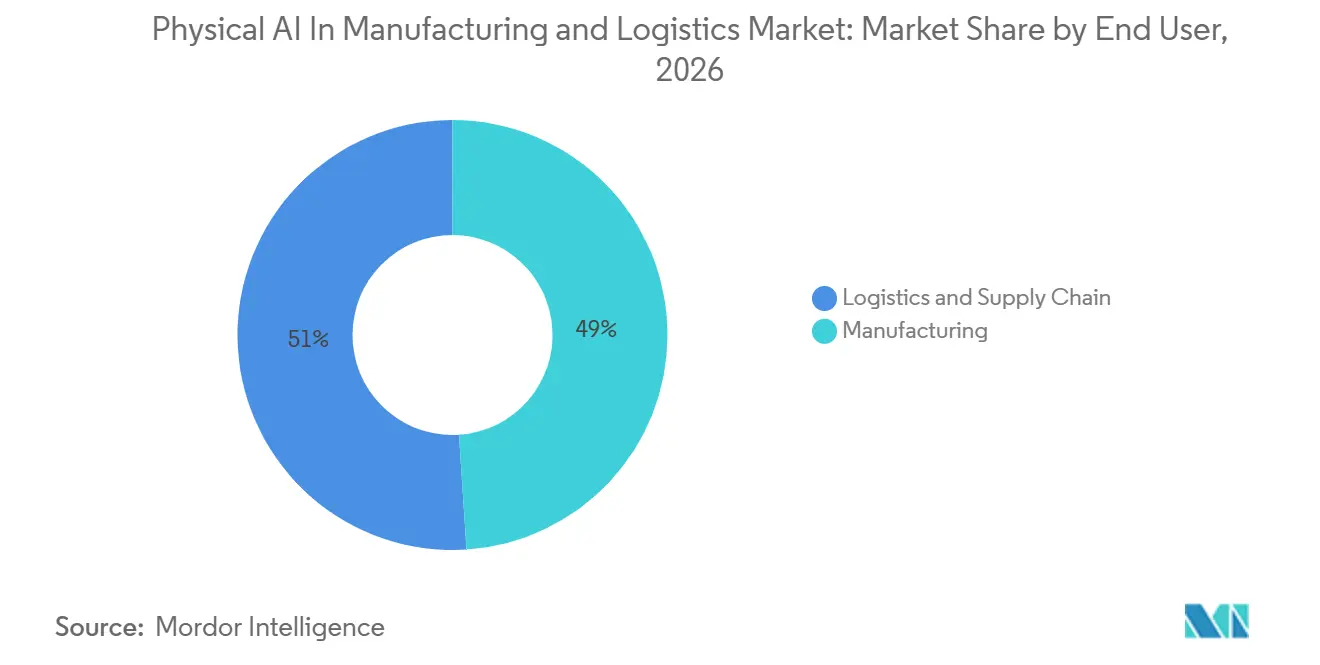
- By end user, manufacturing held a 48.96% revenue share in 2026, while logistics and supply chain are projected to expand at a 20.79% CAGR through 2032 in the physical AI market for manufacturing and logistics.
- By technology layer, execution and control held 39.78% revenue share in 2026, while decision-making and learning are projected to expand at a 19.59% CAGR through 2032.
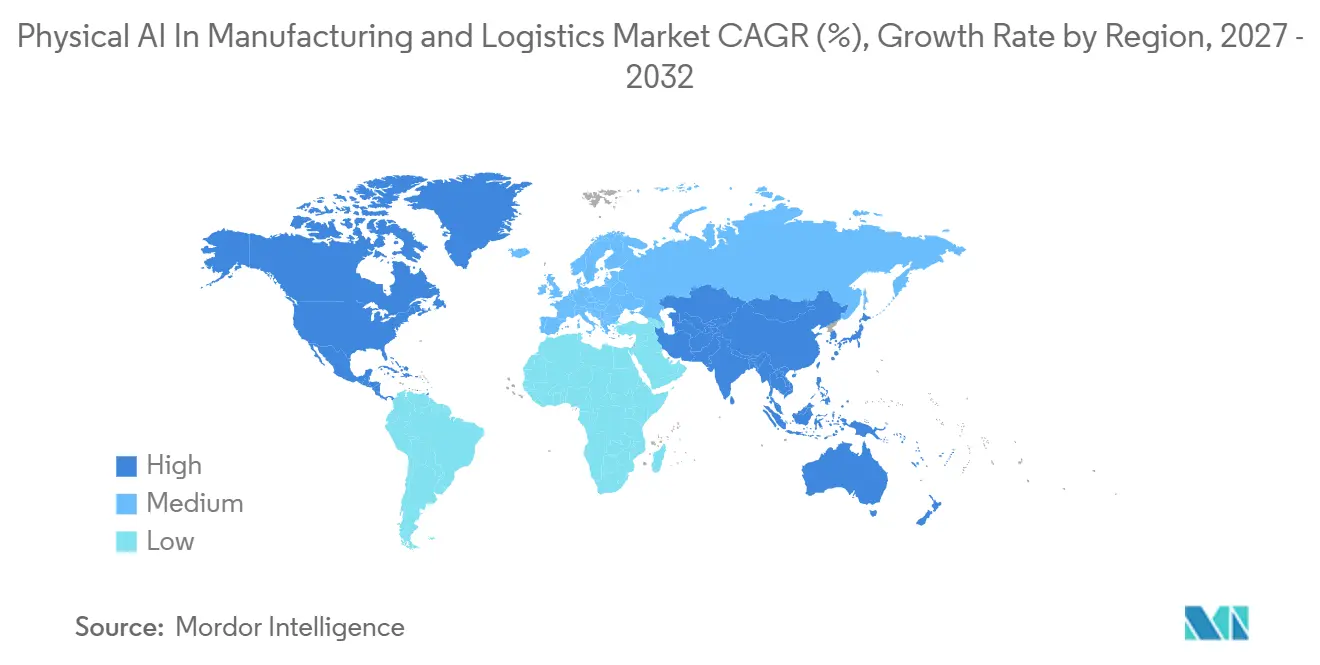
- By geography, Asia-Pacific held 28.55% revenue share in 2026, while North America is projected to expand at a 20.14% CAGR through 2032 in the physical AI in manufacturing and logistics market.
Note: Market numbers in this report are based on Mordor Intelligence's proprietary estimation framework, which combines nine months of actuals with Q4 projections for base year 2026.
Global Physical AI In Manufacturing and Logistics Market Trends and Insights
Drivers Impact Analysis*
| DRIVER | (~) % IMPACT ON CAGR FORECAST | GEOGRAPHIC RELEVANCE | IMPACT TIMELINE |
|---|---|---|---|
| Labor Shortages and Rising Labor Costs | +3.2% | Global, the highest intensity in North America, Japan, and Germany | Short term (≤ 2 years) |
| E-Commerce and Same-Day Fulfillment Pressure | +2.8% | North America and the Asia-Pacific core, with spill-over to Europe | Short term (≤ 2 years) |
| AI-Enabled Vision, Sensor Fusion, and Edge Computing | +2.5% | Global, with technology leadership in North America and Asia-Pacific | Medium term (2-4 years) |
| Reindustrialization and Nearshoring | +2.2% | North America and Europe, with pull-through to Mexico and Eastern Europe | Medium term (2-4 years) |
| Simulation-to-Reality Transfer Through Digital Twins | +1.5% | Global, accelerating fastest in Japan, South Korea, and the U.S. automotive hubs | Medium term (2-4 years) |
| Brownfield Fleet Orchestration Across Mixed Robot Fleets | +1.2% | North America and Europe, with early adoption in Asia-Pacific megafacilities | Long term (≥ 4 years) |
| Source: Mordor Intelligence | |||
Labor Shortages and Rising Labor Costs
Structural workforce shortages are creating a direct case for automation across factories and distribution centers. The U.S. Bureau of Labor Statistics recorded 529,000 unfilled manufacturing job openings in May 2026, a 31.9% increase from the prior year.[1] U.S. industrial robot installations reached 38,500 units in 2025, 12% higher than in 2024, as labor availability and automation investment moved in tandem.[2] Physical AI in the manufacturing and logistics market can help employers maintain output when recruiting and retention remain difficult, particularly in roles that combine repetitive movement, material handling, inspection, and time-sensitive production work. An older manufacturing workforce and a smaller pipeline of younger workers also increase the value of systems that can handle repetitive or physically demanding tasks, allowing experienced employees to focus on oversight, troubleshooting, quality, and judgment-based work.
E-Commerce and Same-Day Fulfillment Pressure
Shorter delivery windows are changing the economics of warehouse automation. Geekplus reported that signed orders in the Americas increased by more than 50% year over year in 2025, showing continued buyer interest in flexible fulfillment systems. Amazon announced an investment of at least EUR 10 billion (USD 11.4 billion) to modernize its European fulfillment network with robotics. Symbotic reported USD 721 million in third-quarter fiscal 2026 revenue, 22% higher year over year, and 77 active systems. The physical AI in the manufacturing and logistics market is therefore increasingly tied to throughput density, not only to task automation, because facilities must manage the flow of goods across receiving, storage, picking, packing, and dispatch without delaying service or creating bottlenecks in adjacent work areas. Existing cold-chain and grocery facilities are also examining automation because capacity constraints cannot always wait for new sites to be built, and these operations must meet product-handling requirements while increasing speed and order accuracy.
AI-Enabled Vision, Sensor Fusion, and Edge Computing
Production-ready vision, sensor fusion, and edge inference are making physical AI easier to specify in procurement plans. NVIDIA stated in March 2026 that ABB Robotics, FANUC, YASKAWA, and KUKA were integrating Omniverse, Isaac, Cosmos, and Jetson technologies into development and production workflows. These suppliers together operate an installed base exceeding 2 million robots, which gives such tools broad access to industrial environments and enables development practices to be shared across users with different facilities, production processes, product mixes, technical capabilities, and levels of prior automation.[3] Japanese robotics and manufacturing companies, including OMRON and Hitachi, are also applying Cosmos models to factory vision work. The physical AI in manufacturing and logistics market gains when a robot can process information locally and react without a fixed sequence for every condition, which is important when lighting, object placement, packaging, or work priorities change during an operating shift. Simulation-first workflows can also reduce the gap between development, virtual commissioning, and on-site use by allowing teams to identify integration issues before a production asset is taken offline.
Reindustrialization and Nearshoring
Investment in domestic and regional production is adding a policy-related demand base for industrial automation, especially where supply-chain resilience and domestic production capacity are part of operational planning. The Reshoring Initiative reported that 63% of original equipment manufacturers planned U.S. capital expenditure in 2026 or 2027 for reshoring or domestic expansion.[4] Its 2026 survey also found that 36% of original equipment manufacturers had reshored or were actively reshoring, compared with 29% in 2025. This activity simultaneously directs attention to production capacity, supplier resilience, and labor availability. The physical AI in the manufacturing and logistics market benefits when new facilities are designed for automation, and older sites need higher output without equivalent increases in headcount. The result is demand across robot hardware, integration services, simulation, and fleet management rather than a single equipment purchase, because users need a system that fits existing processes, staffing plans, information systems, and safety procedures.
Restraints Impact Analysis*
| RESTRAINT | (~) % IMPACT ON CAGR FORECAST | GEOGRAPHIC RELEVANCE | IMPACT TIMELINE |
|---|---|---|---|
| High Upfront Cost and Uncertain ROI | -3.5% | Global, most pronounced in mid-market manufacturers in North America, Europe, and India | Short term (≤ 2 years) |
| Safety, Standards, and Cybersecurity Requirements | -2.0% | Global, with the highest compliance burden in Europe and Japan under the EU Machinery Regulation 2023/1230 and ISO 10218-1 and 10218-2 | Medium term (2-4 years) |
| Long-Tail Data Scarcity for Rare Physical Edge Cases | -1.8% | Global, with the bottleneck most acute for generalist manipulation policy developers | Medium term (2-4 years) |
| OT Changeover and Robot Downtime Risk From Model Updates | -1.2% | North America and EU industrial centers with dense legacy OT infrastructure | Long term (≥ 4 years) |
| Source: Mordor Intelligence | |||
High Upfront Cost and Uncertain ROI
Capital intensity remains the clearest barrier to first deployments across facilities and operating sites. Fully automated fulfillment installations can require USD 20 million to USD 50 million per facility, based on disclosed industry spending. Robotics-as-a-service offers another purchasing path because it shifts part of the cost from a single capital purchase to recurring payments, which can make budgets more manageable but still requires confidence in the provider's performance and support. Agility Robotics offers Digit through a per-robot subscription model, while Maven Robotics charges for completed task cycles rather than hardware units. Mid-sized manufacturers have fewer locations over which to spread integration, training, and maintenance costs. The physical AI in manufacturing and logistics market will depend in part on whether vendors can provide clearer operating results and lower-risk commercial models for these buyers, including better visibility on integration effort, utilization, maintenance, payback, training needs, service levels, and the operational responsibility held by each party.
Safety, Standards, and Cybersecurity Requirements
AI-enabled robots must pass a higher deployment threshold when they share workspaces with people, since users must understand how the system will respond to movement, unexpected objects, equipment changes, and other conditions on the floor. ISO published ISO 10218-1 and ISO 10218-2 in July 2025, adding cybersecurity clauses and Class I and Class II functional safety classifications. The related harmonized standard under EU Machinery Regulation 2023/1230 remained pending in 2026, leaving suppliers to manage parallel compliance demands. AI systems whose behavior is not fully fixed at design time do not readily align with established IEC 61508 safety life-cycle methods. Agility Robotics reported that Digit completed an independent OSHA field evaluation on a live production line and that the company is contributing to ISO 25785-1 work. The physical AI in manufacturing and logistics market will face longer sales and implementation cycles until standards are more widely applied in operating environments and customers can evaluate safety, cybersecurity, validation, and responsibility using more consistent procedures.
*Our forecasts treat driver/restraint impacts as directional, not additive. The impact forecasts reflect baseline growth, mix effects, and variable interactions.
Segment Analysis
By Offering: Software's Rise Reshapes Value Distribution
Hardware is projected to hold 55.61% of the physical AI in manufacturing and logistics market share in 2026. Robot platforms, compute modules, and sensor arrays remain the primary commercial entry points for many buyers. Automotive, electronics, and semiconductor producers are expected to support hardware demand through large procurement programs that require reliable equipment, commissioning, maintenance, and established supplier support. The physical AI in manufacturing and logistics market size attributable to hardware reflects the capital required to establish a functional automation base. Services for integration, maintenance, and managed operations are also becoming increasingly important, as they help users operate new systems with fewer internal resources and provide ongoing post-installation support.
Software is projected to expand at a CAGR of 19.76% through 2032. AI model subscriptions, fleet orchestration platforms, and simulation-as-a-service tools can scale independently of robot shipments. Generalist manipulation policies trained in simulation and refined using operational data may also retain value longer than the equipment they control. These factors support recurring-revenue models for companies such as Physical Intelligence and Covariant. According to THECVF.COM, a CVPR 2026 paper on cross-embodiment learning is expected to demonstrate how human-object interaction data can be adapted into training datasets for different robot form factors. These data pipelines are making software and training data increasingly central to the commercial structure of physical AI in the manufacturing and logistics industries.

By Robot Form Factor: Mobile Manipulators Redefine Dexterous Automation
Autonomous mobile robots are projected to account for 27.88% of the physical AI market share in the manufacturing and logistics market in 2026. More than a decade of deployments has established navigation systems and expanded warehouse use cases. These robots move materials across warehouses and factory floors without fixed pathways, while industrial arms perform precision tasks and collaborative robots support work near human employees. Automated guided vehicles remain suitable for structured material movement, whereas humanoids and quadrupeds remain at an earlier stage of commercialization within the other robot form factor category.
Mobile manipulators are projected to expand at a CAGR of 20.13% through 2032. Their combination of mobility and articulated arms supports material sequencing, machine tending, tote handling, and pick-and-place tasks that fixed arms and autonomous mobile robots cannot perform independently. Pilot deployments in automotive and consumer goods environments are strengthening the business case for systems that can move to a task and perform it. Maven Robotics is expected to emerge from stealth in September 2026 with a USD 100 million Series A funding round and introduce a dual-arm, wheeled mobile manipulator for mixed-case palletizing and tote handling. The physical AI in manufacturing and logistics market is expected to use these designs to extend automation into less structured workflows.
By End User: Logistics Growth Challenges Manufacturing's Dominance
Manufacturing is projected to hold 48.96% of the physical AI in manufacturing and logistics market share in 2026. Automotive, electrical and electronics, semiconductor, and aerospace producers are expected to continue investing in factory automation. According to IFR.ORG, metals and machinery are projected to see 108,571 global robot installations in 2025, a 22% increase over 2024. Pharmaceutical, food and beverage, and consumer goods producers also require systems that support hygiene controls and frequent product changeovers. Manufacturing remains a substantial adoption base because many facilities already have defined automation processes and established equipment expertise.
Logistics and supply chain are projected to expand at a CAGR of 20.79% through 2032. E-commerce fulfillment, third-party logistics, and cold-chain operators are expected to support this faster growth. According to SYMBOTIC.COM, Symbotic is projected to report fiscal 2026 third-quarter revenue of USD 721 million and operate 77 live systems across food wholesale and medical distribution customers. Autonomous fulfillment systems can improve as throughput density increases, because higher utilization enables more efficient operating patterns. This differs from certain factory projects, where automation primarily distributes fixed costs across output. The physical AI in the manufacturing and logistics market, therefore, presents a significant opportunity, particularly for operators managing broad product ranges while meeting requirements for rapid, accurate, and repeatable order fulfillment.
By Technology Layer: Decision-Making and Learning Drives Competitive Differentiation
Execution and control are projected to hold 39.78% of the physical AI in manufacturing and logistics market share in 2026. Motion control systems, programmable logic controllers, and servo drives are widely used across new and existing equipment, which explains why execution and control remain the largest technology layer. Perception and sensing represent the next major layer through vision systems, LiDAR, and force-torque sensors. These components enable robots to identify objects, understand their surroundings, and respond to physical contact. Connectivity, data infrastructure, and management systems link these functions with enterprise information systems.
Decision-making and learning are projected to expand at a CAGR of 19.59% through 2032. Vision-language-action models can enable robots to interpret task instructions and adapt to unfamiliar object arrangements without repeated programming. According to NVIDIA.COM, NVIDIA is expected to state in March 2026 that major original equipment manufacturers are incorporating Isaac GR00T and Cosmos models into their development pipelines. According to HITACHI.COM, Hitachi and FANUC are expected to announce a partnership in September 2026 that combines HMAX Industry AI with FANUC robot hardware, using Hitachi facilities as early validation sites. This work is expected to expose models to operating conditions that simulation alone cannot fully replicate. As a result, decision-making capabilities are becoming a key area of differentiation for physical AI in the manufacturing and logistics industries, where suppliers must demonstrate that models can operate reliably across diverse materials, layouts, instructions, and exceptions.
Geography Analysis
Asia-Pacific is projected to hold 28.55% of the physical AI in manufacturing and logistics market share in 2026. According to IFR.ORG, China is projected to install 354,226 industrial robots in 2025, accounting for 59% of global deployments and a 20% increase over 2024. This concentration provides the region with a large manufacturing base and an established equipment ecosystem. According to IFR.ORG, Japan also maintains a strong position, as five of the world’s 10 largest industrial robot manufacturers are Japanese. South Korea’s automotive and semiconductor facilities, along with India’s electronics and pharmaceutical production programs, are expected to generate additional demand.
North America is projected to expand at a CAGR of 20.14% through 2032. Reshoring activity, workforce constraints, and the development of physical AI software are expected to support investment across the United States. According to RESHORENOW.ORG, the Reshoring Initiative is expected to find that 36% of original equipment manufacturers had reshored or were actively reshoring in 2026. According to BLS.GOV, manufacturing job openings are projected to reach 529,000 in May 2026, increasing the urgency of automation decisions. FANUC is expected to announce in September 2026 that it will invest USD 90 million in a new Michigan plant and logistics center, reflecting the development of local capacity to meet demand for automation.
According to the International Federation of Robotics (IFR.ORG), Europe is projected to record 73,054 robot installations in 2025, representing a 14% decline from 2024. According to IFR.ORG, the organization expects installations to increase by 6% annually from 2027 to 2029, as energy and labor costs encourage factories to evaluate automation as an alternative to capacity expansion. South America, the Middle East, and Africa remain earlier-stage markets, with deployments concentrated in export manufacturing and logistics gateways. EU Machinery Regulation 2023/1230 establishes a market-access requirement that affects suppliers serving the region.
Competitive Landscape
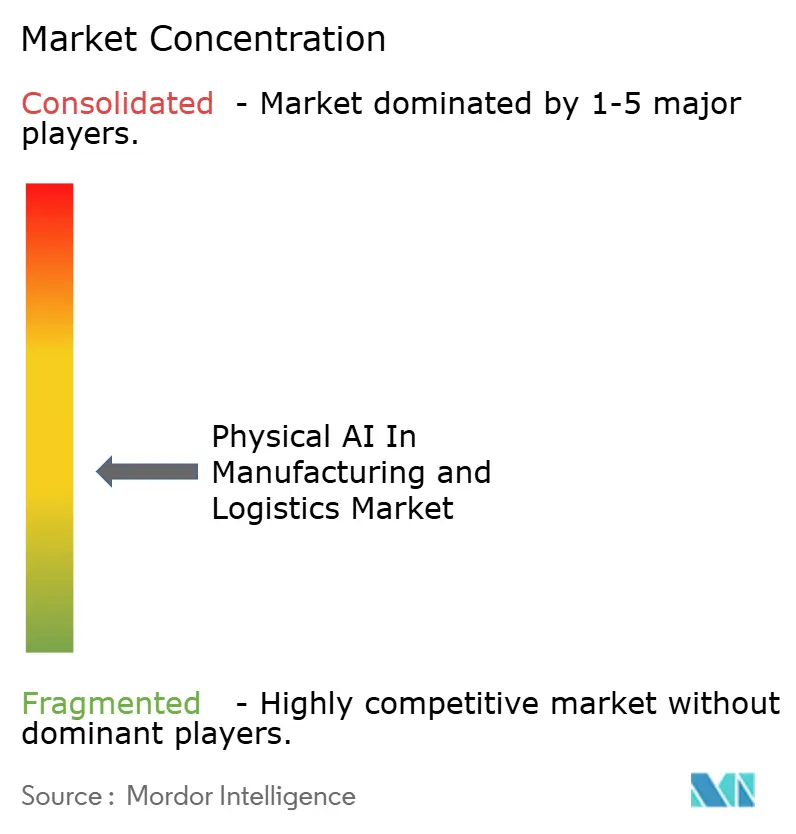
The physical AI market in manufacturing and logistics remains structurally fragmented. FANUC, ABB, Siemens, KUKA, YASKAWA, and Rockwell Automation maintain substantial installed bases of hardware, while software specialists and humanoid robot developers compete for the intelligence layer. FANUC, ABB, YASKAWA, and KUKA are adopting NVIDIA's Isaac platform for simulation and inference workflows. This trend concentrates influence within development tools, while systems integration remains distributed among numerous regional providers. Hardware incumbents retain customer relationships and integration capabilities, whereas software providers differentiate through models, data, and orchestration platforms that operate across robot types.
Data from deployed fleets can create a competitive advantage by capturing operating conditions that simulations cannot fully model. Geekplus serves more than 950 global customers, while Symbotic is expected to operate 77 active systems in fiscal 2026. These deployed fleets can generate operational data for product improvements and model training. Geekplus is expected to position its RoboShuttle Hyper around throughput capacity and embodied intelligence in August 2026. AutoStore is expected to sign a global strategic supply agreement with Amazon in August 2026 without upfront purchasing commitments, demonstrating how large buyers can retain supplier flexibility while expanding automation programs.
Interoperability is another competitive area in the physical AI market for manufacturing and logistics. VDA 5050 version 3.0 supports traffic management and path sharing for centrally controlled, free-navigating autonomous mobile robots. At Automate 2026, InOrbit.AI is expected to demonstrate eight vendor systems on a single factory floor. In addition, ISO 10218-1 and ISO 10218-2 are influencing product roadmaps as cybersecurity certification increasingly becomes a deployment requirement. These developments position fleet management services as a key capability at mixed-vendor sites, rather than solely within individual equipment platforms. As a result, customers can evaluate and deploy new robots without necessarily replacing their existing equipment and control systems.
Physical AI In Manufacturing and Logistics Industry Leaders
-
ABB Ltd
-
KUKA AG
-
FANUC CORPORATION
-
YASKAWA ELECTRIC CORPORATION
-
OMRON Corporation
- *Disclaimer: Major Players sorted in no particular order
Recent Industry Developments
- September 2026: Hitachi and FANUC announced a strategic partnership to jointly commercialize physical AI, combining Hitachi's HMAX Industry AI platform with FANUC's AI-equipped industrial robots. Validation was set to occur at Hitachi manufacturing facilities in the Ibaraki region as Customer Zero, with commercial deployment targeting fiscal 2027 across the semiconductor, pharmaceutical, automotive, and logistics sectors.
- September 2026: Agility Robotics unveiled Digit 5, delivering 40% more payload capacity at 22.7 kg, a 10:1 run-to-charge ratio enabling more than 20 hours of daily operation, and ISO-standard swappable gripper mounts. Agility reported more than USD 300 million in contingent multi-year Digit 5 customer orders as of May 2026, with more than 65,000 accumulated operational hours across customer sites, including GXO, Amazon, Schaeffler, and Toyota Motor Manufacturing Canada.
- September 2026: Vecna Robotics raised USD 31 million to expand its dock-to-dock autonomous mobile robot deployment teams, citing more than double the year-over-year CaseFlow orders since its 2025 launch.
- August 2026: Amazon signed a global strategic supply agreement with AutoStore for modular grid-based storage automation, with no upfront purchasing commitments.
Global Physical AI In Manufacturing and Logistics Market Report Scope
The Physical AI in Manufacturing and Logistics Market Report is Segmented by Offering (Hardware, Software, and Services), Robot Form Factor (Industrial Robotic Arms, Collaborative Robots, Autonomous Mobile Robots, Automated Guided Vehicles, Mobile Manipulators and Other Robot Form Factors), End User (Manufacturing [Automotive, Electrical and Electronics, Semiconductors, Metals and Machinery, Aerospace and Defense Manufacturing, Pharmaceuticals and Medical Devices, Food and Beverage, and Consumer Goods] and Logistics and Supply Chain [E-Commerce Fulfillment, Third-Party Logistics, Retail and Grocery Distribution, Parcel and Express Delivery, and Cold-Chain Logistics]), Technology Layer (Perception and Sensing, Decision-Making and Learning, Execution and Control, and Other Technology Layers), and Geography (North America, South America, Europe, Asia-Pacific, and the Middle East and Africa). The Market Forecasts are Provided in Value (USD).
| Hardware |
| Software |
| Services |
| Industrial Robotic Arms |
| Collaborative Robots |
| Autonomous Mobile Robots |
| Automated Guided Vehicles |
| Mobile Manipulators |
| Other Robot Form Factors |
| Manufacturing | Automotive |
| Electrical and Electronics | |
| Semiconductors | |
| Metals and Machinery | |
| Aerospace and Defense Manufacturing | |
| Pharmaceuticals and Medical Devices | |
| Food and Beverage | |
| Consumer Goods | |
| Logistics and Supply Chain | E-Commerce Fulfillment |
| Third-Party Logistics | |
| Retail and Grocery Distribution | |
| Parcel and Express Delivery | |
| Cold-Chain Logistics |
| Perception and Sensing |
| Decision-Making and Learning |
| Execution and Control |
| Other Technology Layers |
| North America | United States |
| Canada | |
| Mexico | |
| South America | Brazil |
| Argentina | |
| Rest of South America | |
| Europe | Germany |
| United Kingdom | |
| France | |
| Italy | |
| Spain | |
| Rest of Europe | |
| Asia-Pacific | China |
| Japan | |
| South Korea | |
| India | |
| Rest of Asia-Pacific | |
| Middle East | Saudi Arabia |
| United Arab Emirates | |
| Rest of Middle East | |
| Africa | South Africa |
| Nigeria | |
| Rest of Africa |
| By Offering | Hardware | |
| Software | ||
| Services | ||
| By Robot Form Factor | Industrial Robotic Arms | |
| Collaborative Robots | ||
| Autonomous Mobile Robots | ||
| Automated Guided Vehicles | ||
| Mobile Manipulators | ||
| Other Robot Form Factors | ||
| By End User | Manufacturing | Automotive |
| Electrical and Electronics | ||
| Semiconductors | ||
| Metals and Machinery | ||
| Aerospace and Defense Manufacturing | ||
| Pharmaceuticals and Medical Devices | ||
| Food and Beverage | ||
| Consumer Goods | ||
| Logistics and Supply Chain | E-Commerce Fulfillment | |
| Third-Party Logistics | ||
| Retail and Grocery Distribution | ||
| Parcel and Express Delivery | ||
| Cold-Chain Logistics | ||
| By Technology Layer | Perception and Sensing | |
| Decision-Making and Learning | ||
| Execution and Control | ||
| Other Technology Layers | ||
| By Geography | North America | United States |
| Canada | ||
| Mexico | ||
| South America | Brazil | |
| Argentina | ||
| Rest of South America | ||
| Europe | Germany | |
| United Kingdom | ||
| France | ||
| Italy | ||
| Spain | ||
| Rest of Europe | ||
| Asia-Pacific | China | |
| Japan | ||
| South Korea | ||
| India | ||
| Rest of Asia-Pacific | ||
| Middle East | Saudi Arabia | |
| United Arab Emirates | ||
| Rest of Middle East | ||
| Africa | South Africa | |
| Nigeria | ||
| Rest of Africa | ||
Key Questions Answered in the Report
What is the physical AI in manufacturing and logistics market size?
The physical AI in manufacturing and logistics market is expected to increase from USD 31.51 billion in 2026 to USD 88.01 billion by 2032, at an 18.79% CAGR over 2027-2032.
Which offering leads physical AI deployments in manufacturing and logistics?
Hardware led with a 55.61% share in 2026 because robot platforms, sensors, and edge compute equipment remain the main starting point for deployment.
Which robot form factor is expanding fastest?
Mobile manipulators are projected to expand at a 20.13% CAGR through 2032 as users seek systems that combine movement with dexterous handling.
Why are logistics operators adopting physical AI systems?
Faster fulfillment requirements, rising order volumes, and the need for higher throughput are supporting adoption in e-commerce, third-party logistics, and cold-chain operations.
Which region is projected to expand fastest?
North America is projected to expand at a 20.14% CAGR through 2032, supported by reshoring activity, labor shortages, and software development capacity.
What limits the wider adoption of physical AI systems?
High upfront costs, uncertain returns, safety and cybersecurity requirements, limited edge-case data, and the risk of downtime from model updates can delay projects.