Pharma Glass Tubing Market Size and Share
Market Overview
| Study Period | 2020 - 2031 |
|---|---|
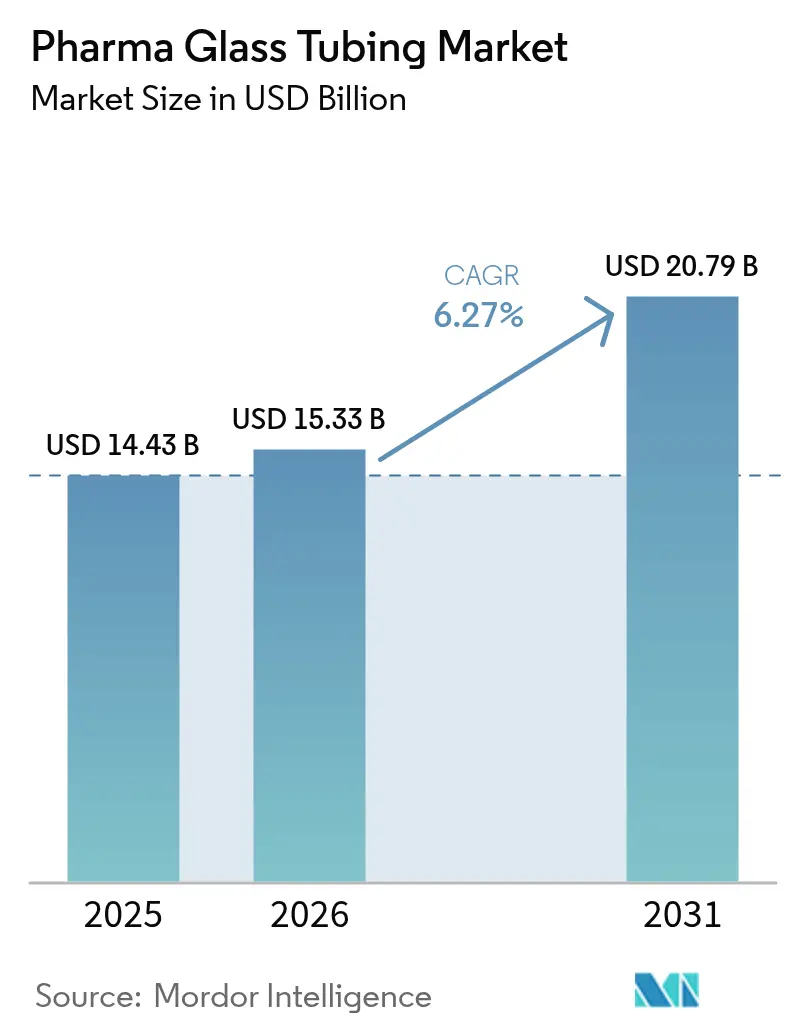
| Market Size (2026) | USD 15.33 Billion |
| Market Size (2031) | USD 20.79 Billion |
| Growth Rate (2026 - 2031) | 6.27% CAGR |
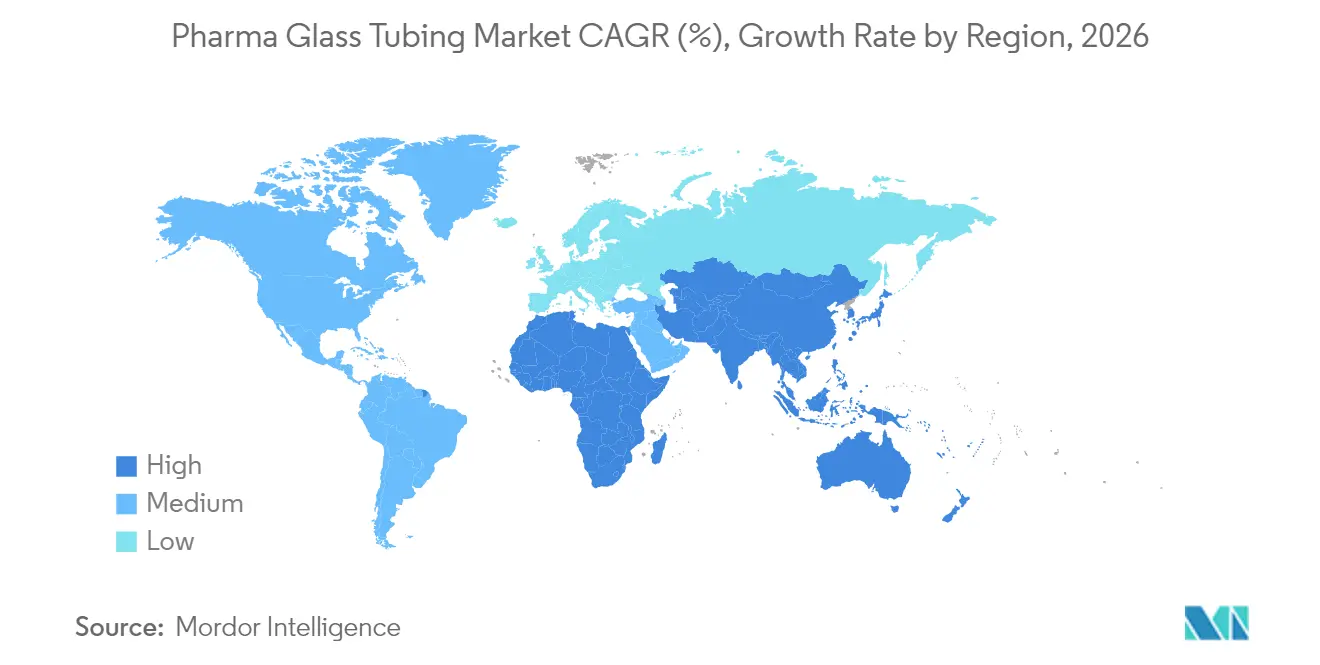
| Fastest Growing Market | Asia Pacific |
| Largest Market | North America |
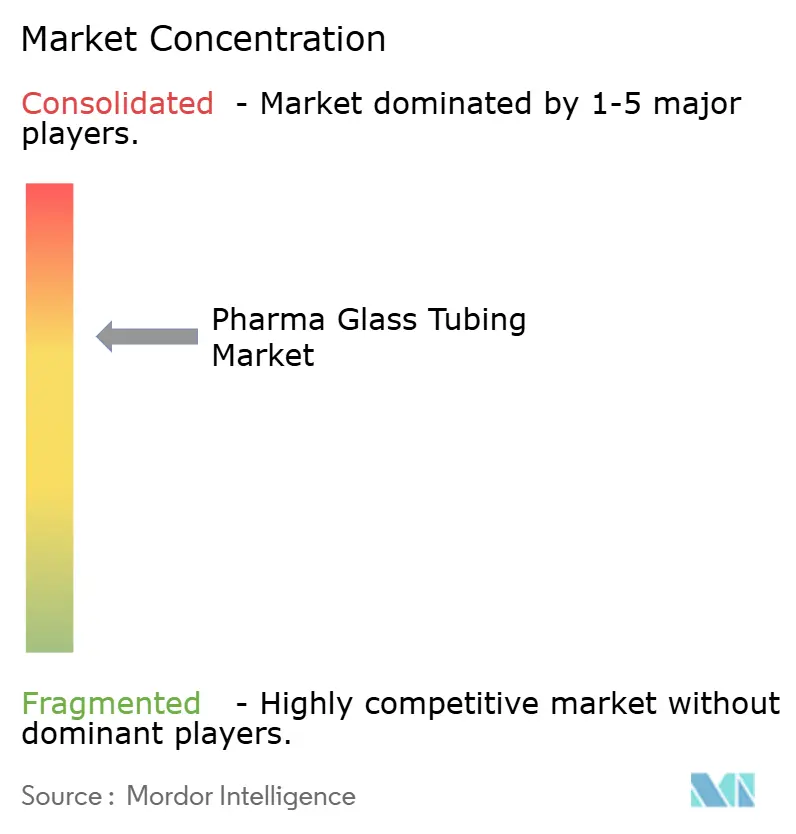
| Market Concentration | Medium |
Major Players *Disclaimer: Major Players sorted in no particular order Image © Mordor Intelligence. Reuse requires attribution under CC BY 4.0. | |
Pharma Glass Tubing Market Analysis by Mordor Intelligence
The pharma glass tubing market size in 2026 is estimated at USD 15.33 billion, growing from 2025 value of USD 14.43 billion with 2031 projections showing USD 20.79 billion, growing at 6.27% CAGR over 2026-2031. Structural demand created by biologics, a regulatory pivot toward Type I borosilicate glass, and sustainability mandates that elevate endlessly recyclable materials are the primary forces expanding the pharma glass tubing market. Innovation around Ready-to-Use (RTU) containers, embedded RFID features, and near-site production lines are reshaping competitive strategies while reinforcing long-term growth opportunities within the pharma glass tubing market. Type I borosilicate dominance, vial leadership, and clear glass preference remain durable, yet fast-growth pockets such as syringes, aluminosilicate tubing, and RTU formats are widening the addressable pharma glass tubing market. Competitive intensity is moderate as leading players form alliances to standardize formats, counter rising polymer competition, and hedge raw-material volatility, all of which influence strategic positioning across the pharma glass tubing market.
Key Report Takeaways
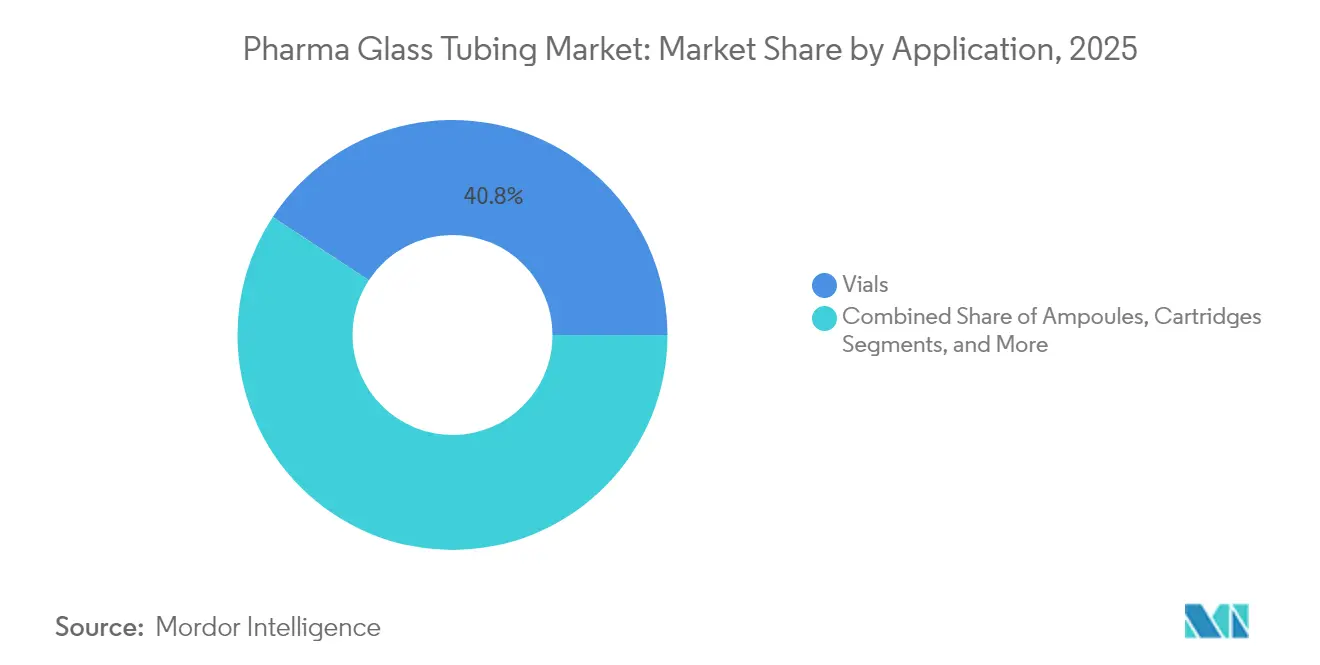
- By application, vials held 40.76% of the pharma glass tubing market share in 2025, while syringes are projected to expand at a 7.31% CAGR to 2031.
- By glass type, Type I borosilicate commanded 63.54% share of the pharma glass tubing market size in 2025 and aluminosilicate tubing is forecast to grow at 8.1% CAGR through 2031.
- By forming process, tubular production contributed 67.75% revenue share in 2025; Ready-to-Use tubing is set to advance at a 7.79% CAGR by 2031.
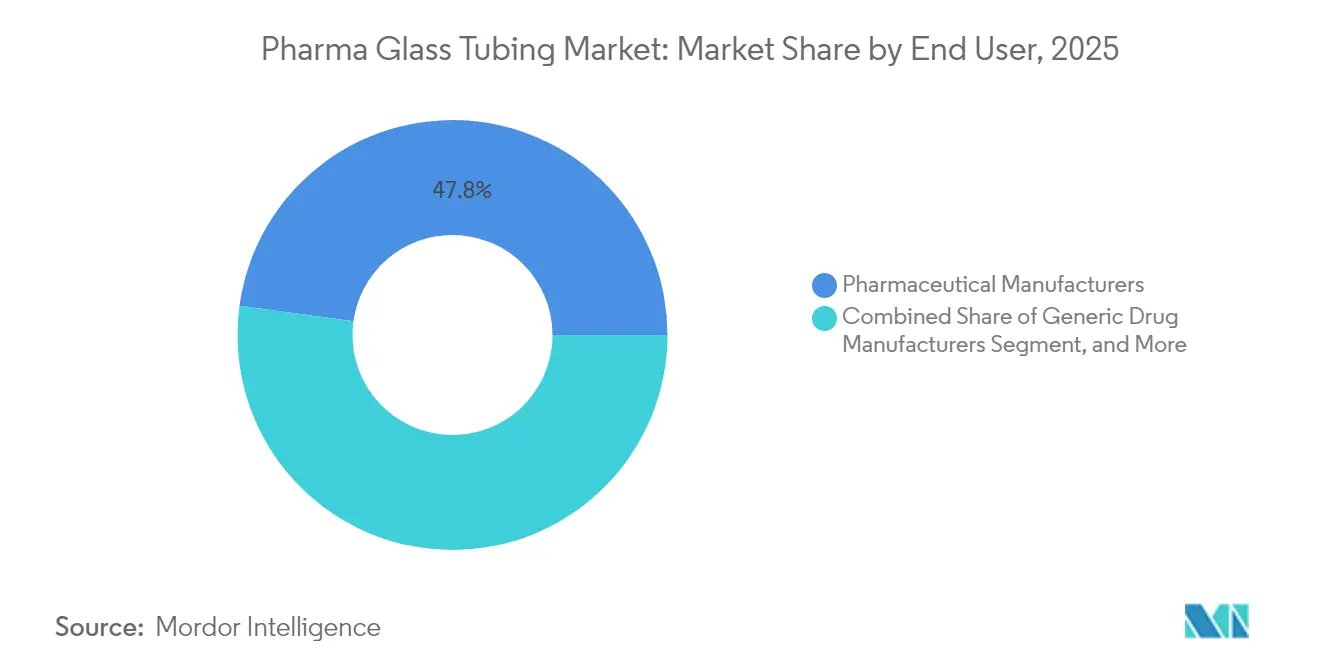
- By end user, pharmaceutical manufacturers accounted for 47.82% share, whereas CDMOs are the fastest-growing group at 7.86% CAGR to 2031.
- By glass color, clear glass led with 76.88% share in 2025 and is predicted to maintain 7.73% CAGR through by 2031.
- By region, North America represented 38.96% of 2025 revenue and Asia-Pacific is on track for a 8.79% CAGR by 2031.
Note: Market size and forecast figures in this report are generated using Mordor Intelligence’s proprietary estimation framework, updated with the latest available data and insights as of 2026.
Global Pharma Glass Tubing Market Trends and Insights
Drivers Impact Analysis*
| Driver | (~) % Impact on CAGR Forecast | Geographic Relevance | Impact Timeline |
|---|---|---|---|
| Surge in injectable biologics and vaccines | +2.1% | Global, with concentration in North America and EU | Medium term (2-4 years) |
| Regulatory preference for Type I borosilicate glass | +1.8% | Global, led by FDA and EMA jurisdictions | Long term (≥ 4 years) |
| Circular-economy push for infinitely recyclable packaging | +1.2% | EU primary, expanding to North America | Long term (≥ 4 years) |
| Near-site tubing lines for domestic fill-finish capacity | +0.9% | North America and EU, with APAC adoption | Medium term (2-4 years) |
| Embedded RFID-ready smart tubing formats | +0.4% | North America and EU early adoption | Long term (≥ 4 years) |
| Source: Mordor Intelligence | |||
Injectable Biologics Drive Unprecedented Demand for Sterile Glass Containers
A wave of monoclonal antibodies, GLP-1 drugs, and mRNA vaccines is driving unprecedented volume requirements for Type I borosilicate vials and syringes. Stevanato Group reported 22.1% revenue growth in Q1 2025, anchored by its Vertiva 10 mL delivery system purpose-built for GLP-1 formulations. Investments mirror demand: Nipro Corporation allocated USD 398 million (EUR 366 million) to a North Carolina plant slated to add 2 billion vials annually from late-2025. Cell and gene therapies, which require ultra-low extractables, further entrench glass as the de-risked container choice. Contract Development and Manufacturing Organizations (CDMOs) translate these biologics pipelines into bulk tubing orders, ensuring sustained growth for the pharma glass tubing market.
Regulatory Mandates Solidify Type I Borosilicate Glass Supremacy
The FDA’s 2024 container-closure guidance codifies risk-based assessments that heavily favor borosilicate’s inert profile. Parallel alignment by the European Medicines Agency and China’s updated YY 1001-2024 syringe standard solidifies a global norm. Drug developers view regulatory acceptance as non-negotiable, channeling purchases toward Type I tubing even when costlier than soda-lime variants. This harmonized stance raises entry barriers for polymers while anchoring long-run demand across the pharma glass tubing market.
Circular Economy Initiatives Position Glass as Sustainable Packaging Solution
EU Green Deal directives and corporate ESG pledges intensify demand for glass, an endlessly recyclable substrate with well-established collection loops. SGD Pharma introduced vials containing 30% post-consumer cullet in early-2025, demonstrating compliance without sacrificing sterility. West Pharmaceutical Services integrated closed-loop systems that lower virgin feedstock needs while boosting ESG metrics in its 2024 report. Sustainability thus acts as both market differentiator and procurement requirement, strengthening the premium positioning of the pharma glass tubing market.
Near-Site Manufacturing Drives Domestic Glass Tubing Demand
Pandemic-era disruptions persuaded pharmaceutical firms to localize critical inputs. Nipro’s Carolinas complex and SCHOTT’s multi-site European expansions underscore a pivot to regional production footprints.[1]SCHOTT AG, “Capacity Expansion for Pharmaceutical Glass,” Schott.com Local RTU supply mitigates freight contamination risks and compresses lead times a decisive advantage for biologics manufacturers operating in just-in-time campaigns. The movement feeds regionalized procurement contracts that embed long-term volume visibility for glass producers within the pharma glass tubing market.
Restraints Impact Analysis*
| Restraint | (~) % Impact on CAGR Forecast | Geographic Relevance | Impact Timeline |
|---|---|---|---|
| Rising competition from COP/COPP polymer containers | -1.6% | Global, strongest in cost-sensitive markets | Short term (≤ 2 years) |
| Volatility in borosilicate raw-material and energy costs | -1.0% | Global, acute in EU due to energy crisis | Short term (≤ 2 years) |
| EU carbon-pricing on gas-fired melting furnaces | -0.4% | EU primary, potential expansion globally | Medium term (2-4 years) |
| Source: Mordor Intelligence | |||
COP/COPP Polymers Challenge Glass in Cost-Sensitive Applications
Cyclic olefin polymer and cyclic olefin copolymer containers attract cost-sensitive generics makers with shatter resistance and weight savings. Yet polymer uptake stalls in biologics owing to immature long-term stability data compared with glass. Regulatory conservatism compounds polymer hurdles, sustaining Type I usage even as polymer vendors sharpen value propositions on total cost of ownership. In emerging markets prioritizing price, polymers may erode share temporarily, but high-value therapies continue to secure the pharma glass tubing market trajectory.
Raw Material Cost Volatility Pressures Glass Manufacturing Economics
High-purity silica sand and boric oxide core inputs for pharma-grade tubing face cross-industry demand that amplifies price swings. Queensland resource assessments highlight limited ultra-high-purity deposits suitable for injectable container use.[2]Queensland Government Department of Resources, “Silica Sand Resources Assessment,” Resources.qld.gov.au Concurrently, natural-gas prices elevate furnace operating costs, while EU carbon credits levy additional expense. Larger manufacturers hedge via forward contracts and efficiency investments, but smaller players struggle, nudging the sector toward further consolidation within the pharma glass tubing market.
*Our forecasts treat driver/restraint impacts as directional, not additive. The impact forecasts reflect baseline growth, mix effects, and variable interactions.
Segment Analysis
By Application: Biologics Sustain Vial Dominance While Syringes Accelerate
Global revenue data confirm that vials captured 40.76% of the pharma glass tubing market in 2025, underpinned by their versatility for freeze-drying, multi-dose vaccines, and sensitive biologics. Vials also represent the single largest slice of the pharma glass tubing market size for 2025, encouraged by automation-friendly geometry. Technology advances such as Nipro’s D2F vials add drop-impact resistance that lowers waste during high-speed filling. Continued investment by CDMOs extends vial order books well into the forecast window.
Syringes, however, log the fastest growth trajectory at 7.31% CAGR owing to self-administration trends and combination-product approvals. The Vertiva platform illustrates how larger-volume glass syringes address viscosity challenges in GLP-1 drugs, thereby expanding use-cases beyond traditional 1 mL formats. Regulatory bias toward glass for biologics cements the momentum. Together, vials and syringes constitute twin pillars that reinforce the expansion of the pharma glass tubing market.


By Glass Type: Aluminosilicate Gains Momentum Against Type I Stronghold
Type I borosilicate retained a commanding 63.54% share of the pharma glass tubing market size in 2025, reflecting decades of regulatory trust. Numerous FDA filings cite borosilicate containers as the reference standard, preserving installed filling infrastructure. Aluminosilicate tubing, though still niche, is growing at 8.1% CAGR because of its higher mechanical strength that permits thinner walls and lower weight, yielding logistics savings. Valor-grade variants meet Pharma 3407 protocols, positioning aluminosilicate as a premium alternative for ultra-high-value injectables, thereby diversifying material options within the pharma glass tubing market.
By Forming Process: RTU Formats Redefine Manufacturing Norms
Tubular forming accounted for 67.75% revenue share in 2025, prized for tight dimensional control necessary for high-speed lines. Cost-efficient tooling and scalability keep tubular processes at the core of the pharma glass tubing market. Yet RTU formats post a 7.79% CAGR as drug developers bypass in-house washing, depyrogenation, and sterilization. The 2024 RTU Alliance frames shared standards that lower qualification hurdles, boosting adoption among clinical and commercial plants alike. Consequently, RTU tubing reshapes procurement criteria and propels incremental value across the pharma glass tubing market.
By End User: CDMOs Catalyze Outsourcing Wave
Pharmaceutical manufacturers held 47.82% of 2025 revenues, yet CDMOs are escalating at 7.86% CAGR as sponsors offload capacity risk. West Pharmaceutical Services notes CDMOs as a rising revenue contributor, illustrating growing influence over container specs. Outsourcing hotspots like North America and Singapore integrate RTU lines to compress tech-transfer timelines, solidifying continuous demand for high-grade tubing. This dynamic bolsters the commercial depth of the pharma glass tubing industry and widens its customer matrix.
By Glass Color: Clear Glass Remains the Inspection Gold Standard
Clear glass dominated with 76.88% share in 2025 and is still accelerating at 7.73% CAGR. Automated vision systems rely on optical transparency for particulate detection, making clear glass irreplaceable in large-scale fill-finish suites. Amber variants persist for UV-sensitive compounds yet face limitations in high-speed inspection. Advances in near-infrared vision may mitigate color constraints, but until regulatory validation matures, clear glass will anchor quality control flows in the pharma glass tubing market.
Geography Analysis
North America contributed 38.96% of global 2025 revenues, sustained by robust biologics pipelines, stringent FDA standards, and expanding domestic production footprints like Nipro’s Carolinas complex. The region benefits from public-private investment initiatives aimed at supply-chain resilience, translating into multi-year sourcing contracts that secure the pharma glass tubing market.
Europe follows closely, leveraging century-old glassmaking clusters and leadership in circular-economy regulations that favor endlessly recyclable packaging. Capacity expansions by SCHOTT and SGD Pharma’s recycled-content launch showcase the region’s dual focus on volume and sustainability. Yet EU carbon pricing raises cost pressure, compelling furnace electrification projects and alliances to share decarbonization know-how.
Asia-Pacific is the fastest mover at a 8.79% CAGR, driven by China’s biopharmaceutical scale-up and regulatory convergence to ICH norms. Shandong Pharmaceutical Glass’s double-digit revenue jump in H1 2024 depicts strong domestic uptake. ASEAN harmonization promises streamlined cross-border approvals, boosting regional trade in pharma glass tubing. Collectively, these dynamics feed a geographically diversified and resilient pharma glass tubing market.

Competitive Landscape
The pharma glass tubing market exhibits moderate concentration. Stevanato Group, Gerresheimer, and SCHOTT Pharma co-founded the RTU Alliance in 2024 to codify sterilization and packaging standards, reinforcing first-mover advantages while educating buyers on total cost of ownership. Technological differentiation now outweighs price competition; firms race to embed RFID tags, develop valor-grade aluminosilicate, and announce eco-furnace retrofits.
Strategic capex remains high: SCHOTT allocated EUR 200 million (USD 216 million) to bolster European Type I tubing lines, whereas Gerresheimer logged EUR 1.9 billion (USD 2.05 billion) fiscal-2024 revenue with 8.3% organic glass growth.[3]Gerresheimer AG, “Annual Report 2024,” Gerresheimer.com Patents filed in 2024 cover thinner-wall chemistries and smart-label integration, tightening intellectual-property moats.
Mid-tier regional players face margin squeeze from raw-material volatility and carbon taxes, accelerating M&A as scale becomes essential for furnace upgrades and global quality-system compliance. As a result, competitive interplay centers on innovation pipelines, regulatory mastery, and sustainability credentials rather than commodity pricing, preserving healthy profitability across the pharma glass tubing market.
Pharma Glass Tubing Industry Leaders
Schott AG
Corning Incorporated
Nipro Corporation
Nippon Electric Glass Co., Ltd.
Gerresheimer AG
- *Disclaimer: Major Players sorted in no particular order

Recent Industry Developments
- March 2025: Stevanato Group reported 22.1% Q1 2025 revenue growth and introduced the Vertiva 10 mL system for GLP-1 biologics
- February 2025: Nipro Corp. began operations at its USD 398 million (EUR 366 million) North Carolina vial plant with 2 billion-unit annual capacity
- January 2025: SGD Pharma launched vials containing 30% recycled glass for European clients
- December 2024: West Pharmaceutical Services posted USD 3.1 billion 2024 sales with 68% packaging mix


Global Pharma Glass Tubing Market Report Scope
Glass is one of the most widely used packaging materials in the pharmaceutical industry. Most of the primary packaging products, such as ampoules, vials, and syringes, in the industry are made up of glass material. Pharmaceutical tubing is primarily used as a raw material by the pharmaceutical packaging players to manufacture the end-user primary packaging products.
The scope of the study covers the key Applications, such as vials, ampoules, cartridges and syringes. The study also covers the impact of COVID-19 impact on the Pharmaceutical Glass Tubing Market.
| Vials |
| Ampoules |
| Cartridges |
| Syringes |
| Other Applications |
| Type I (Neutral Borosilicate 5.0) |
| Type II (Soda-Lime Treated) |
| Type III (Soda-Lime) |
| Aluminosilicate / Valor-type |
| Tubular |
| Molded |
| Ready-to-Use (RTU) Tubing |
| Pharmaceutical Manufacturers |
| Generic Drug Manufacturers |
| Contract Development and Manufacturing Organizations (CDMOs) |
| Research and Academic Laboratories |
| Clear |
| Amber |
| North America | United States | |
| Canada | ||
| Mexico | ||
| South America | Brazil | |
| Argentina | ||
| Chile | ||
| Rest of South America | ||
| Europe | Germany | |
| United Kingdom | ||
| France | ||
| Italy | ||
| Spain | ||
| Rest of Europe | ||
| Asia-Pacific | China | |
| Japan | ||
| India | ||
| South Korea | ||
| Australia | ||
| Rest of Asia-Pacific | ||
| Middle East and Africa | Middle East | Saudi Arabia |
| United Arab Emirates | ||
| Turkey | ||
| Rest of Middle East | ||
| Africa | South Africa | |
| Nigeria | ||
| Kenya | ||
| Rest of Africa | ||
| By Application | Vials | ||
| Ampoules | |||
| Cartridges | |||
| Syringes | |||
| Other Applications | |||
| By Glass Type | Type I (Neutral Borosilicate 5.0) | ||
| Type II (Soda-Lime Treated) | |||
| Type III (Soda-Lime) | |||
| Aluminosilicate / Valor-type | |||
| By Forming Process | Tubular | ||
| Molded | |||
| Ready-to-Use (RTU) Tubing | |||
| By End User | Pharmaceutical Manufacturers | ||
| Generic Drug Manufacturers | |||
| Contract Development and Manufacturing Organizations (CDMOs) | |||
| Research and Academic Laboratories | |||
| By Glass Color | Clear | ||
| Amber | |||
| By Geography | North America | United States | |
| Canada | |||
| Mexico | |||
| South America | Brazil | ||
| Argentina | |||
| Chile | |||
| Rest of South America | |||
| Europe | Germany | ||
| United Kingdom | |||
| France | |||
| Italy | |||
| Spain | |||
| Rest of Europe | |||
| Asia-Pacific | China | ||
| Japan | |||
| India | |||
| South Korea | |||
| Australia | |||
| Rest of Asia-Pacific | |||
| Middle East and Africa | Middle East | Saudi Arabia | |
| United Arab Emirates | |||
| Turkey | |||
| Rest of Middle East | |||
| Africa | South Africa | ||
| Nigeria | |||
| Kenya | |||
| Rest of Africa | |||


Key Questions Answered in the Report
How big is the pharma glass tubing market today?
The pharma glass tubing market size reached USD 15.33 billion in 2026 and is forecast to climb to USD 20.79 billion by 2031.
What is driving demand for premium borosilicate tubing?
A surge in injectable biologics and vaccines, combined with regulatory preferences for chemically inert Type I borosilicate glass, underpins demand growth.
Which application segment is expanding fastest?
Prefilled syringes are advancing at a 7.31% CAGR through 2031 due to self-administration trends and GLP-1 therapy volumes.
Why are Ready-to-Use formats gaining traction?
RTU tubing eliminates in-house washing and sterilization, reducing contamination risk and accelerating time to market for biologics.
Which region is set to grow quickest?
Asia-Pacific is projected for a 8.79% CAGR through 2031, fueled by China’s biopharma build-out and regulatory harmonization.
How concentrated is supplier competition?
The top five manufacturers hold roughly 55% collective share, indicating a market concentration score of 6.
Page last updated on:


