
P2P Payments Market Size and Share
Market Overview
| Study Period | 2021 - 2032 |
|---|---|
| Market Size (2027) | USD 16.5 Trillion |
| Market Size (2032) | USD 24.70 Trillion |
| Growth Rate (2027 - 2032) | 8.40 % |
| Fastest Growing Market | Middle East and Africa |
| Largest Market | Asia-Pacific |
| Market Concentration | Low |
Major Players *Disclaimer: Major Players sorted in no particular order Image © Mordor Intelligence. Reuse requires attribution under CC BY 4.0. | |
P2P Payments Market Analysis by Mordor Intelligence
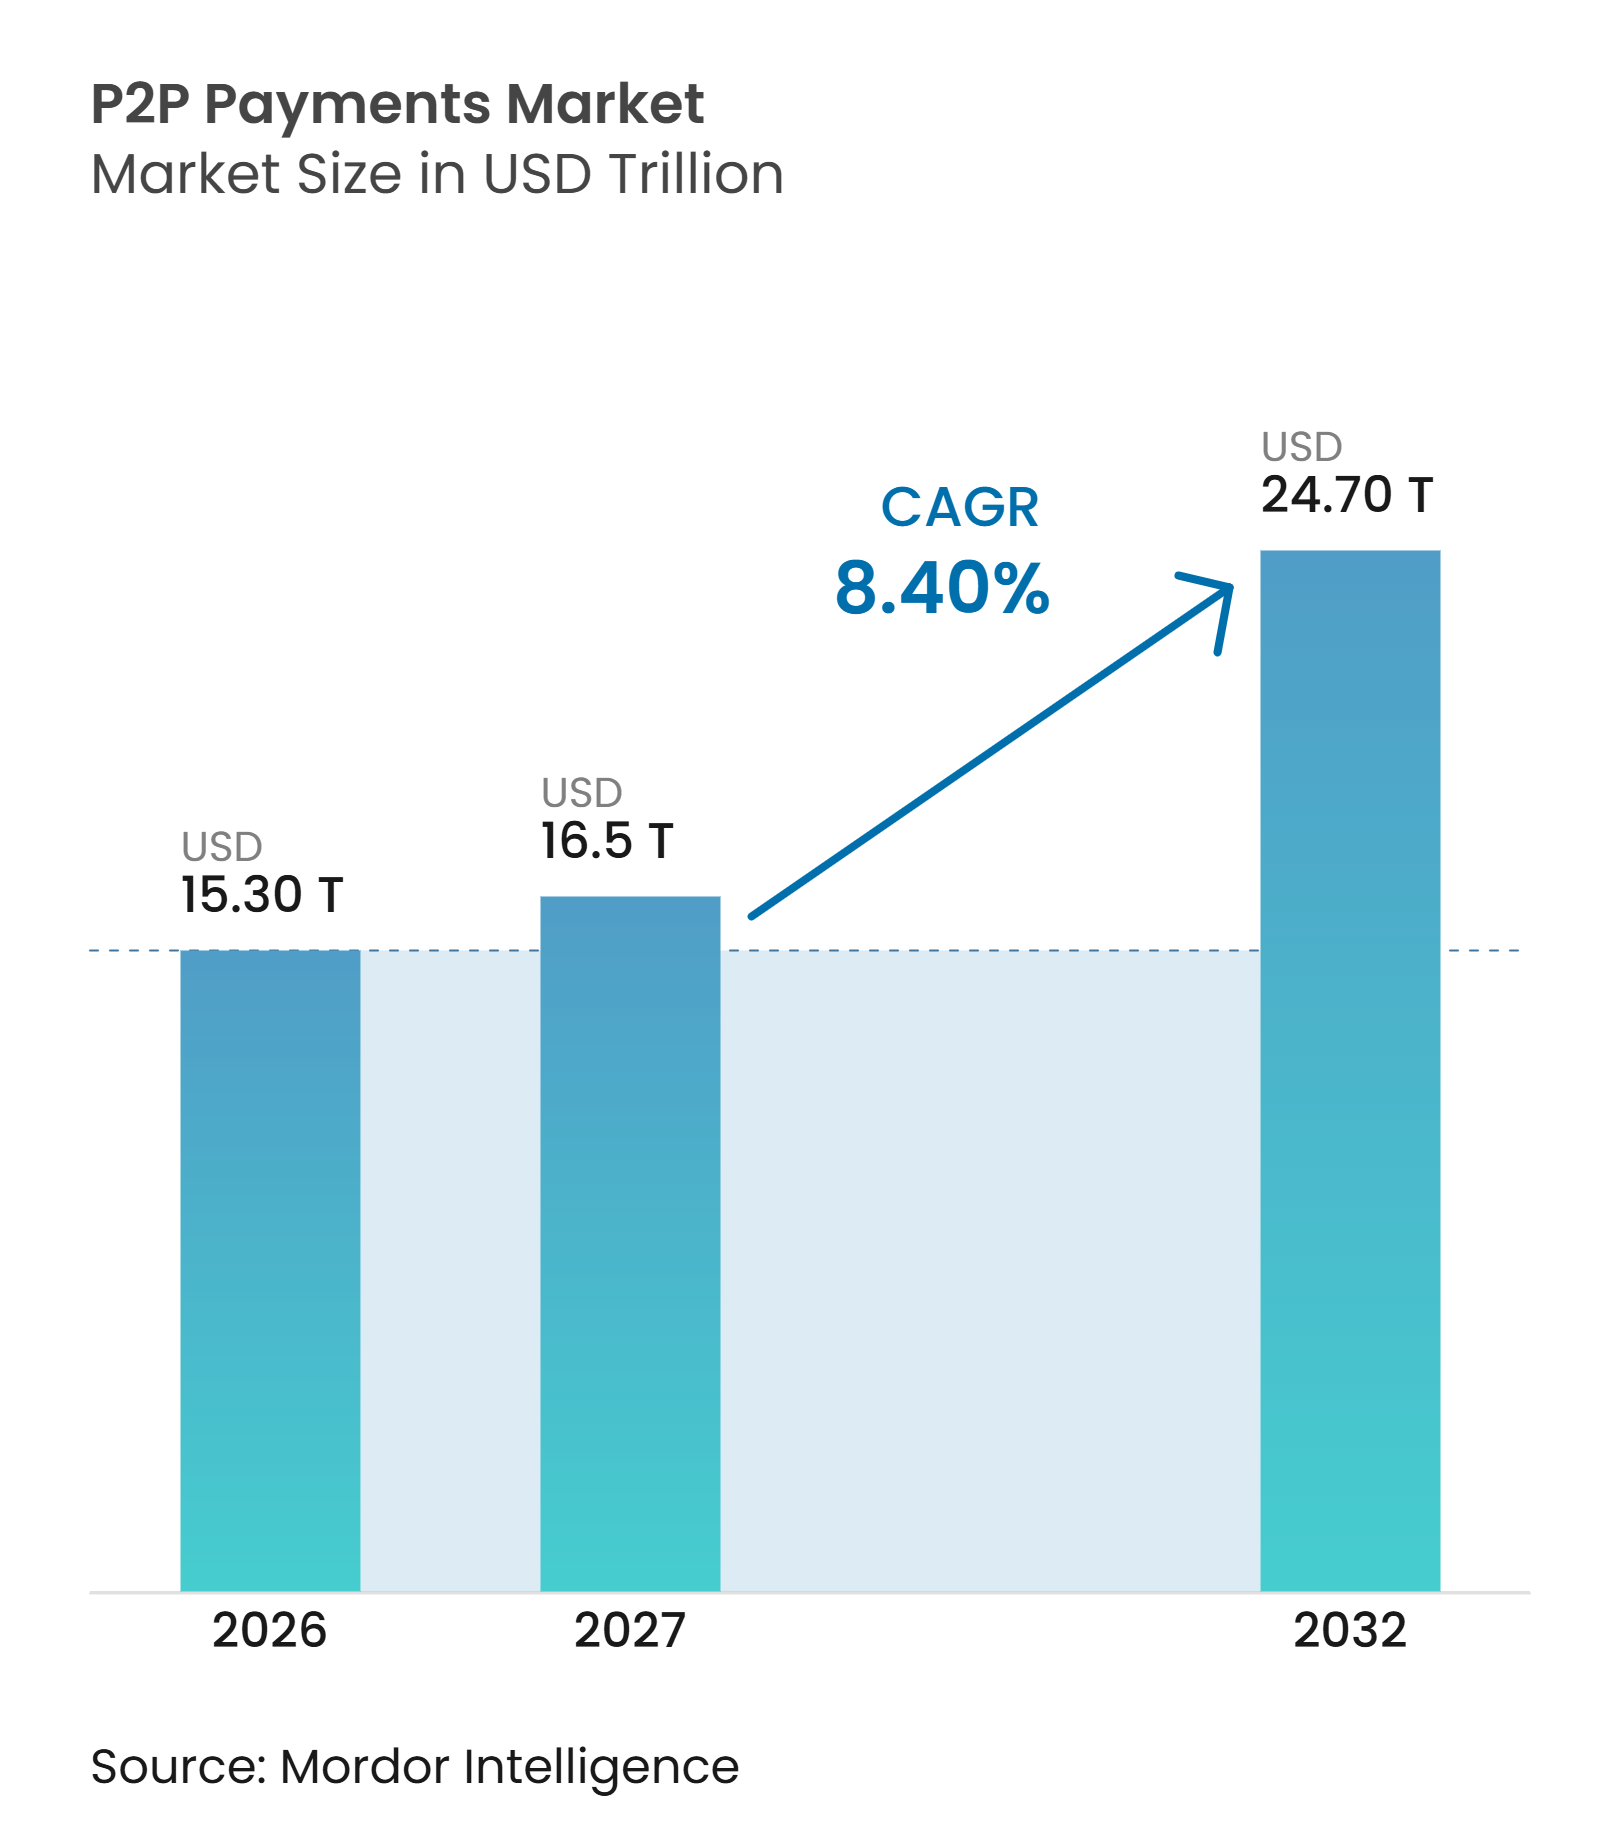
The P2P Payments Market size is expected to grow from USD 15.30 trillion in 2026 to USD 16.5 trillion in 2027 and is forecast to reach USD 24.70 trillion by 2032 at 8.40% CAGR over 2027-2032.
The P2P payments market is moving beyond simple user acquisition as existing users make more frequent payments for household transfers, gig-worker payouts, remittances, and small-business settlement. Instant payment rails, wallet adoption, and broader interoperability are expanding the range of payments that can move through peer-to-peer networks. The World Bank reported that 62% of adults in low- and middle-income economies made or received a digital payment in 2025, compared with 56% in 2021, which supports continued adoption in markets with lower banking access. Competition combines public payment rails, wallet providers, bank-linked networks, and digital-asset platforms, while national networks remain much more concentrated than the global P2P payments market. Fraud controls, reimbursement requirements, and cross-border compliance costs are becoming important factors in provider economics and expansion plans.
Key Report Takeaways
- By transaction type, domestic transfers captured 85.4% of the P2P payments market share in 2026, while cross-border transfers are projected to grow at a 12.5% CAGR through 2032.
- By payment method, digital wallets and mobile money transfers captured 43.3% of the P2P payments market share in 2026, while cryptocurrency, stablecoin, and other transfers are projected to grow at a 19.9% CAGR through 2032.
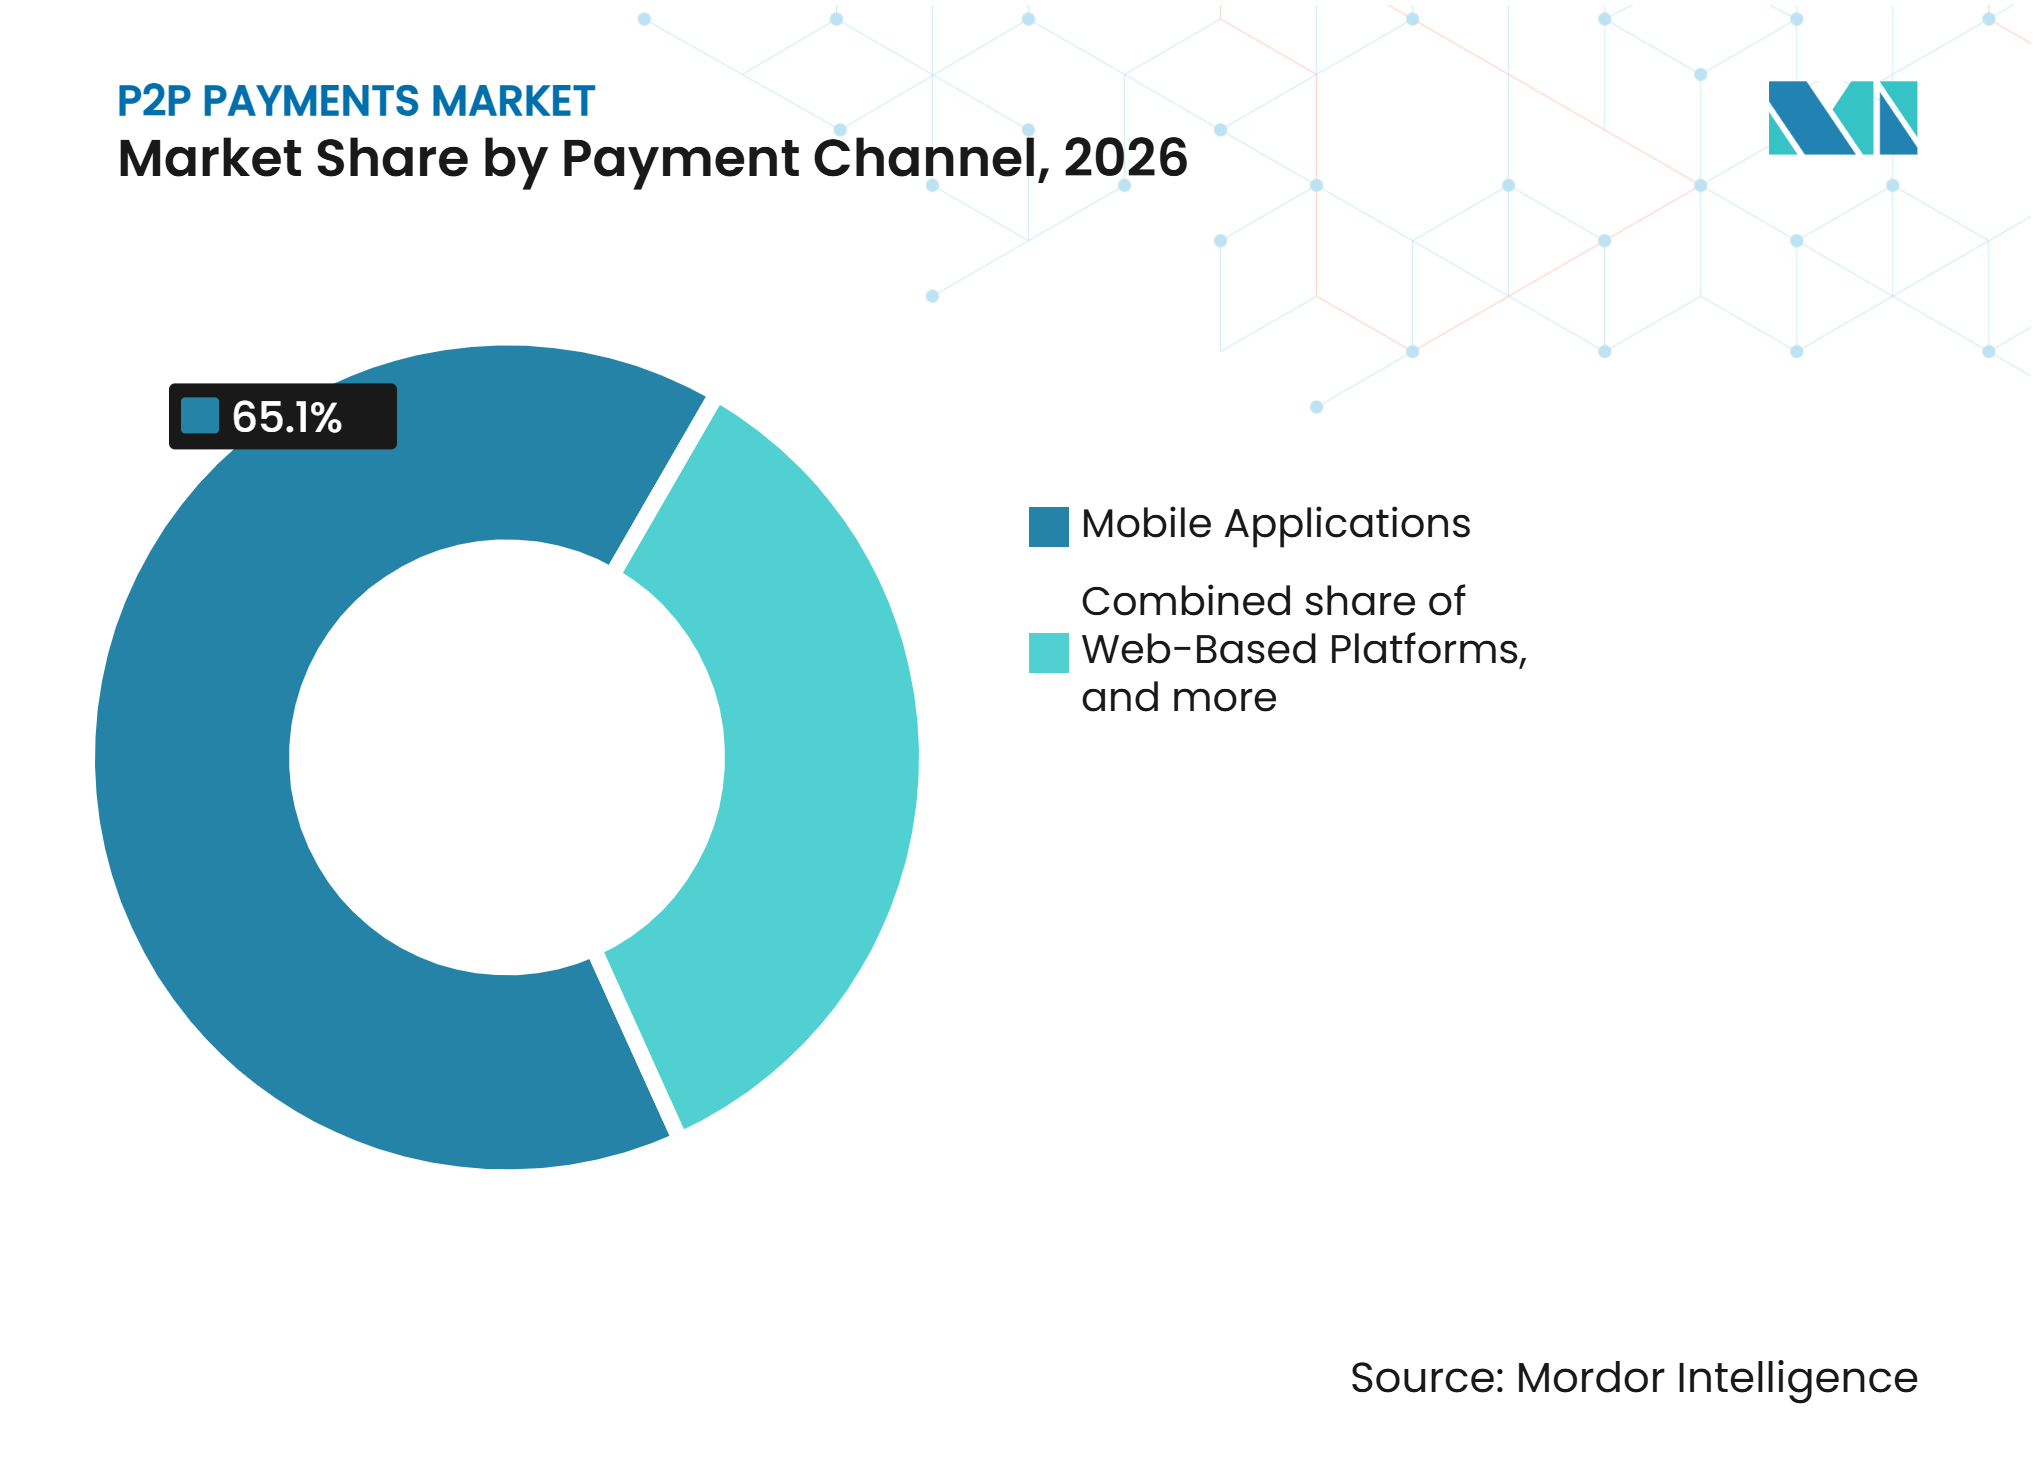
- By payment channel, mobile applications captured 65.1% of the P2P payments market share in 2026, while the others channel is projected to grow at a 14.8% CAGR through 2032.
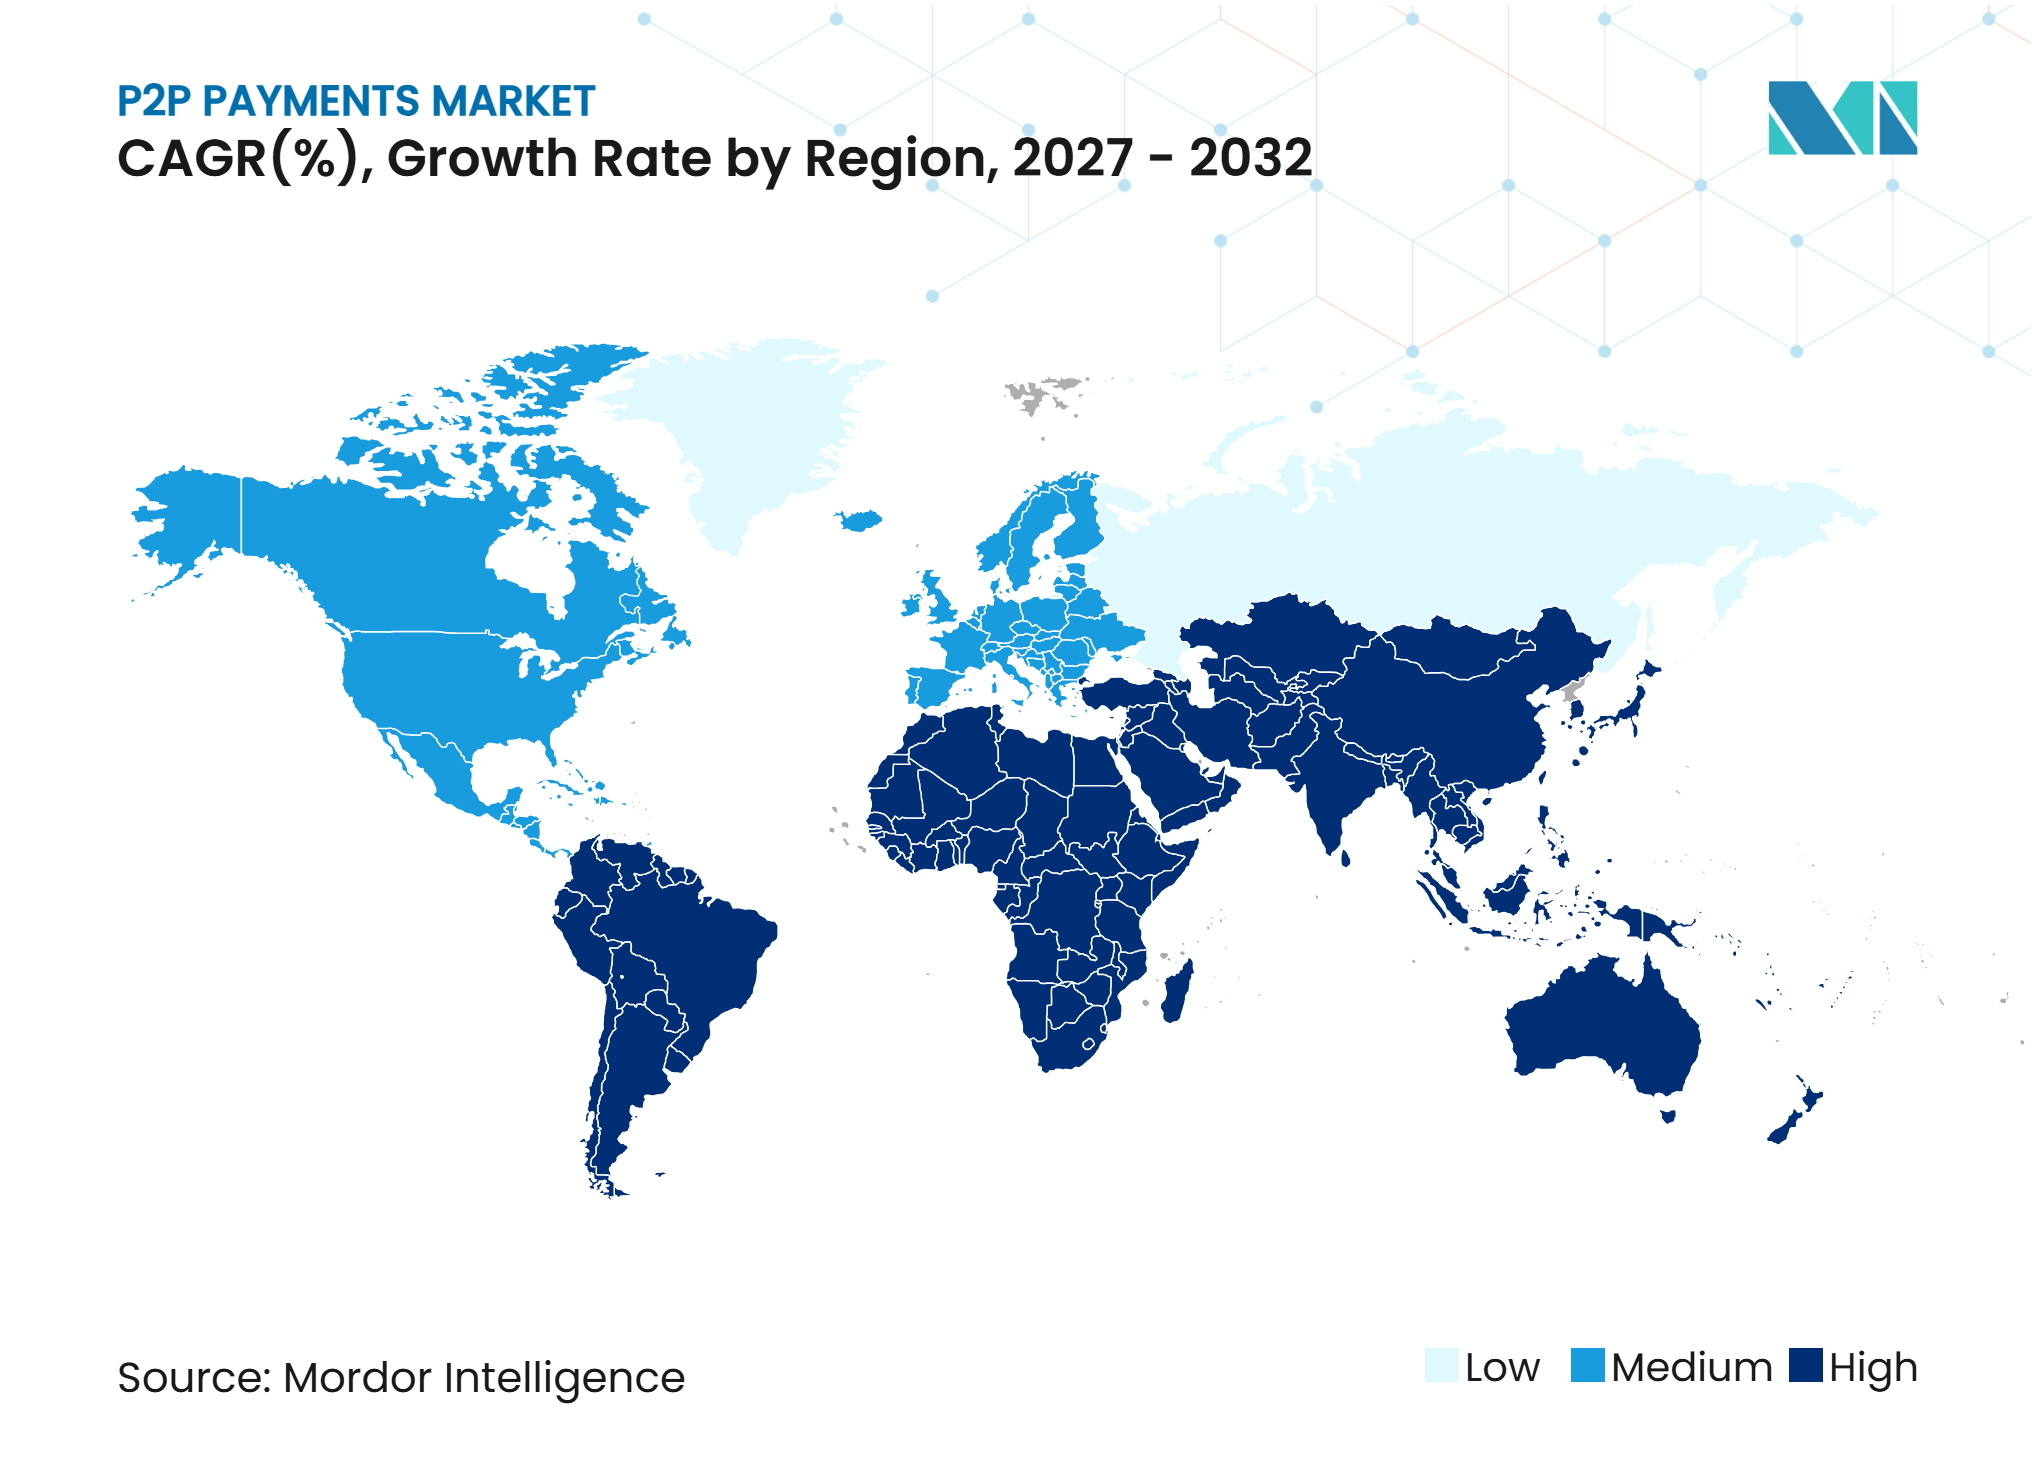
- By geography, Asia-Pacific captured 42.2% of the P2P payments market share in 2026, while the Middle East and Africa is projected to grow at a 12.9% CAGR through 2032.
Note: Market numbers in this report are based on Mordor Intelligence's proprietary estimation framework, which combines nine months of actuals with Q4 projections for base year 2026.
Market Trends and Insights
Drivers Impact Analysis of P2P Payments Market*
| Driver | (~) % Impact on CAGR Forecast | Geographic Relevance | Impact Timeline |
|---|---|---|---|
| Domestic Instant Payment Systems and 24/7 Account-to-Account Transfers | +2.0% | Global, strongest in Asia-Pacific and Latin America | Short term (≤ 2 years) |
| Digital Cross-Border Remittances and Lower-Cost Payment Corridors | +1.5% | South Asia, Sub-Saharan Africa, ASEAN, and Middle East and Africa corridors | Medium term (2-4 years) |
| Mobile Wallet and Bank-Linked P2P Application Adoption | +1.2% | Global, especially Asia-Pacific, Sub-Saharan Africa, and North America | Short term (≤ 2 years) |
| Interoperable Bank, Wallet, and National QR Networks | +0.9% | ASEAN, Asia-Pacific, Europe, and South America | Medium term (2-4 years) |
| Demand for Instant, Low-Cost Transfers Among Migrants, Families, and Unbanked Users | +0.7% | Middle East and Africa, Latin America, Southeast Asia, and South Asia | Long term (≥ 4 years) |
| Embedded P2P Transfers and Platform Payouts | +0.5% | North America, Europe, and Asia-Pacific | Medium term (2-4 years) |
| Source: Mordor Intelligence | |||
Expansion of Domestic Instant Payment Systems and 24/7 Account-to-Account Transfers
The P2P payments market benefits when instant domestic rails remove delays from account-to-account transfers. India’s Unified Payments Interface processed 228.3 billion transactions worth USD 3.4 trillion in 2025, with 32.5% year-over-year growth in transaction count[1]. The network averaged 802 million payments per day in September 2026, showing how deeply real-time transfers are being used in daily commerce. Brazil’s Pix reached 82% of the adult population by March 2026 and recorded nearly 280 million transactions on its June 2025 peak day. Where bank accounts are broadly connected to a low-cost rail, messaging services, retailers, and gig platforms can add a payment option without building their own settlement system. The European Union’s instant-payment rules also increased the use of SEPA Instant, which represented 25% of euro-area credit transfers in the second half of 2025.
Rising Cross-Border P2P Remittances Through Digital Wallets and Low-Cost Payment Corridors
Cross-border transfers are creating growth opportunities for the P2P payments market because families and migrants need faster ways to send smaller payments. The average global cost of a USD 1,000 P2P transfer was 2.6% in 2025, leaving a substantial gap to the Group of 20 target of 1% by 2027. ASEAN’s bilateral QR and instant-payment links carried USD 716.4 million in cross-border payments in 2025, including USD 305.7 million in P2P transfers[2]. United Nations reporting indicated that more than half of global remittances started digitally in 2025, but only 35% were fully digital from sender to recipient. This gap keeps cash-out networks important in many receiving markets. Providers that connect digital initiation with reliable local disbursement can compete on convenience as well as transfer cost.
Growing Adoption of Mobile Wallets and Bank-Linked P2P Payment Applications
Mobile wallets are becoming a common interface for payments in the P2P payments market, especially where consumers rely on phones rather than branches. GSMA recorded 593 million active mobile money accounts in 2025, an increase of 15% from the prior year[3]. The same source reported that mobile money transactions exceeded USD 2 trillion in 2025. Wallets often sit above bank accounts and card rails rather than replacing them, which makes familiar funding methods available through a simpler mobile experience. This model can lower adoption barriers for consumers who already use debit cards or checking accounts. It can also keep platform revenue per transfer limited where the underlying bank rail is low cost.
Interoperability Between Bank Accounts, Mobile Wallets, and National QR Payment Networks
Interoperability is expanding the addressable reach of the P2P payments market by linking networks that previously operated separately. PayPal introduced PayPal World in July 2025 to connect PayPal and Venmo with NPCI International’s UPI, Tencent’s Tenpay Global, and Mercado Pago, covering nearly 2 billion users[4]. WeChat Pay added national QR systems in South Korea, Sri Lanka, Thailand, Malaysia, and Singapore in April 2026. Alipay+ connected with the Philippines’ QR Ph system in September 2026 and extended its network to more than 300 payment methods across more than 220 markets. Each linkage allows participants to reach a wider network without duplicating local acceptance infrastructure. ISO 20022 alignment can also improve the payment information available for fraud screening and beneficiary validation across borders.
Restraints Impact Analysis of P2P Payments Market*
| Restraint | (~) % Impact on CAGR Forecast | Geographic Relevance | Impact Timeline |
|---|---|---|---|
| Authorized Push Payment Scams, Social Engineering, and Account Takeover Fraud | -1.2% | Global, strongest in the United Kingdom, North America, and Asia-Pacific | Short term (≤ 2 years) |
| Divergent AML, KYC, Sanctions, and Local Payment Rules | -1.0% | Global, strongest in Middle East and Africa, South Asia, and Latin America corridors | Long term (≥ 4 years) |
| Limited Reversibility and Fragmented Consumer Dispute Resolution | -0.7% | North America and Europe | Medium term (2-4 years) |
| Uneven Instant-Payment Coverage and Interoperability Gaps | -0.8% | Sub-Saharan Africa, Southeast Asia, and Latin America outside Brazil | Long-term (≥ 4 years) |
| Source: Mordor Intelligence | |||
Authorized Push Payment Scams, Social Engineering, and Account Takeover Fraud
Authorized push payment fraud is a major constraint on the P2P payments market because scam losses create consumer harm and direct reimbursement costs. United Kingdom Finance recorded GBP 576.4 million (USD 772.8 million) in authorized push payment losses in 2025, a 19% increase from 2024. Investment scams accounted for GBP 221.5 million (USD 296.8 million) and rose 40% over the same period. The Payment Systems Regulator reported that victims received GBP 316 million (USD 423.6 million) through the reimbursement framework in the 18 months to March 2026, representing an 88% reimbursement rate. Such obligations place greater cost pressure on smaller providers that cannot invest as heavily in monitoring systems and case management. Stronger authentication and real-time scam warnings therefore affect both customer trust and the ability to operate at scale.
Cross-Border Transfer Friction From Divergent AML/KYC Rules, Sanctions, and Local Payment Regulations
Different anti-money-laundering, know-your-customer, sanctions, and local payment rules can slow expansion in the P2P payments market. A cross-border transaction must meet requirements in at least 2 jurisdictions, and data-localization rules can complicate real-time checks on beneficiaries. The European Union’s Transfer of Funds Regulation has applied fully since December 2024, adding specific information requirements for transfers involving crypto-assets. Different regulatory approaches require providers to adapt their controls for each new corridor. These obligations are especially difficult in lower-volume corridors where compliance costs are high relative to payment values. The continuing difference between the 2.6% global transfer cost in 2025 and the 1% Group of 20 target reflects the operational work still needed across international payment networks.
*Our forecasts treat driver/restraint impacts as directional, not additive. The impact forecasts reflect baseline growth, mix effects, and variable interactions.
P2P Payments Market Segment Analysis
By Transaction Type:
Domestic Transfers Hold the Largest Position, While Cross-Border Transfers Lead GrowthDomestic transfers accounted for 85.4% of the P2P payments market size in 2026, equal to USD 13.1 trillion. The segment is supported by government-built instant rails that have made routine transfers low cost and widely accessible in high-adoption countries. India’s UPI and Brazil’s Pix show the scale that account-linked instant payment infrastructure can achieve. Pix processed 79.7 billion transactions in 2025, and business-to-business Pix represented 52% of total SPI transaction value by March 2026. Domestic networks are increasingly becoming the base for adjacent uses, including platform payouts and merchant settlement.
Cross-border transfers are forecast to grow at a 12.5% CAGR from 2027 to 2032, faster than the overall P2P payments market. This category is shaped by migration corridors, family support payments, and the need for convenient international transfers. PayPal World connected UPI with global payment platforms in July 2025, adding potential international reach to an established domestic rail. Uzbekistan reported that P2P card transfers accounted for 46% of inward remittances worth USD 8.6 billion in 2025. These cases show how domestic card and wallet networks can also act as the receiving layer for remittances.
By Payment Method:
Digital Wallets Lead, While Digital-Asset Transfers Gain MomentumDigital wallets and mobile money transfers held 43.3% of the P2P payments market size in 2026, equivalent to USD 6.6 trillion. Their lead reflects the widespread use of mobile interfaces for person-to-person transfers and the reach of telecom-led wallet systems. Active mobile money accounts continued to grow in 2025, particularly in low- and middle-income economies. Wallets can link to bank accounts, cards, or stored value, allowing users to choose familiar ways to fund transfers. This flexibility supports use in both banked and underbanked communities.
Cryptocurrency, stablecoin, and other transfers are forecast to grow at a 19.9% CAGR through 2032. The segment is attracting attention where providers seek faster settlement across high-cost international corridors. Circle received final approval in July 2026 to establish Circle National Trust, placing its USDC infrastructure under direct federal oversight in the United States. Regulation and consumer protection remain important determinants of adoption. The P2P payments industry is likely to see digital assets used alongside conventional rails rather than replace all bank-based payments. Providers will need to balance speed and lower processing costs against compliance and customer safeguards.
By Payment Channel:
Mobile Applications Lead Usage, While Other Channels Broaden AccessMobile applications held 65.1% of the P2P payments market share in 2026, valued at USD 10.0 trillion. Biometric login, contact-based transfers, and integration with social features make mobile applications suitable for frequent personal payments. The format also allows providers to place fraud alerts and payment confirmations directly in the user journey. Mobile-first services are particularly important in countries where smartphones are the main access point for financial services. Application design and security features can therefore influence consumer loyalty as much as transfer pricing.
The others channel, which includes QR interlinks, NFC tap-to-pay, and delegated payment access, is projected to grow at a 14.8% CAGR through 2032. This category expands the ways a payment can be initiated and received, rather than limiting transfers to a single application. China and Indonesia introduced a bilateral cross-border service based on Indonesia’s QRIS standard in April 2026. Safaricom completed its M-Pesa Fintech 2.0 upgrade in September 2025, increasing transaction capacity from 4,500 to 6,000 transactions per second. These channels can extend access where users depend on QR codes, feature phones, or shared-device arrangements.

Geography Analysis
Asia-Pacific captured 42.2% of the P2P payments market share in 2026, equal to USD 6.5 trillion. The region is shaped by large-scale domestic systems in India and China, together with expanding links across Southeast Asia. UPI averaged 802 million payments per day in September 2026 and represented 49% of global real-time transaction activity in 2025. Alipay+ connected more than 300 payment methods across more than 220 markets after its September 2026 QR Ph linkage. ASEAN had established 29 QR and instant-payment links by December 2025. India’s planned 30% market-share cap for dominant UPI applications is also relevant to competition at the application layer.
North America and Europe have well-developed bank-linked P2P services and expanding instant-payment coverage. Zelle processed more than USD 1.2 trillion across 4.2 billion transactions in 2025, with transaction value rising 20% year over year. The United States Federal Reserve reported that FedNow settled USD 274.7 billion across 5.0 million payments in the second quarter of 2026. SEPA Instant represented 25% of euro-area credit transfers in the second half of 2025. Klarna launched instant P2P payments in 13 European countries in January 2026. Canada’s Interac e-Transfer and Mexico’s SPEI also support the regional payment base.
The Middle East and Africa is forecast to record the fastest regional growth at a 12.9% CAGR through 2032. Telecom-led mobile money systems remain central to payment access across many African economies. MTN MoMo processed USD 500.3 billion in 2025 and had 69.5 million monthly active users. Safaricom and Vodacom processed USD 525.6 billion in 2025, bringing their combined transaction value above USD 1 trillion. Saudi Arabia and the United Arab Emirates are adding payment infrastructure through wallet and modernization programs. South America is supported by Pix in Brazil and by expanding digital financial services in Argentina, Colombia, Peru, and Bolivia. Mercado Pago reported 72 million monthly active users in the third quarter of 2025, a 29% year-over-year increase
Competitive Landscape
Market Concentration
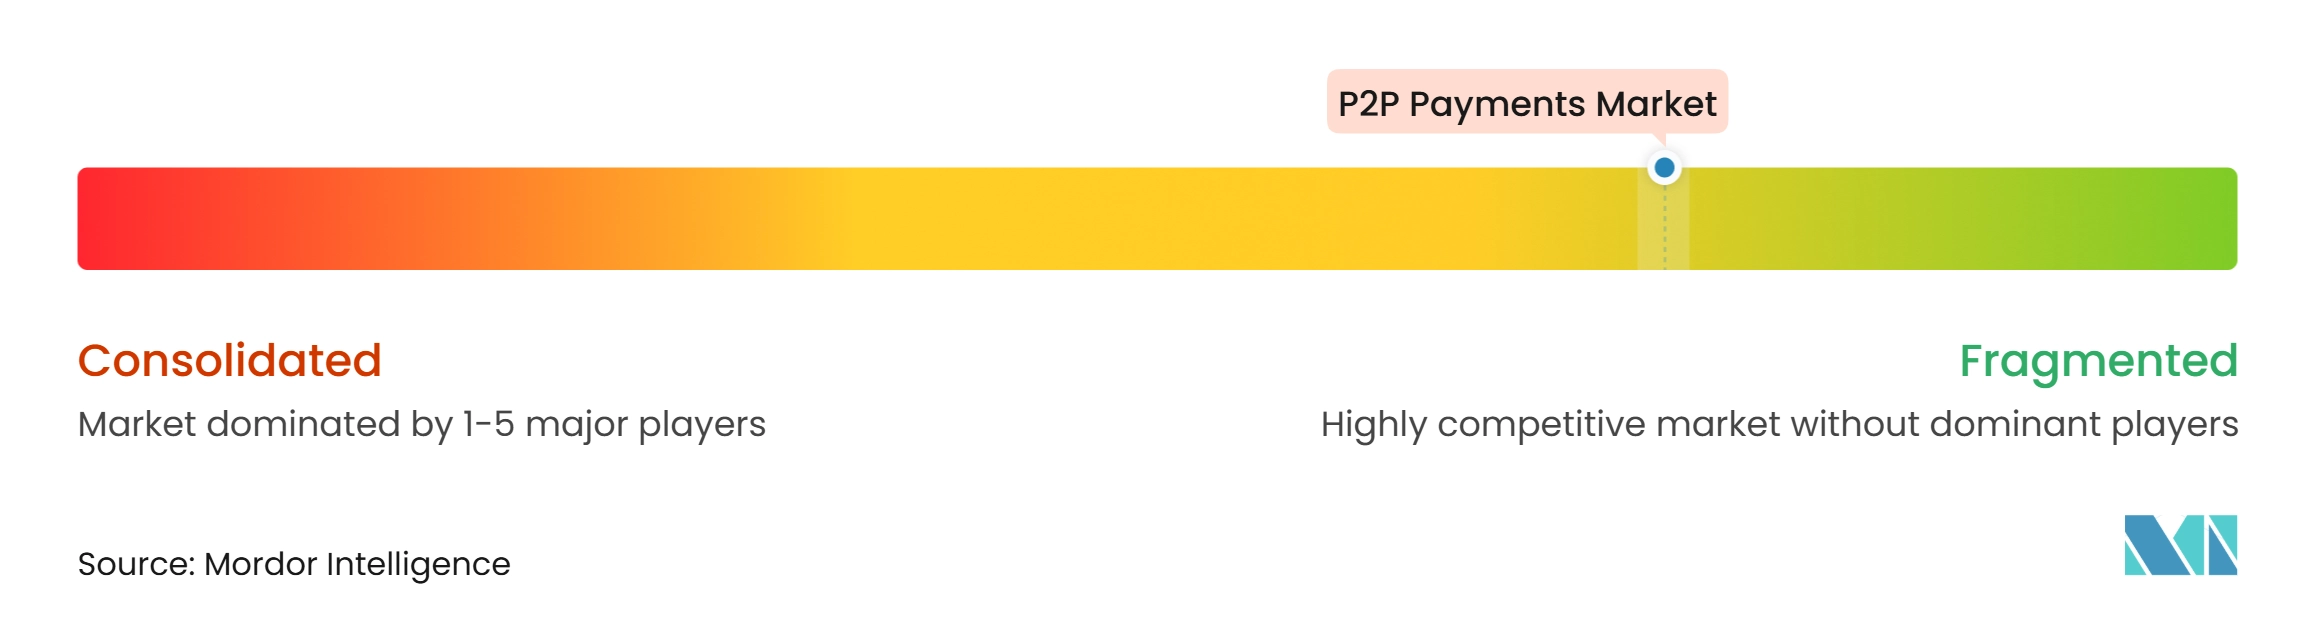
The global P2P payments market is fragmented, with competition distributed across digital wallets, bank-linked payment networks, mobile money operators, and international remittance providers. No single provider dominates the global market because payment preferences, regulatory frameworks, and transaction infrastructure vary substantially by country. However, individual domestic markets can be highly concentrated. In India, PhonePe, Google Pay, and Paytm account for a substantial majority of monthly Unified Payments Interface (UPI) transactions, while M-PESA holds a strong position in Kenya's mobile money ecosystem. In the United States, Zelle's network of participating financial institutions gives bank-linked P2P payments broad distribution. These regional differences highlight the importance of local partnerships, network reach, and consumer adoption in shaping competitive positions.
Leading providers are expanding interoperability and cross-border connectivity to increase their reach. In July 2025, PayPal introduced PayPal World, a platform designed to connect major digital wallets and payment systems, including PayPal, Venmo, UPI, Tenpay Global, and Mercado Pago. In March 2026, PayPal announced plans to extend international transfers between Venmo and PayPal users, broadening connectivity across payment ecosystems. Wise has continued investing in international transfers and local payment infrastructure, while Revolut has pursued international expansion and broader financial services. These developments demonstrate how providers are competing through cross-platform compatibility, international reach, and simplified transfers rather than relying exclusively on domestic transaction volumes.
Competition is also extending into fraud prevention, regulatory infrastructure, and emerging digital-asset services. In September 2026, Block applied to establish Builders Bank & Trust, a proposed national trust bank focused on bitcoin and stablecoin custody. Such initiatives illustrate how payment companies are exploring regulated financial infrastructure alongside consumer-facing applications. Meanwhile, ISO 20022 adoption increases the importance of structured payment data, operational controls, and compliance capabilities across interconnected payment networks. Opportunities remain for smaller providers to differentiate through underserved remittance corridors, local-language services, offline-capable payment access, and improved fraud protection. Overall, the P2P payments market remains fragmented, with competitive advantages arising from local network effects, interoperability, trust, and the ability to connect diverse payment systems securely.
P2P Payments Industry Leaders
-
Early Warning Services, LLC
-
PayPal Holdings, Inc.
-
Block, Inc.
-
Ant Group Co., Ltd.
-
Tencent Holdings Limited
- *Disclaimer: Major Players sorted in no particular order
P2P Payments Market Companies Covered in this Report
- PayPal Holdings, Inc.
- Block, Inc.
- Early Warning Services, LLC
- Ant Group Co., Ltd.
- Tencent Holdings Limited
- Apple Inc.
- Wise Group plc
- Remitly Global, Inc.
- Revolut Ltd
- One97 Communications Limited
- PhonePe Private Limited
- MercadoLibre, Inc.
- Nu Holdings Ltd.
- MTN Group Limited
- Safaricom PLC
- Alphabet Inc.
- Grab Holdings Limited
- Fiserv, Inc.
- Fidelity National Information Services, Inc.
- Stripe, Inc.
Recent Industry Developments in P2P Payments Market
- October 2026: Safaricom and Pesapal launched Dynamic Scan-to-Pay, Tap-to-Pay, and AI Pay on M-Pesa’s My OneApp, which had more than 7 million downloads. The companies targeted merchant acceptance at 500,000 outlets. AI Pay scans printed or handwritten receipts to populate payment details.
- September 2026: Block submitted an application to establish Builders Bank & Trust, N.A., a proposed national trust bank for bitcoin and stablecoin custody and digital-asset trading.
- July 2026: Circle received final approval to establish Circle National Trust, the first federally chartered stablecoin trust bank in the United States.
- April 2026: China and Indonesia launched a bilateral cross-border payment service based on Indonesia’s QRIS national QR standard.
Global P2P Payments Market Report Scope
Segmentation Overview
| Domestic P2P Transfers |
| Cross-Border P2P Transfers |
| Bank Account Transfers |
| Digital Wallet and Mobile Money Transfers |
| Card-Funded Transfers |
| Cryptocurrency, Stablecoin and Other Transfers |
| Mobile Applications |
| Web-Based Platforms |
| USSD and SMS-Based Payments |
| Others |
| North America | United States |
| Canada | |
| Mexico | |
| South America | Brazil |
| Argentina | |
| Rest of South America | |
| Europe | United Kingdom |
| Germany | |
| France | |
| Italy | |
| Spain | |
| Rest of Europe | |
| Asia-Pacific | China |
| Japan | |
| India | |
| South Korea | |
| Australia | |
| Indonesia | |
| Thailand | |
| Malaysia | |
| Singapore | |
| Vietnam | |
| Rest of Asia-Pacific | |
| Middle East and Africa | Saudi Arabia |
| United Arab Emirates | |
| Turkey | |
| South Africa | |
| Egypt | |
| Rest of Middle East and Africa |
| By Transaction Type | Domestic P2P Transfers | |
| Cross-Border P2P Transfers | ||
| By Payment Method | Bank Account Transfers | |
| Digital Wallet and Mobile Money Transfers | ||
| Card-Funded Transfers | ||
| Cryptocurrency, Stablecoin and Other Transfers | ||
| By Payment Channel | Mobile Applications | |
| Web-Based Platforms | ||
| USSD and SMS-Based Payments | ||
| Others | ||
| By Geography | North America | United States |
| Canada | ||
| Mexico | ||
| South America | Brazil | |
| Argentina | ||
| Rest of South America | ||
| Europe | United Kingdom | |
| Germany | ||
| France | ||
| Italy | ||
| Spain | ||
| Rest of Europe | ||
| Asia-Pacific | China | |
| Japan | ||
| India | ||
| South Korea | ||
| Australia | ||
| Indonesia | ||
| Thailand | ||
| Malaysia | ||
| Singapore | ||
| Vietnam | ||
| Rest of Asia-Pacific | ||
| Middle East and Africa | Saudi Arabia | |
| United Arab Emirates | ||
| Turkey | ||
| South Africa | ||
| Egypt | ||
| Rest of Middle East and Africa | ||
Key Questions Answered in the Report
What is the projected value of P2P payments by 2032?
The P2P payments market is forecast to reach USD 24.7 trillion by 2032, growing at an 8.4% CAGR from 2027.
Which transaction type has the largest share of P2P payments?
Domestic transfers lead with 85.4% share in 2026, supported by instant domestic payment rails.
Which payment method is growing the fastest?
Cryptocurrency, stablecoin, and other transfers are projected to grow at a 19.9% CAGR through 2032.
Which region is growing fastest for peer-to-peer payments?
The Middle East and Africa is forecast to expand at a 12.9% CAGR through 2032, supported by mobile money ecosystems. Telecom-led services are important because they extend payment access to users with limited bank access.
Why are instant payment systems important for P2P transfers?
They enable continuous account-to-account payments and make it easier for applications to offer low-cost transfers. In the P2P payments market, shared rails can also support wider competition among application providers.
What is the biggest risk facing P2P payment providers?
Authorized push payment scams create consumer losses, reimbursement obligations, and higher fraud-control costs. The P2P payments market depends on strong authentication, monitoring, and clear consumer protections to maintain trust.