
On-Demand Transportation Market Size and Share
Market Overview
| Study Period | 2021 - 2031 |
|---|---|
| Market Size (2026) | USD 264.75 Billion |
| Market Size (2031) | USD 348.98 Billion |
| Growth Rate (2026 - 2031) | 5.68 % |
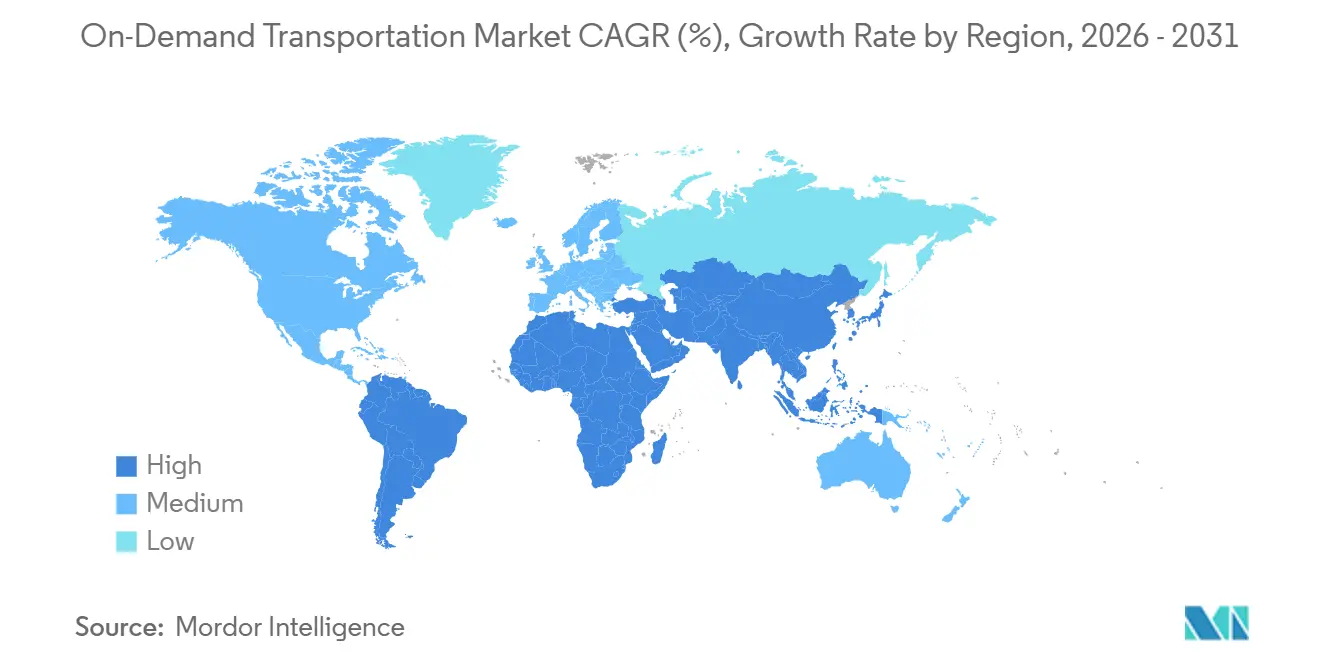
| Fastest Growing Market | Middle East and Africa |
| Largest Market | Asia-Pacific |
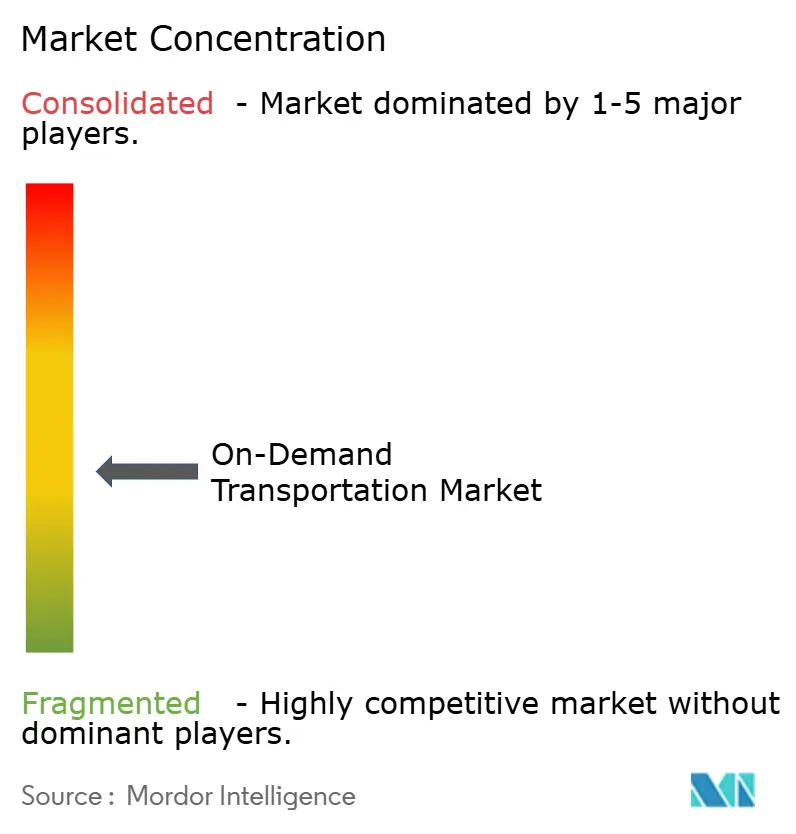
| Market Concentration | Medium |
Major Players *Disclaimer: Major Players sorted in no particular order Image © Mordor Intelligence. Reuse requires attribution under CC BY 4.0. | |
On-Demand Transportation Market Analysis by Mordor Intelligence
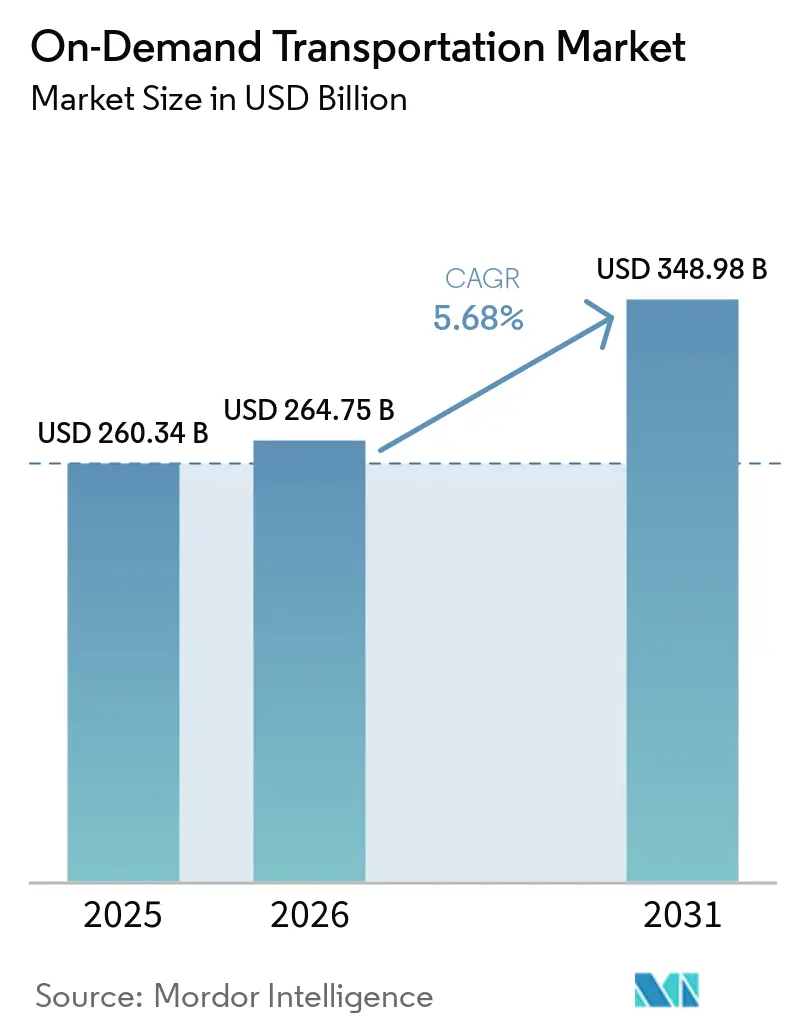
The on-demand transportation market was valued at USD 260.34 billion in 2025 and estimated to grow from USD 264.75 billion in 2026 to reach USD 348.98 billion by 2031, at a CAGR of 5.68% during the forecast period (2026–2031). The market now encompasses ride-hailing, carpooling, micro-mobility, on-demand taxi services, and autonomous vehicle pilots within urban mobility. Growth is driven by a shift from vehicle ownership to service-based access, particularly in cities facing rising parking costs, congestion, and operating expenses. Mobile apps dominate the booking process, enhancing platform control over customer access, pricing, and service bundling. Large global operators leverage technology and capital to compete, while regional platforms focus on pricing, two-wheeler options, and regulated fleet models. Challenges through 2031 include labor classification issues, city permit restrictions, pricing regulations, and insurance complexities. These factors affect profit margins but do not reduce overall market demand.
Key Report Takeaways
- By service, ride-hailing services held a 53.42% share of the On-Demand Transportation Market in 2025, while micro-mobility services are projected to grow at the highest CAGR of 6.46% by 2031.
- By vehicle type, passenger cars accounted for a 70.13% share of the On-Demand Transportation Market in 2025, while two-wheelers are projected to grow at the highest CAGR of 6.84% by 2031.
- By end user, individual consumers accounted for 81.93% of the On-Demand Transportation Market in 2025, while corporate and business travelers are projected to grow at the highest CAGR of 7.02% by 2031.
- By booking platform, mobile application-based booking captured an 85.31% share of the On-Demand Transportation Market in 2025 and is also projected to grow at the highest CAGR of 7.56% by 2031.
- By geography, Asia-Pacific accounted for 38.74% of the On-Demand Transportation Market in 2025, while the Middle East & Africa is projected to grow at the highest CAGR of 6.97% by 2031.
Note: Market size and forecast figures in this report are generated using Mordor Intelligence’s proprietary estimation framework, updated with the latest available data and insights as of January 2026.
Global On-Demand Transportation Market Trends and Insights
Drivers Impact Analysis*
| Driver | (~) % Impact on CAGR Forecast | Geographic Relevance | Impact Timeline |
|---|---|---|---|
| Rising Urban Congestion and Parking Scarcity | +1.4% | Global, with the highest concentration in Asia-Pacific megacities and North American metros | Long term (≥ 4 years) |
| Smartphone-Based Booking and Digital Payments | +1.2% | Emerging markets in South America, Africa, and Southeast Asia, with spillovers to the Middle East and Africa | Medium term (2-4 years) |
| Increasing Cost of Private Vehicle Ownership | +1.0% | North America and Western Europe, with early uptake in urban India and Brazil | Medium term (2-4 years) |
| AI-Based Fleet Optimization and Dynamic Dispatch | +0.8% | Global, with the fastest deployment in Asia-Pacific super-app ecosystems | Short term (≤ 2 years) |
| Growth of Super Apps and Integrated Mobility Platforms | +0.7% | Asia-Pacific core, expanding to the Middle East and Africa and Latin America | Long term (≥ 4 years) |
| Growth of Super Apps and Integrated Mobility Platforms | +0.5% | European Union, North America, GCC, and emerging Asia-Pacific cities | Medium term (2-4 years) |
| Source: Mordor Intelligence | |||
Rising Urban Congestion and Parking Scarcity
Urban congestion continues to drive the growth of the on-demand transportation market as the time cost of driving increases in major cities. Official data indicate that average annual delays per commuter in the United States have remained at record levels across all city sizes, showing that congestion has persisted above historical norms rather than declining. This trend is significant because commuters consider not only trip fares but also factors such as parking challenges, waiting times, fuel expenses, and lost productivity. As these burdens grow, on-demand transportation becomes a practical option for urban travel, short meetings, airport transfers, and first- and last-mile connectivity. Demand is also expanding beyond dense urban centers into feeder corridors, where travelers seek access without committing to full vehicle ownership. This broad-based demand supports repeat usage, even when fare pressures persist[1].
Smartphone-Based Booking and Digital Payments
Smartphone-based booking has become an essential aspect of the on-demand transportation market, evolving beyond a convenience feature. Mobile platforms now integrate ride discovery, payments, support, and loyalty into a single workflow, reducing barriers for first-time users. App-based booking has gained significant traction, reflecting the growing preference for managing transportation entirely through mobile interfaces. Companies continue to enhance these platforms, with Grab introducing AI-driven in-app experiences through GrabX and Uber incorporating AI-supported booking and travel utilities at GO-GET[2]. These advancements are shaping the market by influencing user retention, cross-selling opportunities, and service familiarity. Additionally, they provide larger platforms with greater control over bundling rides with travel, payments, and other daily services.
Increasing Cost of Private Vehicle Ownership
The on-demand transportation market is growing, supported by the rising costs of owning and operating private vehicles. Reports indicate that the average annual expense of owning a new vehicle in the United States has increased due to factors such as insurance, vehicle pricing, and financing. These higher costs shift consumer decisions from simple fare comparisons to broader household budget considerations. For individuals who drive fewer miles annually, app-based transportation services are becoming a more viable alternative to vehicle ownership when total costs are considered. Urban areas, where parking challenges and congestion already reduce the appeal of owning a car, further amplify this trend. As private vehicle expenses remain elevated, more consumers are turning to shared transportation options for daily commutes, occasional trips, and evening travel.
AI-Based Fleet Optimization and Dynamic Dispatch
AI-based dispatch systems are improving efficiency in the on-demand transportation market by reducing idle time and enabling faster ride matching. The United States Federal Transit Administration highlighted that real-time dispatch systems in on-demand transit reduced data latency and enabled machine learning tools to automate dispatch decisions, resulting in measurable cost savings per trip. These principles are equally applicable to ride allocation, route optimization, and supply positioning. Mobility apps have increasingly incorporated AI-driven travel coordination and search functions, reflecting a shift toward viewing AI as integral to transport operations rather than an additional feature. This trend enhances operators' competitive edge by enabling them to refine dispatch processes using historical demand patterns. Over time, this creates challenges for new entrants to match service quality, particularly in densely populated urban areas where demand is high and efficient operations are critical.
Restraints Impact Analysis*
| Restraint | (~) % Impact on CAGR Forecast | Geographic Relevance | Impact Timeline |
|---|---|---|---|
| Driver Classification and Labor Regulation Challenges | -0.6% | Global, with immediate exposure in the United States, the European Union, Indonesia, China, and Australia | Short term (≤ 2 years) |
| City-Level Licensing and Operational Restrictions | -0.4% | Europe, Asia-Pacific, and select North American metros | Medium term (2-4 years) |
| Pricing Regulation and Profitability Pressure | -0.5% | Indonesia, South America, and emerging markets with strong state intervention | Short term (≤ 2 years) |
| Insurance and Passenger Liability Complexity | -0.3% | United States, the European Union, and Australia | Medium term (2-4 years) |
| Source: Mordor Intelligence | |||
Driver Classification and Labor Regulation Challenges
Labor classification remains a significant challenge for the on-demand transportation market as it directly impacts the underlying cost structure. The United States Department of Labor introduced uncertainty by proposing new rulemaking on independent contractor analysis, keeping worker classification under review for platform-based businesses[3]. Changes in labor regulations influence more than wages, as platforms may also face additional requirements related to scheduling, benefits, transparency, and dispute resolution. The on-demand transportation market is particularly vulnerable because its operations span multiple countries and major cities, where labor regulations vary widely by jurisdiction. This variation complicates compliance standardization and increases the cost of scaling service supply across different markets. Furthermore, it restricts platforms' ability to effectively balance driver incentives, consumer discounts, and technology investments simultaneously.
City-Level Licensing and Operational Restrictions
City-level licensing regulations limit the growth of the on-demand transportation market in tightly regulated urban areas. In Hong Kong, subsidiary legislation introduced a ride-hailing licensing framework, capping permits and requiring a unified driving test for taxi and ride-hailing operators. These regulations provide clarity but impose strict limits on how quickly platforms can scale supply to meet demand. In markets with capped permits, existing operators benefit from a more secure supply position, while new entrants face higher costs to achieve sufficient driver density. As a result, the on-demand transportation market remains vulnerable to inconsistent local regulations, even when national demand trends are favorable. Over time, such restrictions shift competition from open market expansion to strategies focused on regulatory compliance, partnerships, and licensed fleet collaborations.
*Our forecasts treat driver/restraint impacts as directional, not additive. The impact forecasts reflect baseline growth, mix effects, and variable interactions.
Segment Analysis
By Service: Ride-Hailing Leads While Micro-Mobility Reshapes Short-Distance Urban Trips
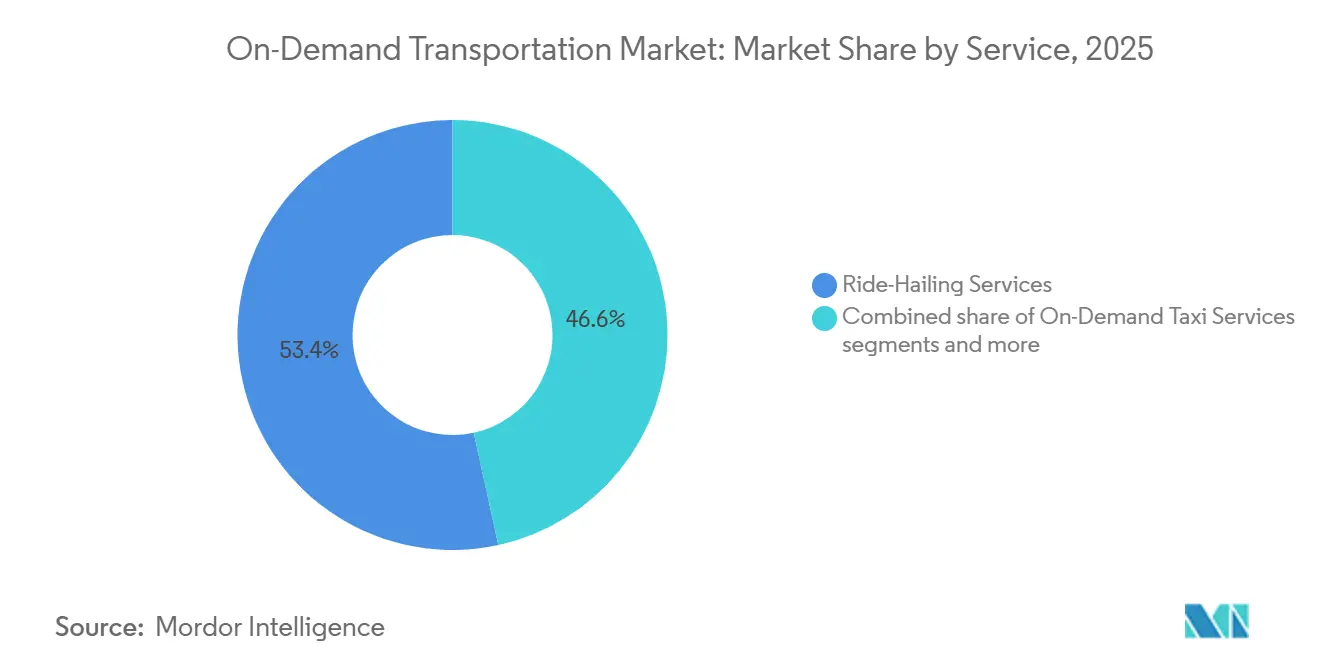
Ride-hailing services held 53.42% of the on-demand transportation market share in 2025, making it a major contributor to service revenue. This segment dominates because it meets diverse daily needs, including commuting, airport transfers, business travel, and evening trips. Uber recorded 13.567 billion trips in 2025, reflecting strong demand that supports the scale economics of ride-led platforms. Ride-sharing and carpooling services are also gaining importance, especially where fuel costs and commute length are key considerations. On-demand taxi services remain relevant in regulated cities, where licensed fleets and app platforms coexist, allowing digital convenience while maintaining formal taxi controls.
Micro-mobility is projected to grow at 6.46% CAGR from 2026 to 2031, driven by demand for short urban trips with quick access, lower costs, and easier parking. NACTO reported 150 million shared bike and scooter trips in 2025, including 58 million e-scooter trips and 82 million station-based bike-share trips. In Europe, 2025 saw 353 million shared e-scooter trips and 136 million shared e-bike trips, with a lower injury risk per million trips compared to 2021[4]. These trends highlight the market’s shift toward segmentation by trip distance and use case, aligning with urban mobility plans that integrate shared, low-emission modes into city transport systems.

By Vehicle Type: Passenger Cars Lead, but Two-Wheeler Economics Shape the Next Growth Phase
Passenger cars accounted for 70.13% of global revenue in 2025, maintaining their position as the largest vehicle class in the on-demand transportation market. This is due to their versatility, which enables them to cater to ride-hailing, urban transport, airport travel, and enterprise bookings. The segment's higher-end services saw increased usage, with Lyft reporting growth in Black, Black SUV, and XXL services in early 2026. Uber's planned acquisition of Blacklane highlights the focus on chauffeur-led and higher-yield services. Vans and shuttles remain relevant for group transport, supported by recovering business travel budgets and the adoption of mobility programs. Despite growth in other vehicle types, passenger cars continue to lead in revenue contribution.
Two-wheelers are projected to grow at a CAGR of 6.84% through 2031, making them the fastest-growing vehicle type in the on-demand transportation market. They address cost and speed challenges effectively in congested urban areas, particularly in India and other Asian markets where short-distance travel demand is high. Two-wheelers offer lower entry costs for drivers and greater route flexibility in dense areas. As electrification and clean-fleet compliance gain importance, larger platforms are better positioned to standardize two-wheeler deployment and financing. While passenger cars dominate revenue, two-wheelers are central to the market's next phase of growth.
By End User: Individual Consumers Anchor Demand While Corporate Mobility Diversifies Revenue
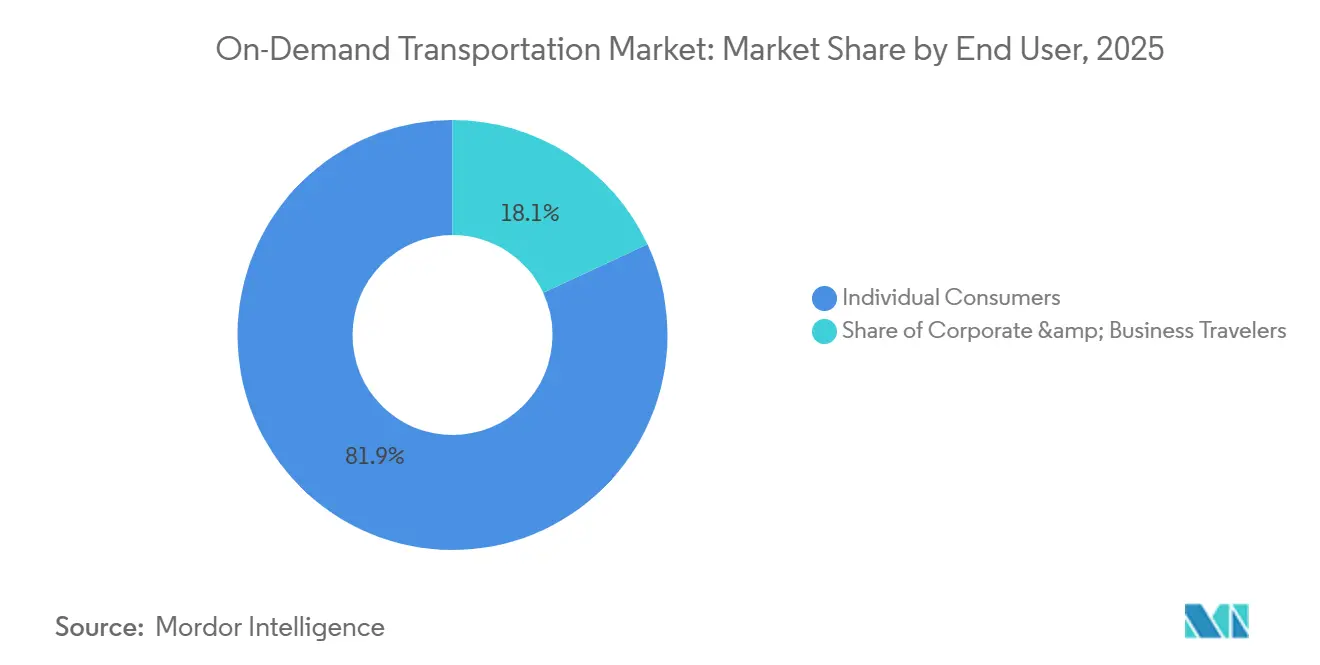
Individual consumers accounted for 81.93% of end-user revenue in 2025, making them the primary demand base for the on-demand transportation market. Their significance lies in the frequency and variety of trips, including commuting, errands, leisure travel, and occasional rides. This group is highly sensitive to the cost comparison between vehicle ownership and access-based mobility. With ownership costs remaining high, on-demand transportation becomes a practical option for urban residents who do not require daily car use. Consumer demand also supports app retention, subscription benefits, and feature adoption, driven by predictable daily usage patterns. The industry continues to rely on individual riders, even as enterprise demand grows more appealing from a margin perspective.
Corporate and business travelers are projected to grow at a CAGR of 7.02% through 2031, reflecting a recovery in managed ground transport spending. SAP Concur reported in June 2026 that 82% of CFOs expected their company’s travel budget to increase, with 97% viewing business travel as critical to growth. Element Arval noted that 94% of fleet managers had implemented or planned at least one employee mobility solution. Enterprise programs prioritize auditability, duty of care, centralized billing, and scheduled access, driving demand for group transfer formats and API-integrated travel tools. As companies enhance travel oversight while restoring budgets, corporate usage is expected to remain the most dynamic end-user segment during the forecast period.
By Booking Platform: Mobile Apps Consolidate a Structural Lead Across All Market Tiers
Mobile application-based bookings accounted for 85.31% of revenue in 2025 and are projected to grow at a CAGR of 7.56% through 2031. This reflects its importance in the consumer journey, with no viable alternatives to app-first booking. The on-demand transportation market relies on apps for trip requests, identity verification, support, stored value, rewards, and multi-service access. Grab’s GrabX 2026 launch introduced AI features like Group Ride coordination and travel support tools, while Uber’s GO-GET 2026 event added AI-driven booking and search functions. These developments indicate continued investment in mobile booking, which is expected to strengthen its position in the market during the forecast period.
Web-based and phone-based booking channels serve narrower but essential roles. Web tools are useful for corporate procurement, travel desk workflows, and pre-booked transport requiring reporting and policy controls. Phone booking remains relevant for older users, low-digital-literacy riders, and regulatory environments prioritizing accessibility. These channels will persist as support layers around the app-centric core. Revenue trends favor smartphone-based access, and platforms are likely to focus on mobile-based personalization and multimodal coordination rather than expanding legacy booking formats.
Geography Analysis
Asia-Pacific accounted for 38.74% of global revenue in 2025, maintaining its position as the largest regional block in the on-demand transportation market. Urban scale, high mobile adoption, and a mix of ride-hailing, bike-based access, and super-app usage drive this dominance. India plays a key role due to price-sensitive urban demand, short-trip frequency, and the relevance of two-wheelers, which support high service usage. Consumers in the region prefer using a single app for mobility, payments, and daily services, fostering retention and offering a broader service range. Asia-Pacific is expected to remain central to global demand despite faster growth in specific niches elsewhere.
North America and Europe emphasize profit discipline, public integration, and regulated service expansion. Uber and Lyft reported strong financial results in 2025, reflecting a shift toward prioritizing unit economics and cash generation. In North America, micro-mobility and public-linked demand remain active, supported by NACTO trip data and Massachusetts funding for microtransit and last-mile access. Europe is formalizing policies through sustainable urban mobility planning, while platform consolidation has increased with Lyft’s acquisitions in 2025 and 2026. These regions demonstrate market maturity while accommodating new formats like microtransit and corporate mobility solutions.
The Middle East & Africa is projected to grow at a 6.97% CAGR through 2031, driven by urbanization, digital adoption, and government-backed mobility modernization in GCC cities. South America offers expansion opportunities due to price sensitivity, infrastructure gaps, and long commutes, favoring shared and app-based transport. Both regions focus on affordability, accessibility, and route efficiency, creating opportunities for ride-hailing, shared mobility, and lighter-vehicle formats. Regional leadership and growth remain distributed, offering multiple paths for market expansion through 2031.
Competitive Landscape
The on-demand transportation market remains fragmented, with a few large platforms influencing technology trends and capital allocation. Companies such as Uber, Lyft, Grab, Didi, and Ola shape strategic discussions, with their strengths varying by geography, vehicle mix, and services. Uber’s performance highlights the scale advantage of global operators, while Lyft’s profitability underscores the growing importance of financial benchmarks in mature markets. The market focus has shifted from volume growth to service diversity, disciplined expansion, and operational efficiency, driving interest in broader mobility services.
Recent strategic initiatives indicate that companies are expanding their roles in mobility. Uber’s acquisitions and partnerships, including moves into chauffeur services, hotel bookings, and delivery businesses, reflect a focus on geographic expansion and integrated services. Grab’s acquisitions in delivery and financial services indicate a strategy centered on mobility-driven demand. Lyft has strengthened its presence in Europe and enhanced its service offerings. These actions highlight a shift in competition toward platform depth and service expansion rather than rider numbers.
Regional players like Bolt, inDrive, and Ola remain significant in markets with unique local conditions. Uber’s disclosures on investments in autonomous mobility and related technologies emphasize the importance of innovation in long-term strategies. Future competition is expected to expand into automation, bundled travel, and enterprise mobility. Smaller players are likely to succeed in niche markets, while factors such as scale, data capabilities, regulatory readiness, and service offerings are expected to drive market leadership over geographic presence.
On-Demand Transportation Industry Leaders
-
Uber Technologies Inc.
-
Didi Chuxing Technology Co.
-
Lyft, Inc.
-
Grab Holdings Limited
-
Ola Cabs (ANI Technologies Pvt Ltd.)
- *Disclaimer: Major Players sorted in no particular order
Recent Industry Developments
- April 2026: Uber announced a partnership with Expedia Group at its GO-GET 2026 event, offering in-app hotel bookings for over 700,000 properties and credits for Uber One members. Uber rides will integrate into the Expedia app starting June 2026, with plans for international expansion.
- March 2026: Grab will acquire Delivery Hero's foodpanda delivery business in Taiwan for USD 600 million on a cash-free, debt-free basis, subject to regulatory approvals. The deal, expected to close in H2 2026, is projected to positively impact Grab's 2026 revenue guidance of USD 4.04 billion to USD 4.10 billion.
- March 2026: Uber will acquire Blacklane, a chauffeur service operating in over 500 cities across 60+ countries, to support its Uber Elite luxury travel initiative. The transaction is expected to close by the end of 2026.
- February 2026: Uber agreed to acquire Getir's delivery portfolio in Türkiye, including food, grocery, retail, and water delivery. Supported by Mubadala Investment Company, the deal strengthens Uber's presence in the Turkish market and expands its super-app delivery capabilities.
Global On-Demand Transportation Market Report Scope
| Ride-Hailing Services |
| Ride-Sharing / Carpooling Services |
| On-Demand Taxi Services |
| Micro-Mobility Services (E-Scooters & Bike Sharing) |
| Passenger Cars |
| Two-Wheelers |
| Vans & Shuttles |
| Micro-Mobility Vehicles |
| Individual Consumers |
| Corporate & Business Travelers |
| Mobile Application-Based Booking |
| Web-Based Booking |
| Phone-Based Booking |
| North America | United States |
| Canada | |
| Mexico | |
| South America | Brazil |
| Peru | |
| Chile | |
| Argentina | |
| Rest of South America | |
| Europe | United Kingdom |
| Germany | |
| France | |
| Spain | |
| Italy | |
| BENELUX (Belgium, Netherlands, and Luxembourg) | |
| NORDICS (Denmark, Finland, Iceland, Norway, and Sweden) | |
| Rest of Europe | |
| Asia-pacifc | India |
| China | |
| Japan | |
| Australia | |
| South Korea | |
| Southeast Asia (Singapore, Malaysia, Thailand, Indonesia, Vietnam, and Philippines) | |
| Rest of Asia-pacifc | |
| Middle East and Africa | United Arab Emirates |
| Saudi Arabia | |
| South Africa | |
| Nigeria | |
| Rest of Middle East and Africa |
| By Service | Ride-Hailing Services | |
| Ride-Sharing / Carpooling Services | ||
| On-Demand Taxi Services | ||
| Micro-Mobility Services (E-Scooters & Bike Sharing) | ||
| By Vehicle Type | Passenger Cars | |
| Two-Wheelers | ||
| Vans & Shuttles | ||
| Micro-Mobility Vehicles | ||
| By End User | Individual Consumers | |
| Corporate & Business Travelers | ||
| By Booking Platform | Mobile Application-Based Booking | |
| Web-Based Booking | ||
| Phone-Based Booking | ||
| By Geography | North America | United States |
| Canada | ||
| Mexico | ||
| South America | Brazil | |
| Peru | ||
| Chile | ||
| Argentina | ||
| Rest of South America | ||
| Europe | United Kingdom | |
| Germany | ||
| France | ||
| Spain | ||
| Italy | ||
| BENELUX (Belgium, Netherlands, and Luxembourg) | ||
| NORDICS (Denmark, Finland, Iceland, Norway, and Sweden) | ||
| Rest of Europe | ||
| Asia-pacifc | India | |
| China | ||
| Japan | ||
| Australia | ||
| South Korea | ||
| Southeast Asia (Singapore, Malaysia, Thailand, Indonesia, Vietnam, and Philippines) | ||
| Rest of Asia-pacifc | ||
| Middle East and Africa | United Arab Emirates | |
| Saudi Arabia | ||
| South Africa | ||
| Nigeria | ||
| Rest of Middle East and Africa | ||
Key Questions Answered in the Report
What is the projected value of the on-demand transportation sector by 2031?
The on-demand transportation market is forecast to reach USD 348.98 billion by 2031 from USD 264.75 billion in 2026, reflecting continued demand for app-based and shared urban mobility solutions.
Which service category currently leads revenue generation?
Ride-hailing services accounted for 53.42% of total revenue in 2025, making them the largest service block, even as micro-mobility posted the fastest growth outlook.
Which vehicle format is growing the fastest through 2031?
Two-wheelers are expected to record the highest CAGR at 6.84% through 2031, supported by their cost and speed advantage in dense urban corridors.
Why are mobile apps so important in this sector?
Mobile application-based booking accounted for 85.31% of revenue in 2025 and is also the fastest-growing booking format, with a 7.56% CAGR, indicating that app-led access now anchors the customer journey.
Which region holds the largest revenue share?
Asia-Pacific accounted for 38.74% of global revenue in 2025, driven by urban density, high smartphone adoption, and strong demand for ride-hailing and two-wheeler mobility.
What are the main risks affecting growth through 2031?
The main constraints are labor classification pressure, city permit limits, pricing intervention, and insurance complexity, which affect margins and operating flexibility more than overall demand.